Inox Wind: Decision Zone at 200-WMA — Bounce or Breakdown?Inox Wind is currently trading at an important technical zone, sitting near the 200-week moving average . This area often acts as long-term support, but it is not a guarantee of a reversal .
From a structural perspective, the broader move looks corrective , unfolding as a (W)-(X)-(Y) pattern . The decline from wave (b) appears to be forming an (a)(b)(c) correction , moving inside a descending channel , which keeps the broader trend under pressure for now.
The 100% Fibonacci extension of wave (a) from (b) comes around 96.66 , while the 100–104 zone acts as a major support pivot. This zone becomes crucial going forward.
Bullish scenario:
If price holds above the 100–104 zone , breaks the descending channel, and is supported by a clear volume expansion , it could signal that the corretion is nearing completion and a trend reversal attempt is underway.
Bearish scenario:
A weekly close below ~100 , especially without any volume support, keeps the corrective structure active and opens the door for a deeper move toward the 40–60 support zone , where the next meaningful demand area exists.
At this stage, volume remains the key missing confirmation . Without a volume breakout, any bounce should be treated as corrective , not impulsive.
Overall, Inox Wind is at a decision point , where the next few weeks of price action and volume behavior will likely define the next major trend.
Disclaimer:
This analysis is for educational purposes only and does not constitute investment advice. Please do your own research (DYOR) before making any trading decisions.
Community ideas

BTCUSD ANALYSIS OVER H1 CHARTMonitoring BTCUSD for a potential short-term sell setup as price reacts around key resistance and structure.
Waiting for confirmation to define precise entry, targets, and risk levels.
Looking for a selling opportunity in BTC

XAGUSD 1H Bearish Trendline Rejection📉 Market Structure
Primary trend: Bearish
Price is making lower highs & lower lows
Clear descending channel visible
The recent rally looks like a corrective pullback, not a trend reversal
🔴 Key Rejection Zone
Resistance: 83.50 – 84.20
Price has been rejected exactly at the descending trendline
Bearish reaction candle + arrow confirms seller dominance
📊Pattern Insight
Structure resembles a bear flag / falling channel
Impulse down → consolidation → rejection → continuation expected
Trendline break did NOT happen → bearish continuation favored
❌ Invalidation
Hourly close above 85.00 setup
Clean breakout + hold above descending trendline→ would delay or invalidate bearish setup

NIFTY50 Short View11th Feb 2026 / 13:50
Why Short?
1. Breakdown of Range.
2. Within Huge Selloff candle recently.
3. Gaps are visible for downside.
2 different short trade with different targets are in charts.
R/R is favorable
Suggested Options range: 25900 to 25750

Gold Trading Strategy for 11th Feb 2026📊 Intraday Trading Setup (Based on 15-Minute Candle)
Time Frame: 15-Minute
Methodology: Price Action + Breakout Confirmation
Tool Reference: Icona DNA$.M
🔼 BUY SETUP (Bullish Scenario)
Condition:
Buy only if a 15-minute candle closes above 5080
Entry:
👉 Buy above the high of the confirmed 15-minute candle closing above 5080
Targets:
🎯 Target 1: 5090
🎯 Target 2: 5100
🎯 Target 3: 5110
View:
Sustained price action above 5080 indicates bullish strength.
As per Icona DNA$.M, momentum expansion and volume confirmation favor an upside continuation once resistance is decisively broken.
🔽 SELL SETUP (Bearish Scenario)
Condition:
Sell only if a 15-minute candle closes below 4998
Entry:
👉 Sell below the low of the confirmed 15-minute candle closing below 4998
Targets:
🎯 Target 1: 4980
🎯 Target 2: 4965
🎯 Target 3: 4950
View:
A breakdown below 4998 signals weakness.
According to Icona DNA$.M, loss of structure and bearish momentum can accelerate selling pressure toward lower demand zones.
🛑 Risk Management
Always trade with strict stop loss based on your risk appetite.
Avoid over-leveraging.
Trade only after candle close confirmation, not on assumption or early breakout.
⚠️ DISCLAIMER
This analysis is for educational purposes only.
Market conditions are dynamic, and trading involves substantial risk.
The author is not responsible for any profit or loss arising from the use of this information.
Please consult your financial advisor before taking any trades.
Trade at your own risk.

XAUUSD GOLD Analysis on (11 Feb 2026)#XAUUSD UPDATEDE
Current price - 5054
If price stay above 5015,then next target 5080 and 5110 and below that 4970
Plan1;If price break 5040-5050 area,and stay above 5050 we will placed buy order in gold with target of 5080 and 5110 & stop loss should be placed at 5115

SENSEX Spot levelsAnalysis 12th Feb 2026 & Onwards SENSEX Spot levelsAnalysis 12th Feb 2026 & Onwards Intra-Swing & Positional.
Weekly level Analysis forb12th Feb 2026.
💥PCR Data (without Revision)
Weekly (12/02/2026 EXP) Basis=>
Put OI: 16,30,502, Call OI: 18,12,183, PCR: 0.90. Trend Strength: Neutral.
Intraday Basis (mainly OI change Data for Day):
Put OI Change: 48,793, Call OI Change: 7,96,515, Change OI PCR: 0.56. Trend Strength: BEARISH
Remark: Reversal / Pull Back after panicking. (Exception: Hammering Geo-political NEWS
━━━━━━━━━₹₹₹₹₹₹₹₹₹₹₹₹━━━━━━━━
💥Level Interpretation / description:
L#1: If the candle crossed & stays above the “Buy Gen”, it is treated / considered as Bullish bias.
L#2: Possibility / Probability of REVERSAL near RLB#1 & UBTgt
L#3: If the candle stays above “Sell Gen” but below “Buy Gen”, it is treated / considered as Sidewise. Aggressive Traders can take Long position near “Sell Gen” either retesting or crossed from Below & vice-versa i.e. can take Short position near “Buy Gen” either retesting or crossed downward from Above.
L#4: If the candle crossed & stays below the “Sell Gen”, it is treated / considered a Bearish bias.
L#5: Possibility / Probability of REVERSAL near RLS#1 & USTgt
HZB (Buy side) & HZS (Sell side) => Hurdle Zone,
*** Specialty of “HZB#1, HZB#2 HZS#1 & HZS#2” is Sidewise (behaviour in Nature)
Rest Plotted and Mentioned on Chart
Color code Used:
Green =. Positive bias.
Red =. Negative bias.
RED in Between Green means Trend Finder / Momentum Change
/ CYCLE Change and Vice Versa.
Notice One thing: HOW LEVELS are Working.
Use any Momentum Indicator / Oscillator or as you "USED to" to Take entry.
━━━━━━━━━━━━━━━━━━━━━━━━━━━━━━━━━━━━━━━━━━━
⚠️ DISCLAIMER:
The information, views, and ideas shared here are purely for educational and informational purposes only. They are not intended as investment advice or a recommendation to buy, sell, or hold any financial instruments. I am not a SEBI-registered financial adviser.
Trading and investing in the stock market involves risk, and you should do your own research and analysis. You are solely responsible for any decisions made based on this research.
"As HARD EARNED MONEY IS YOUR's, So DECISION SHOULD HAVE TO BE YOUR's".
━━━━━━━━━━━━━━━━━━━━━━━━━━━━━━━━━
❇️ Follow notification about periodical View
💥 Do Comment for Stock WEEKLY Level Analysis.🚀
📊 Do you agree with this view?
✈️ HIT THE PLANE ICON if this technical observation resonates with you. It will Motivate me.
━━━━━━━━━━━━━━━━━━━━━━━━━━━━━━━━━
💡 If You LOOKING any CHART & want for Level and ANALYZE?
Share your desired stock names in the comments below! I will try to analyze the chart Levels, patterns and share my technical view (so far my Knowledge).
If Viewers think It can identify meaningful setups. Looking forward to hearing from all of you — let's keep this discussion going and help each other make better trading decisions.

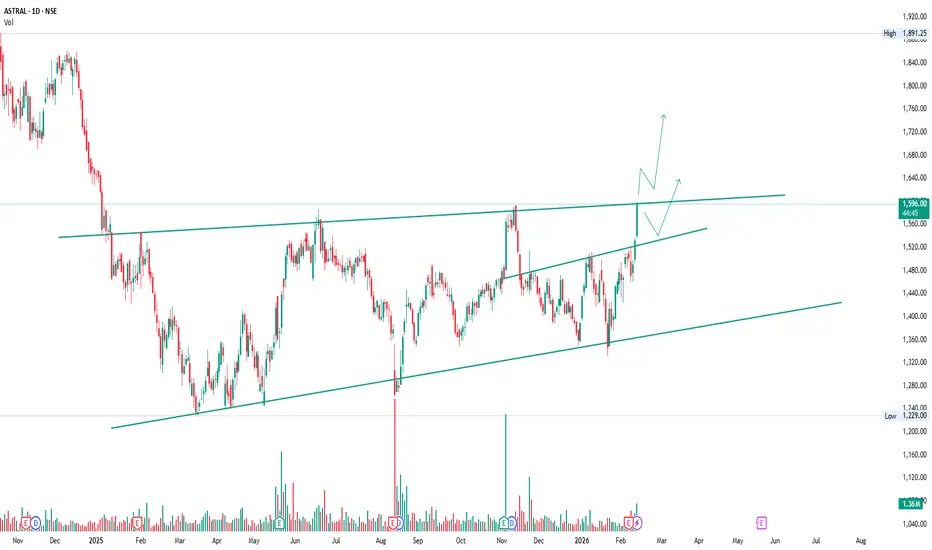
ASTRAL Rising Channel BreakoutASTRAL has been respecting a rising channel pattern, making consistent higher highs and higher lows.
Price recently pulled back to the lower boundary and bounced strongly — confirming buyers are defending structure.
Now it has pushed back toward the upper channel resistance with strong bullish candles.
This is important because:
Channel support held
Momentum expanded from the lower zone
Price is now testing the supply area
If price sustains above the upper boundary, it can trigger a fresh expansion move.
If rejected, the channel remains intact for another rotation.
This is not random movement.
It’s structured price action inside a controlled bullish channel.
NIFTY Scalping / Short Range Level Analysis for 12 th FEB 2026NIFTY Scalping / Short Range Level Analysis for 12 th FEB 2026
👇🏼Screenshot of NIFTY Spot All-day(11th FEB 2026) in 3 min TF with parodical update.
🚀Follow GIFTNIFTY Post for NF levels
PCR data analysis etc will be Added in "Add Note" section.
━━━━━━━━━₹₹₹₹₹₹₹₹₹₹₹₹━━━━━━━━
💥Level Interpretation / description:
L#1: If the candle crossed & stays above the “Buy Gen”, it is treated / considered as Bullish bias.
L#2: Possibility / Probability of REVERSAL near RLB#1 & UBTgt
L#3: If the candle stays above “Sell Gen” but below “Buy Gen”, it is treated / considered as Sidewise. Aggressive Traders can take Long position near “Sell Gen” either retesting or crossed from Below & vice-versa i.e. can take Short position near “Buy Gen” either retesting or crossed downward from Above.
L#4: If the candle crossed & stays below the “Sell Gen”, it is treated / considered a Bearish bias.
L#5: Possibility / Probability of REVERSAL near RLS#1 & USTgt
HZB (Buy side) & HZS (Sell side) => Hurdle Zone,
*** Specialty of “HZB#1, HZB#2 HZS#1 & HZS#2” is Sidewise (behaviour in Nature)
Rest Plotted and Mentioned on Chart
Color code Used:
Green =. Positive bias.
Red =. Negative bias.
RED in Between Green means Trend Finder / Momentum Change
/ CYCLE Change and Vice Versa.
Notice One thing: HOW LEVELS are Working.
Use any Momentum Indicator / Oscillator or as you "USED to" to Take entry.
━━━━━━━━━━━━━━━━━━━━━━━━━━━━━━━━━━━━━━━━━━━
⚠️ DISCLAIMER:
The information, views, and ideas shared here are purely for educational and informational purposes only. They are not intended as investment advice or a recommendation to buy, sell, or hold any financial instruments. I am not a SEBI-registered financial adviser.
Trading and investing in the stock market involves risk, and you should do your own research and analysis. You are solely responsible for any decisions made based on this research.
"As HARD EARNED MONEY IS YOUR's, So DECISION SHOULD HAVE TO BE YOUR's".
━━━━━━━━━━━━━━━━━━━━━━━━━━━━━━━━━
❇️ Follow notification about periodical View
💥 Do Comment for Stock WEEKLY Level Analysis.🚀
📊 Do you agree with this view?
✈️ HIT THE PLANE ICON if this technical observation resonates with you. It will Motivate me.
━━━━━━━━━━━━━━━━━━━━━━━━━━━━━━━━━
💡 If You LOOKING any CHART & want for Level and ANALYZE?
Share your desired stock names in the comments below! I will try to analyze the chart Levels, patterns and share my technical view (so far my Knowledge).
If Viewers think It can identify meaningful setups. Looking forward to hearing from all of you — let's keep this discussion going and help each other make better trading decisions.

Maxhealth• Market structure is key: Lower Highs + Lower Lows = Downtrend
• Channels help define direction and control risk
• Always mark major support–resistance zones before planning a trade
• Support can turn into resistance after breakdown
• A bounce doesn’t mean trend reversal — wait for confirmation
• RSI coming out of oversold shows momentum improvement, not trend change
• Trade levels, not emotions
• Let price confirm before assuming upside
• Patience and discipline are edge in trending markets
Learning focus: Follow structure first, indicators second.*

NIFTY might start facing rejection from here! As we can see NIFTY remained sideways to negative throughout the day exactly as analysed. Now it can be seen forming a indecision kinda candle in daily time frame at the supply zone hence any signs of rejection around the given supply zone could show continuation of downfall so plan your trades accordingly and keep watching everyone.

XAUUSD – Consolidating Above 5,000 Before the Next Expansion XAUUSD – Consolidating Above 5,000 Before the Next Expansion | Lana ✨
Gold is currently trading around 5,020 USD/oz after a controlled technical pullback from recent highs. The overall structure, however, suggests this is a pause within a broader medium-term rising channel rather than a trend reversal.
On the H2 timeframe, price continues to respect the ascending channel and internal trendline support. The 5,000–5,050 zone has now become a key liquidity battleground between short-term sellers and medium-term buyers.
🔍 Technical View
5,000 USD remains the key psychological pivot. Holding above this level keeps the medium-term bullish structure intact.
5,260–5,270 (Sell FVG zone) acts as the next supply region and liquidity target if bullish momentum expands.
5,450–5,600 represents higher-timeframe liquidity near the all-time high zone, where stronger sell reactions may emerge.
Any pullback toward the lower boundary of the channel would likely be seen as structural re-accumulation rather than reversal.
Price action suggests compression within value, indicating liquidity build-up before a potential expansion move.
🌍 Fundamental Backdrop
Gold remains supported by three major drivers:
A weaker US Dollar as markets await key US data releases.
Cooling US Treasury yields, reducing the opportunity cost of holding gold.
Ongoing central bank gold accumulation and geopolitical uncertainty, reinforcing long-term demand.
Markets are closely watching upcoming Nonfarm Payrolls and CPI data, which will shape expectations around future Fed policy:
A more dovish outcome may trigger a breakout above current resistance.
A more hawkish surprise could create short-term pressure, though deeper pullbacks may still attract accumulation within the broader trend.
🧠 Lana’s View
The pullback near 5,000 appears technical, not structural. As long as the rising channel holds, the medium-term bias remains constructive.
Gold is consolidating — not reversing.
✨ Stay patient, respect liquidity zones, and let the data confirm the next expansion.

NIFTY Levels for Today
Here are the NIFTY's Levels for intraday (in the image below) today. Based on market movement, these levels can act as support, resistance or both.
Please consider these levels only if there is movement in index and 15m candle sustains at the given levels. The SL (Stop loss) for each BUY trade should be the previous RED candle below the given level. Similarly, the SL (Stop loss) for each SELL trade should be the previous GREEN candle above the given level.
Note: This idea and these levels are only for learning and educational purpose.
Your likes and boosts gives us motivation for continued learning and support.

BTCUSDT.P – Elliott Wave AnalysisSHORT-TERM TRADE PLAN AS PER ELLIOTT WAVE ANALYSIS:
💰 Current Price: ~67230
🔻 Scenario 1 (Downside):
- 🛒 Buying interest may emerge at Intermediate Wave 2/B Support Zone → 62127 – 63890
- 📉 If deeper correction → Major Wave C Support Zone → 48412 – 53325
🔺 Scenario 2 (Upside):
- ⚠️ Selling pressure likely at Intermediate Wave C Resistance Zone → 76328 – 78091

Bitcoin Bybit chart analysis FEBURARY 10Hello
It's a Bitcoin Guide.
If you "follow"
You can receive real-time movement paths and comment notifications on major sections.
If my analysis was helpful,
Please click the booster button at the bottom.
This is Bitcoin's 30-minute chart.
The Nasdaq indicators will be released shortly at 10:30 AM.
The 4-hour chart is undergoing a MACD dead cross.
I've created today's strategy.
*When the light blue finger moves,
Short->Long switching or holding a long position.
This is a two-way neutral strategy.
1. The light blue finger at the top is the entry point for a short position at $70,032.7.
/ Stop-loss price if the orange resistance line is broken.
2. Switch to a long position at $67,889. / Stop-loss price if the purple support line is broken.
3. The first target for a long position at $70,848.3. Target prices are Top, Good, and so on.
If the light blue finger at the top falls immediately without touching 70K,
Long position holding at the first area at the bottom is the final defensive line. / Stop-loss price if the green support line is broken.
Below that is the bottom area.
Up to this point, I ask that you use my analysis for reference only.
I hope you operate safely, with a focus on principled trading and stop-loss orders.
Thank you.

TATA GOLD Next StepGold and gold-linked ETFs can be sensitive to:
📉 Short-Term Risks
Profit booking after strong rallies (can cause dips).
Global macro data (e.g., US rate news, dollar strength) affecting gold prices.
Market corrections can continue before new trend emerges.
📈 Short-Term Positives
Safe-haven demand remains strong — especially with geopolitical uncertainty and inflation concerns.
Corrective pullbacks often become entry points for long-term investors.
Important: Short-term price moves are hard to predict — gold prices fluctuate from day to day based on macro news and technical traders’ behavior.
On my advise for all investors may be buy maximum lot size of #TATAGOLDETF for earn Maximum Return to year and year

GIFTNIFTY Intra-Swing Level Analysis for 11th FEB 2026GIFTNIFTY Intra-Swing Level Analysis for 11th FEB 2026
PCR Data Analysis as of Now:
Weekly Basis (17/02/2026) EXP=>
Put OI: 16,14,158, : all OI, 19,17,544: PCR: 0.84, Trend Strength: Neutral
Intraday Basis=>
Put OI Chg: 5,89,749, Call OI Chg: 9,21,771, COI PCR: 0.64. Trend Strength: BEARISH
Special NOTE: Now @ 25997, Nearing Reversal / Pullback @ 25960- 25975
━━━━━━━━━₹₹₹₹₹₹₹₹₹₹₹₹━━━━━━━━
💥Level Interpretation / description:
L#1: If the candle crossed & stays above the “Buy Gen”, it is treated / considered as Bullish bias.
L#2: Possibility / Probability of REVERSAL near RLB#1 & UBTgt
L#3: If the candle stays above “Sell Gen” but below “Buy Gen”, it is treated / considered as Sidewise. Aggressive Traders can take Long position near “Sell Gen” either retesting or crossed from Below & vice-versa i.e. can take Short position near “Buy Gen” either retesting or crossed downward from Above.
L#4: If the candle crossed & stays below the “Sell Gen”, it is treated / considered a Bearish bias.
L#5: Possibility / Probability of REVERSAL near RLS#1 & USTgt
HZB (Buy side) & HZS (Sell side) => Hurdle Zone,
*** Specialty of “HZB#1, HZB#2 HZS#1 & HZS#2” is Sidewise (behaviour in Nature)
Rest Plotted and Mentioned on Chart
Color code Used:
Green =. Positive bias.
Red =. Negative bias.
RED in Between Green means Trend Finder / Momentum Change
/ CYCLE Change and Vice Versa.
Notice One thing: HOW LEVELS are Working.
Use any Momentum Indicator / Oscillator or as you "USED to" to Take entry.
━━━━━━━━━━━━━━━━━━━━━━━━━━━━━━━━━━━━━━━━━━━
⚠️ DISCLAIMER:
The information, views, and ideas shared here are purely for educational and informational purposes only. They are not intended as investment advice or a recommendation to buy, sell, or hold any financial instruments. I am not a SEBI-registered financial adviser.
Trading and investing in the stock market involves risk, and you should do your own research and analysis. You are solely responsible for any decisions made based on this research.
"As HARD EARNED MONEY IS YOUR's, So DECISION SHOULD HAVE TO BE YOUR's".
━━━━━━━━━━━━━━━━━━━━━━━━━━━━━━━━━
❇️ Follow notification about periodical View
💥 Do Comment for Stock WEEKLY Level Analysis.🚀
📊 Do you agree with this view?
✈️ HIT THE PLANE ICON if this technical observation resonates with you. It will Motivate me.
━━━━━━━━━━━━━━━━━━━━━━━━━━━━━━━━━
💡 If You LOOKING any CHART & want for Level and ANALYZE?
Share your desired stock names in the comments below! I will try to analyze the chart Levels, patterns and share my technical view (so far my Knowledge).
If Viewers think It can identify meaningful setups. Looking forward to hearing from all of you — let's keep this discussion going and help each other make better trading decisions.

BE READY!! ETH FALL. If ETH breaks down 1996-1992 support level with a strong red candle. It will give a strong selling.

Nifty50 analysis(11/2/2026).CPR: narrow + ascending cpr: trending
FII: 69.45 bought
DII: 1,174.21 bought
Highest OI: too soon to tell
CALL OI: 26000
PUT OI: 26000
Resistance: - 26000
Support : - 25950
conclusion:.
My pov
1.market is in buy on dip mode any fall or support can rise the market to 26000 to atm.
2. Yesterday forms a virgin cpr so today highly possible to touch cpr and rise . 25930 also today narrow cpr.
3. If it breaks 26000 then all time high is the target. Only if it close in day candle.
4. Fii and dii continusly buying this show the bullishness in market. Clearly market in trend and a trend rise from a sharp fall. Expect the anything can happen.
What IF:
1.market can fall upto 25900 there one hour candle 50ma support that gives a good support.
2. If market breaks 26000 then all time high is the resistance.
Psycology:
Make a trade with high possibilities. Dont hope one factor make multiple factor on your side.
note:
8moving average ling is blue colour.
20moving average line is green colour
50moving average line is red colour.
200moving average line is black colour.
cpr is for trend analysis.
MA line is for support and resistance.
Disclaimer:
Iam not Sebi registered so i started this as a hobby, please do your own analysis, any profit/loss you gained is not my concern. I can be wrong please do not take it seriously thank you

Amber - New High PossibilityAmber :
Good Breakout done and currently at resistance
Looks good above 7660, 8000 looks feasible, if 8000 is sustained, all time new high possible

BUY TODAY SELL TOMORROW for 5% DON’T HAVE TIME TO MANAGE YOUR TRADES?
- Take BTST trades at 3:25 pm every day
- Try to exit by taking 4-7% profit of each trade
- SL can also be maintained as closing below the low of the breakout candle
Now, why do I prefer BTST over swing trades? The primary reason is that I have observed that 90% of the stocks give most of the movement in just 1-2 days and the rest of the time they either consolidate or fall
Trendline Breakout in RISHABH
BUY TODAY SELL TOMORROW for 5%

SENSEX Spot level Analysis 11th Feb 2026 & Onwards SENSEX Spot level Analysis 11th Feb 2026 &
Onwards IntraSwing & Positional.
PCR Data Analysis:
Weekly (12 Feb 2026) EXP basis PCR:
Put OI: 11,81,709, Call OI: 10,15,668, PCR: 1.16. Trend Strength=> Bullish
Intraday Change Basis:
Put OI Chg: 5,31,883, Call OI Chg: 3,98,204, Change OI PCR: 1.34. Trend Strength=> BULLISH
━━━━━━━━━₹₹₹₹₹₹₹₹₹₹₹: ━━━━━━━━
💥Level Interpretation / description:
L#1: If the candle crossed & stays above the “Buy Gen”, it is treated / considered as Bullish bias.
L#2: Possibility / Probability of REVERSAL near RLB#1 & UBTgt
L#3: If the candle stays above “Sell Gen” but below “Buy Gen”, it is treated / considered as Sidewise. Aggressive Traders can take Long position near “Sell Gen” either retesting or crossed from Below & vice-versa i.e. can take Short position near “Buy Gen” either retesting or crossed downward from Above.
L#4: If the candle crossed & stays below the “Sell Gen”, it is treated / considered a Bearish bias.
L#5: Possibility / Probability of REVERSAL near RLS#1 & USTgt
HZB (Buy side) & HZS (Sell side) => Hurdle Zone,
*** Specialty of “HZB#1, HZB#2 HZS#1 & HZS#2” is Sidewise (behaviour in Nature)
Rest Plotted and Mentioned on Chart
Color code Used:
Green =. Positive bias.
Red =. Negative bias.
RED in Between Green means Trend Finder / Momentum Change
/ CYCLE Change and Vice Versa.
Notice One thing: HOW LEVELS are Working.
Use any Momentum Indicator / Oscillator or as you "USED to" to Take entry.
━━━━━━━━━━━━━━━━━━━━━━━━━━━━━━━━━━━━━━━━━━━
⚠️ DISCLAIMER:
The information, views, and ideas shared here are purely for educational and informational purposes only. They are not intended as investment advice or a recommendation to buy, sell, or hold any financial instruments. I am not a SEBI-registered financial adviser.
Trading and investing in the stock market involves risk, and you should do your own research and analysis. You are solely responsible for any decisions made based on this research.
"As HARD EARNED MONEY IS YOUR's, So DECISION SHOULD HAVE TO BE YOUR's".
━━━━━━━━━━━━━━━━━━━━━━━━━━━━━━━━━
❇️ Follow notification about periodical View
💥 Do Comment for Stock WEEKLY Level Analysis.🚀
📊 Do you agree with this view?
✈️ HIT THE PLANE ICON if this technical observation resonates with you. It will Motivate me.
━━━━━━━━━━━━━━━━━━━━━━━━━━━━━━━━━
💡 If You LOOKING any CHART & want for Level and ANALYZE?
Share your desired stock names in the comments below! I will try to analyze the chart Levels, patterns and share my technical view (so far my Knowledge).
If Viewers think It can identify meaningful setups. Looking forward to hearing from all of you — let's keep this discussion going and help each other make better trading decisions.

