Nasdaq trade breakdown US Tech 100 (NASDAQ) – Intraday Bias & Supply Zone Reaction
Price has rallied into a key supply zone near the day high, where selling pressure is expected.
Overall higher-timeframe bias remains bearish (Daily & H4), while H1 shows a short-term bullish retracement into supply.
📌 Key Observations
Strong rejection zone marked as supply
Price reacting near Day High
Bearish structure intact on Daily & H4
Lower-timeframe bullish move seen as a pullback
📉 Trade Expectation
Look for rejection / consolidation inside supply
Possible lower-high formation
Continuation move expected to the downside after confirmation
⚠️ Wait for price action confirmation before entry.
Risk management is essential.
Community ideas

XAUUSD cmp 5034 Key Levels to WatchGold (Spot) – Key Levels to Watch
Gold is facing strong supply in the 5040–5110 USD resistance zone. Repeated rejection from this area keeps the near term structure cautious.
Failure to sustain above 5110 USD may open downside towards 4650-4790 USD in short term.
On the upside, a decisive break and sustain above 5110 USD is required to resume bullish momentum towards 5383 USD
Volatility remains elevated due to global macro and rate expectations.
Best approach is to stick with levels, manage risk tightly and avoid emotional positioning.
This idea valid until the said levels.

CRUDE MCX FUTURE CRUDE POSSIBLE MOVE
RESISTANCE 6100, 6320
SUPPORT 5515, 5360
5515 below sustain or close invalidation
View is for education purpose only , we are not recommend any trade or investment
Always do your own analysis

Hidden Bearish Divergence appears on 30m Time frameI have marked a red resistance line on RSI on 30m time frame. Which is looks like a class B Bearish Divergence. If it loses the support box expect a swift drop toward $68K.

FOREX PAIRS IN PLAY session 28 09 02 26Scanning multiple forex pairs to filter high-quality trade setups. No trades are forced—only structure-based opportunities.
Note: There may be a delay in this video due to upload processing time.
Disclaimer: FX trading involves high leverage and substantial risk, and losses can exceed your initial investment. This content is for educational purposes only and should not be considered financial advice. Trade at your own risk.

TORNTPHARM 1 Week Time Frame 📊 Current Price (Approximate): ~₹3,930–₹3,970 on NSE/BSE.
📈 Short-Term (1-Week) Levels to Watch
🔹 Resistance (Upside)
R1: ~₹3,965 – ₹3,995 — near recent pivot resistance.
R2: ~₹3,990 – ₹4,020 — higher resistance zone, close to recent intraday highs.
R3: ~₹4,010 – ₹4,050 — psychological/upper range area and prior 52-week highs.
Note: A clear break and close above ~₹4,020–₹4,050 could shift short-term bias bullish within the week.
🔻 Support (Downside)
S1: ~₹3,910 – ₹3,920 — near pivot/support and recent short-term reaction low.
S2: ~₹3,880 – ₹3,890 — zone near 50-day moving average support.
S3: ~₹3,820 – ₹3,850 — deeper support if momentum weakens.
Weak market conditions or broader index decline could push prices toward the S2–S3 support zone.
🧠 What This Means in Practice
✔️ Above Resistance (~₹3,995–₹4,020) – bullish continuation might unfold within a week if buyers persist.
✔️ Below Support (~₹3,880) – increased risk of short-term pullback toward ~₹3,820.
✔️ RSI/oscillator readings tend to stay neutral–slightly bullish unless a strong trend emerges (indicators vary by platform).

SBICARD 1 Month Time Frame 📌 Latest Price Context:
• Stock is trading around the mid ₹750-₹760 zone.
• It has recently tested 52-week lows near ₹725 and remains below key moving averages — a bearish technical structure in the very short term.
📊 1-Month Timeframe Key Levels (Support & Resistance)
🔻 Support Levels (Buy Zones)
S1: ~₹745–₹747 — immediate support zone for dips.
S2: ~₹735–₹738 — stronger support beneath the first fold.
S3: ~₹725–₹729 — major support near 52-week low; breaking below risks extra downside.
➡ A breakdown below ₹725 on monthly closes would be bearish.
📈 Resistance Levels (Targets / Sell Zones)
R1: ~₹762–₹763 — near the pivot/resistance in current 1-month profile.
R2: ~₹769–₹770 — resistance zone at recent short term swing highs.
R3: ~₹778–₹780+ — higher resistance – breakout above helps bullish recovery.
➡ Sustained closes above ~₹770–₹780 can shift short-term bias to neutral/bullish.
🔍 Trading Bias Guidance
📉 Bearish to Neutral if price stays below ₹762–₹770
📈 Bullish structure if breaks and holds above ₹770–₹780

Price Acceptance & Volume Distribution Study (PWL | 1H)Intraday Market Structure & Volume Profile Study (1H)
This idea presents an intraday market structure study of
PhysicsWallah Ltd. on the 1-hour timeframe, using Volume Profile
to analyze price acceptance and participation.
A Fixed Range Volume Profile has been applied from the onset of the
impulsive decline to the most recent hourly price action, allowing
observation of how value has evolved over time.
Key Observations:
1) A clearly defined value area (VAH–VAL) is visible, indicating
where the majority of intraday participation has occurred.
2) Price has repeatedly rotated within this value area across
multiple sessions, suggesting a balance phase rather than a
directional trend.
3) The Point of Control (POC) highlights the price level where the
highest concentration of trading activity took place, serving as
a reference for accepted value.
4) Attempts to move above the value area have shown limited
continuation, implying that supply remains active at higher
prices.
5) Recent price action is interacting with a previously tested
demand zone below value, where intraday risk becomes more clearly
defined.
Critical Structural Shift:
Price is currently trading below the Value Area Low (VAL).
This is not a neutral condition.
Trading outside value indicates rejection of previously accepted
prices and a shift from balance to imbalance.
As long as price remains below VAL, the market is not accepting
higher value and is actively exploring lower prices.
Any bullish assumption without re-acceptance back into value
remains structurally weak.

XAUUSD ANALYSIS OVER 15M CHART.Gold (XAUUSD) is showing signs of strength, and I’m positioning for a potential upside move.
A disciplined risk-to-reward setup with clear levels. If you’re looking for live, well-analysed trading setups and market updates, join the link in bio and trade with structure and patience.

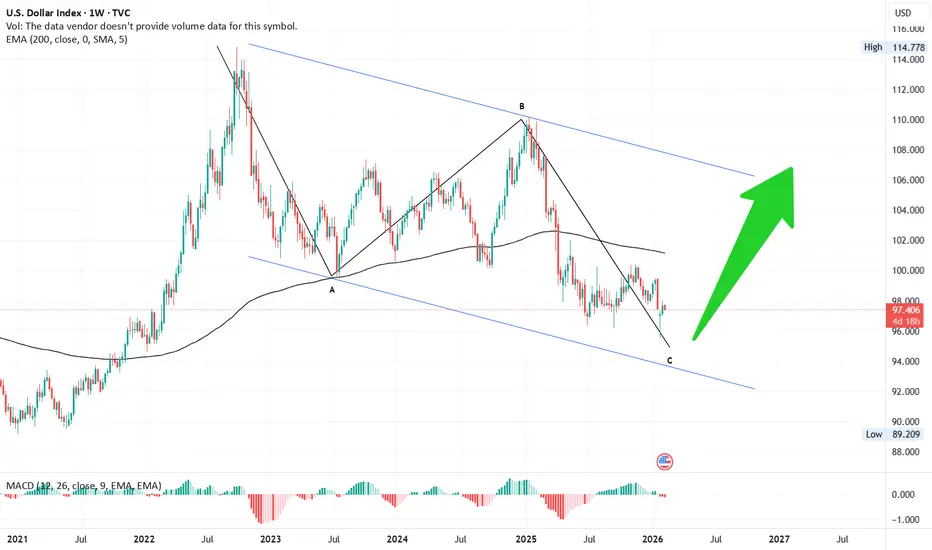
#DXY📊 DXY Technical Outlook 💵
On 26 Sep 2022, the Dollar Index (DXY) began a weekly correction. What followed was a clear 5-wave decline, bottoming at 99.75 on 17 Jul 2023 — marking the completion of Wave A.
From there, the index rallied in 3 waves, reaching a high of 110 on 23 Dec 2024, forming Wave B. Currently, the C wave decline looks nearly complete as of 26 Jan, with price also testing the 200 EMA on the monthly chart.
⚡ Key Signal to Watch:
If DXY crosses above 100, it could signal the start of a new bull cycle, with potential upside targets in the 110–120 range.
🔑 Takeaway:
The structure suggests a zig-zag correction is unfolding, and the next move could define the dollar’s medium-term trend.
TechnicalAnalysis #DXY #Forex #TradingInsights #MarketOutlook
JINDALSTEL 1 Day Time Frame 📊 Current Price Snapshot (Today, NSE)
Live price: ~₹1,189-₹1,200 approx (updated intraday)
52-week range: ~₹770 (low) – ₹1,191.70 (high)
So the price is trading near its recent highs.
📈 Daily Pivot & Key Technical Levels (1-Day Time Frame)
(based on most recent market data)
Pivot Calculation (Daily – Standard)
📍 Pivot (central reference): ~₹1,200.10
If price is above this, bias can be mildly bullish intraday.
Resistance Levels
🔼 R1: ~₹1,210.30
🔼 R2: ~₹1,228.90
(Break of these with volume may accelerate upside)
Support Levels
🔽 S1: ~₹1,181.50
🔽 S2: ~₹1,171.30
🔽 S3: ~₹1,152.70
📉 If price breaks below S1/S2 with strength, watch for deeper pullbacks toward S3.
🧠 How to Read These Levels
Above pivot + holding supports → Upside bias.
Below pivot + weakness on break of S1/S2 → Intraday bearish tilt.
Resistance cluster around R1-R2 (~₹1,210-₹1,228) can act as a cap if upside momentum weakens.
📌 Short Technical Summary
Price is near multi-week highs and above pivot, showing strength this session.
Daily support clusters ~₹1,181-₹1,171 zone are important for downside stability.
Resistance begins near ~₹1,210 and extends toward ~₹1,229+.

GOLD before US Jobs & Inflation Data: Key Scenarios?🌍 Macro Context & Market Expectations
This week, the market is closely focused on:
US employment data
US inflation data (CPI / PCE)
Additionally, traders are monitoring:
Developments in US–Iran negotiations
US Supreme Court rulings related to trade tariffs
→ These factors may amplify short-term volatility, especially around key technical levels.
📈 Trend & Market Structure
Medium-term trend: BULLISH
Price has rebounded strongly from the ~4,700 low to around 5,04x
Last week printed a bullish Hammer candle, confirming long-term buying interest
On the H12 timeframe, the A–B–C corrective structure is not yet complete
Short term: price is consolidating within a tightening range, waiting for a clear breakout
🔑 Key Price Levels
🟢 Support:
5,000 | 4,950 | 4,930 | 4,850 | 4,700 | 4,650
🔴 Resistance:
5,050 | 5,095 | 5,100 | 5,110 | 5,200 | 5,300
🎯 Primary Scenarios
✅ Bullish continuation
Price holds above 4,930 and breaks decisively above 5,050
→ Potential upside toward 5,095 – 5,100, and further to 5,200 – 5,300
❌ Failed breakout / Pullback
Price fails to clear 5,050 and closes below 4,930
→ Likely correction toward 4,850, with deeper pullback to 4,700 – 4,650
🧭 Trading Strategy
Prioritize buy-the-dip opportunities in line with the trend
Avoid counter-trend shorts unless clear reversal signals appear at resistance
Stay patient and avoid FOMO — only trade when risk–reward is clearly defined

SHREECEM 1 Day Time Frame 📊 Daily Pivot & Key Levels (Most Accurate Today)
🔹 Pivot (Daily): ₹27,290 — central bias level (above = bullish, below = bearish)
🟢 Resistance Levels (Upside Targets)
R1: ₹27,480 — 1st resistance
R2: ₹27,735 — 2nd resistance
R3: ₹27,925 — 3rd resistance
If price breaks above R2/R3 with volume, look for continuation toward higher zones in short term.
🔴 Support Levels (Downside Safety Zones)
S1: ₹27,035 — 1st support
S2: ₹26,845 — 2nd support
S3: ₹26,590 — 3rd support
A break below S2/S3 could signal stronger bearish movement for the day.
📈 How to Use These Levels (1-Day View)
✔ Bullish daily bias: Price holds above pivot (₹27,290) and breaks R1 → R2 cleanly.
✔ Bearish daily bias: Price trades below pivot and breaks S1 → S2/S3 with momentum.
✔ Range condition: Price choppy between S1 ↔ R1 signifies consolidation.
🧠 Technical Context
Price is near short-term SMA/EMA levels — this adds confluence to the pivot and S/R ranges mentioned.
RSI/stochastic indicators are currently not extremely overbought/oversold, suggesting ranges or breakout plays are likely.

ELECTCAST – Consolidation Range - LongDisclaimer: This analysis is for educational purposes only. I am not a SEBI-registered advisor. Please consult your financial advisor before making investment decisions.
ELECTCAST – Consolidation Range
🎯 Targets
Target 1: ₹110+
Target 2: ₹130+
Target 3: ₹164+
Target 4: ₹194+
Target 5: ₹236+
Target 6: ₹300+
⚖️ Risk-Reward
Entry: ₹97-98
Stop Loss: ₹85 (Closing Basis)
Risk–Reward Ratio ≈ 1:16+
📌 Summary:
1. What is Consolidation?
On a daily time frame, consolidation happens when the price moves sideways in a range without clear direction.
Candles have relatively small bodies.
Price respects a support (bottom) and resistance (top) level.
Traders often call this a “box,” “range,” or “accumulation/distribution phase.”
👉 Example: A stock trades between ₹100 and ₹110 for several days or weeks.
Why it happens:
Buyers and sellers are in balance.
Market is “waiting” for new information before choosing a direction.
2. What is a Breakout?
A breakout occurs when price moves strongly outside the consolidation range with higher-than-normal volume.
Upside breakout: Price closes above resistance → potential bullish trend.
Downside breakout: Price closes below support → potential bearish trend.
👉 Example: After consolidating between ₹100–₹110, the stock closes at ₹112 with strong volume → breakout to the upside.
3. How Traders Use It
Entry signals: Traders often enter after a confirmed breakout.
Stop-loss placement: Below resistance (for upside breakout) or above support (for downside breakout).
Targets: Often measured using the height of the consolidation range.

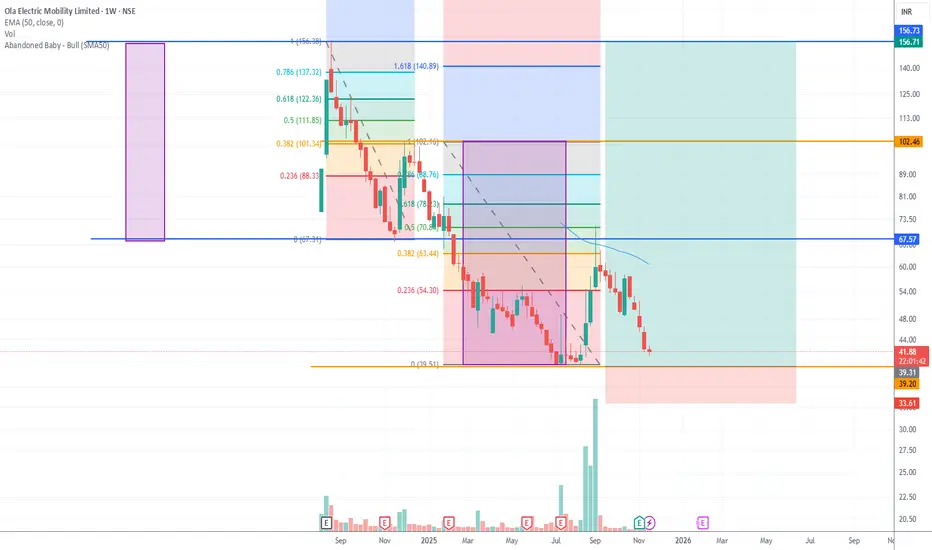
OLA ELEC – Weekly Analysis | Possible Double Bottom + Fibonacci Price Zone of Interest: ₹39–₹41
Stop-Loss (Weekly Close Basis): ₹34
Timeframe: Weekly
Bias: Potential Long Setup (High Risk, Technically Driven)
Entry / SL / Targets
🟢 Entry Zone (Accumulation Zone):
✔ ₹39–₹41
🔴 Stop-Loss (Strict Weekly Close):
✔ ₹34
Below this, the double-bottom pattern fails.
🎯 Potential Upside Targets:
T1: ₹54
T2: ₹63–64
T3: ₹70
T4: ₹78
Upside targets depend on weekly momentum and volume confirmation.
------------------------------
Key Technical Observations
1. Double Bottom Structure Forming
Price has returned to the strong demand zone around ₹39–₹41, which previously acted as a key swing low.
A double bottom is possible if the stock holds this level on a weekly closing basis.
A confirmed weekly reversal candle here increases the probability of a bounce.
------------------------------
Fibonacci Behavior (Weekly) – Pattern Repeating
When applying Fibonacci retracements on the previous weekly downswings:
1st Downtrend Retracement: Price reversed at the 0.382 level
2nd Downtrend Retracement: Price reversed at the 0.50 level
This shows that the stock has been respecting mid-Fibonacci retracements during corrective moves.
If a bounce starts from the same zone again, the next fib levels act as natural upside targets.
XAUUSD VIEW ZONES !!Gold rose above $5,010 per ounce on Monday, reaching its highest level in over a week, as investors awaited key US economic data that could offer clearer signals on the Federal Reserve’s interest rate outlook.
🔴 Supply / FVG Zone
5053 – 5063 - 1ST ZONE & 5082 5091
Major IOB area
Previous aggressive selling pressure
High probability liquidity reaction zone
📌 Expect:
Liquidity grab
Fake breakout possibility
Strong volatility if tapped
⚪ Demand Zone
4982 4975 & 4953 4937
Institutional reaction zone
Potential bullish mitigation area
Liquidity resting below
🟥 Major Support
5007 5012
Structure invalidation level
Break = bearish continuation scenario

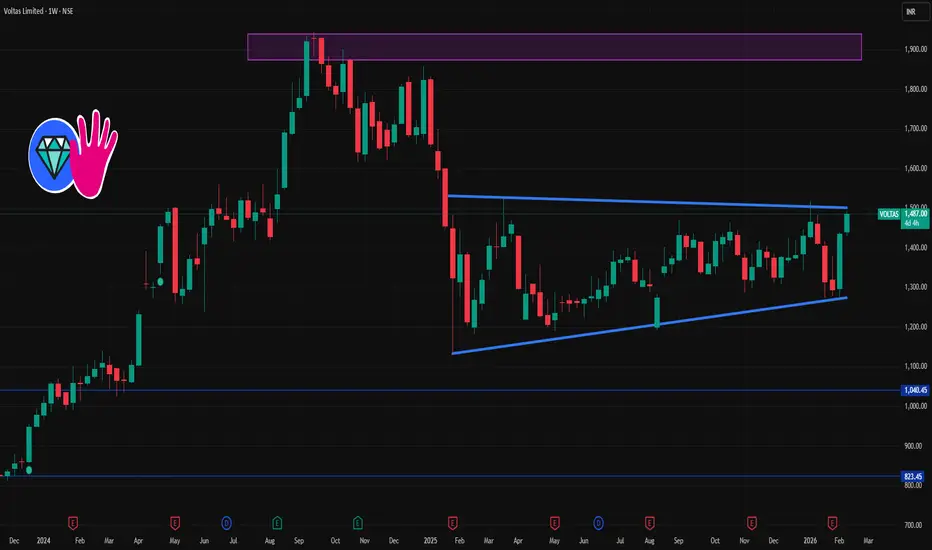
VOLTAS 1 Week Time Frame 💹 Current price range (approx): ₹1,430–₹1,485 (varies across platforms).
📊 Key Levels for Next Week
🔼 Upside / Resistance Levels
These are levels where price might face supply/selling pressure this week:
₹1,480–₹1,500 — near recent peaks and psychological zone
₹1,500–₹1,520 — secondary resistance (historical / pivot region)
🔽 Downside / Support Levels
Important zones where buyers might step in if price dips:
₹1,380–₹1,395 — near short-term support from pivots
₹1,350–₹1,370 — broader support zone where price has bounced recently
₹1,320–₹1,330 — deeper support if weakness continues
📌 Pivot Reference
Some pivot calculations for weekly help gauge trend direction:
Weekly Pivot ~₹1,381
R1 ~₹1,492 / R2 ~₹1,550 / S1 ~₹1,354 / S2 ~₹1,312 (depends on calculation method)
📉 What Technical Indicators Suggest
Short-term price action has shown strength in momentum indicators on intraday and daily (e.g., strong buy signals).
Some weekly indicators show mixed signals (momentum present but not overly strong).
Analyst screens show a variety of bias — some strong buy on short term, others neutral/weak on weekly.
🧠 Quick Strategy Notes (for traders)
Bullish break above ₹1,500 could open room toward ~₹1,520–₹1,550+ (short-term).
Sustained break below ₹1,380 may signal deeper pullback toward ~₹1,350–₹1,320.
Keep an eye on volume and candlestick signals around these key zones.
Part 1 Intraday Institutional Trading Strategies What Are Options? (Basic Definition)
Options are financial contracts that give the buyer the right (but not the obligation) to buy or sell an underlying asset (such as Nifty, Bank Nifty, stocks, commodities) at a pre-decided strike price, within a specific expiration time.
Two types of options:
1. Call Option (CE)
Gives the buyer the right to buy.
You buy a call when you expect the price to go up.
2. Put Option (PE)
Gives the buyer the right to sell.
You buy a put when you expect the price to go down.
But options are not just about direction. They involve time, volatility, market psychology, and risk management.

Basic about volume Basic about volume
we are try to understand basic things of volume
how we can predict the price level with volume

XAUUSD INTRA DAY VIEW!!Gold rose above $5,010 per ounce on Monday, reaching its highest level in over a week, as investors awaited key US economic data that could offer clearer signals on the Federal Reserve’s interest rate outlook.
🔴 Supply / FVG Zone
5053 – 5063 - 1ST ZONE & 5082 5091
Major IOB area
Previous aggressive selling pressure
High probability liquidity reaction zone
📌 Expect:
Liquidity grab
Fake breakout possibility
Strong volatility if tapped
⚪ Demand Zone
4982 4975 & 4953 4937
Institutional reaction zone
Potential bullish mitigation area
Liquidity resting below
🟥 Major Support
5007 5012
Structure invalidation level
Break = bearish continuation scenario

Patanjali - Swing | Avoid Option Trade 💡 Liked the idea?
Then don’t forget to Boost 🚀 it!
Comments are Most Welcome
LTP 524
add on dips
SL 498
Expected Tgt's 550-585-600
For more insights & trade ideas,
📲 Visit my profile and hit Follow
Warm regards,
Naresh G
SEBI Registered Research Analyst
💬 Comment below if you want me to analyse any stock for you 🔍

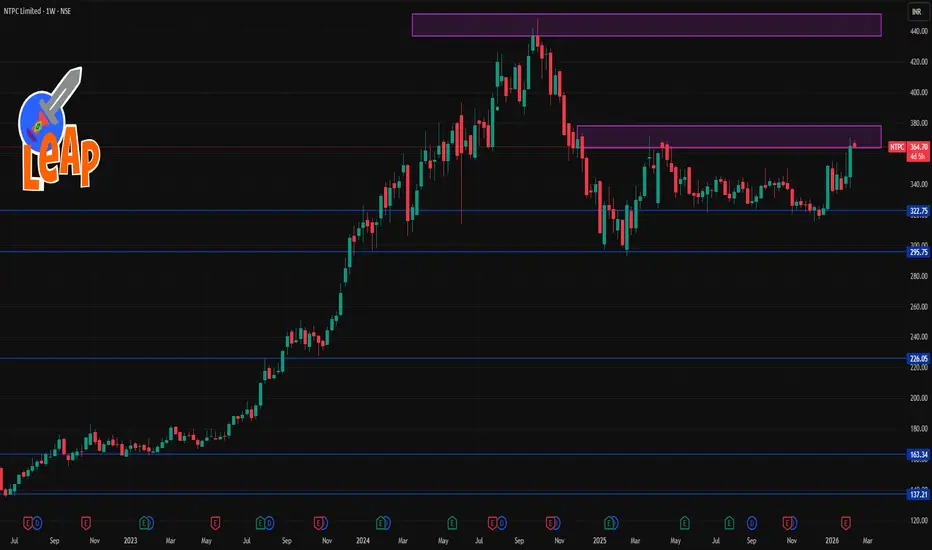
NTPC 1 Week Time Frame 📊 Current Approx Price Range
• Trading near ₹365–₹370 on the NSE this week.
📈 Weekly Resistance Levels (Upside)
• R1: ~₹378 – first reaction resistance this week
• R2: ~₹390 – secondary hurdle before fresh upside
• R3: ~₹410 – extended resistance if bulls dominate
• Fibonacci/Weekly Pivot R2–R3: ~₹390–₹411 area
📉 Weekly Support Levels (Downside)
• S1: ~₹345 – first major weekly support zone
• S2: ~₹325 – deeper support if S1 breaks
• S3: ~₹312 – last weekly structure support
• Weekly Pivot/Fib S1 area: ~₹324–₹345
📌 Weekly Pivot Approx Levels (from pivot calculations)
• Standard weekly pivots place pivot ~₹357–₹358, with support/resistance branching around it.
📊 Technical Signals (Weekly)
• Some platforms show a bullish/“strong buy” bias based on weekly indicators (moving averages & oscillators) — suggesting the trend is currently positive if the price holds above key supports.
Quick summary:
➡️ Bullish week if NTPC holds above ₹345 and breaks above ₹378–₹390.
➡️ Bearish pressure if weekly close slips below ₹345 → ₹325 → ₹312.
Oil India Ltd cmp 488 by Daily Chart viewOil India Ltd cmp 488 by Daily Chart view
- Support Zone 465 to 487 Price Band
- Resistance Zone 52 to 545 Price Band
- Support Zone tested retested for probable reversal
- Volumes spiking intermittently above average traded quantity
- Breakout from 1st Falling Resistance Trendline, 2nd Breakout anticipated
- Bullish Rounding Bottoms around Support Zone and by Resistance Zone neckline
