Elliott Wave Analysis & Technical Cross-VerificationsHello Friends, Welcome to RK_Chaarts,
Today, we're going to learn how to validate our Elliott Wave analysis by identifying additional factors that support our directional bias. Once we've plotted our Elliott Wave counts and identified a direction, we want to confirm whether other technical indicators and patterns align with our analysis. This helps strengthen our conviction in our directional bias and provides additional confidence in our trading decisions. Today, we'll explore some key points, including Elliott Wave theory, Exponential moving averages, Trend line breakouts, and Invalidation levels, as well as projected targets. And please note that this post is shared solely for educational purposes. It is not a trading idea, tip, or advisory. This is purely an Educational post.
Elliott Wave Theory structure & wave Counts
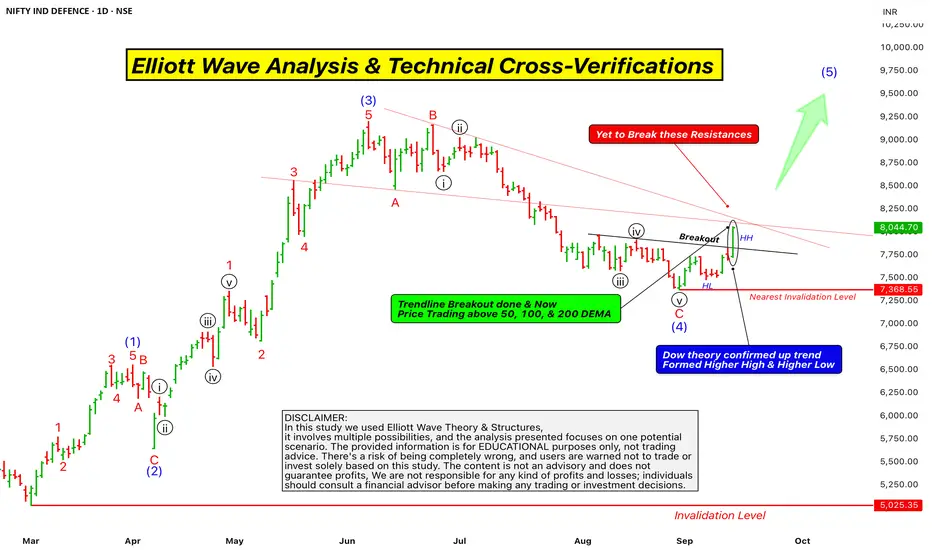
Here chart we are using Nifty India Defence sector, which is an index chart. We are analyzing it using Elliott Wave theory. It's very clear that from the March 2025 bottom, we've identified a clear Wave (1) Wave (2) Wave (3) and Wave (4) and now we've started Wave (5) of Intermediate degree in Blue.
Projections of wave (5)
According to the theory, the projected target for Wave (5) is typically between 123% to 161.8% of the length of Wave (4). So, we can at least assume that the price will reach 123% of Wave (4)’s length, and the price will move higher from here.
Trendline Breakout
The trend line breakout also confirms this. Since Wave (4) moved downwards, Wave (5) should move upwards, indicating a potential upward movement in price. This is a positive signal and a possibility.
Dow Theory confirmation of Trend changed
Additionally, we can see that in the daily time frame, the price has recently completed Wave (4) and formed a higher high, followed by a higher low, and then another higher high, along with a trend line breakout, which we've marked with a rounded ellipse on candle on the chart.
According to Dow theory, this formation of higher highs and higher lows, along with the trend line breakout, indicates that the index has the strength to break through resistance. These two factors strongly support our Elliott Wave projection, which suggests that the price will move upwards. The chart is looking bullish, indicating that a swing has been activated upwards from here.
Exponential Moving Averages
Furthermore, we can see that the price is trading above the 50-day exponential moving average (EMA) in the daily time frame, as well as above the 100-day EMA and the 200-day EMA. These three EMAs are major indicators, and the price is sustaining above all of them. This is also a very good positive sign that supports our view and this scenario.
Supporting Indicators
MACD
RSI
Some Hurdles to cross yet
Finally, we can see that the Zero B trend line, which is coming down from the top, has not been crossed by the price yet, and there has been no breakout. Additionally, we have drawn a trend line connecting the high of the third wave and the low of the fourth wave, which initially acted as resistance and later as support. This trend line is also approaching the same level as the Zero B trend line. So, we have two resistances converging at the same point, which the price has yet to break out of.
This could potentially be a hurdle, and it's possible that according to the Elliott Wave count, Wave (5) will arrive with five sub-divisions, which could lead to a retest of the previous trend line or a Retracement before moving further upwards.
Invalidation Level
According to Elliott Wave theory, the nearest invalidation level is the low of Wave (4), which is currently at 7368, and this level should not be breached. If it is, it will lead to a lower low, which would be an invalidation of the Elliott Wave count.
Overall, the chart of this index looks very promising and bullish. As we all know, the market can be unpredictable, but if this invalidation level is not triggered and the price doesn't break down, then the chart may move upwards with strength. This entire analysis that we discussed is for the Nifty India Defense index chart. Please note that this is not a trading tip or advice, but rather an educational perspective that we shared. Also, keep in mind that the Nifty Defense index is not tradable, but it does provide insight into the market's direction.
This post is shared purely for educational purpose & it’s Not a trading advice.
I am not Sebi registered analyst.
My studies are for educational purpose only.
Please Consult your financial advisor before trading or investing.
I am not responsible for any kinds of your profits and your losses.
Most investors treat trading as a hobby because they have a full-time job doing something else.
However, If you treat trading like a business, it will pay you like a business.
If you treat like a hobby, hobbies don't pay, they cost you...!
Hope this post is helpful to community
Thanks
RK💕
Disclaimer and Risk Warning.
The analysis and discussion provided on in.tradingview.com is intended for educational purposes only and should not be relied upon for trading decisions. RK_Chaarts is not an investment adviser and the information provided here should not be taken as professional investment advice. Before buying or selling any investments, securities, or precious metals, it is recommended that you conduct your own due diligence. RK_Chaarts does not share in your profits and will not take responsibility for any losses you may incur. So Please Consult your financial advisor before trading or investing.
Community ideas
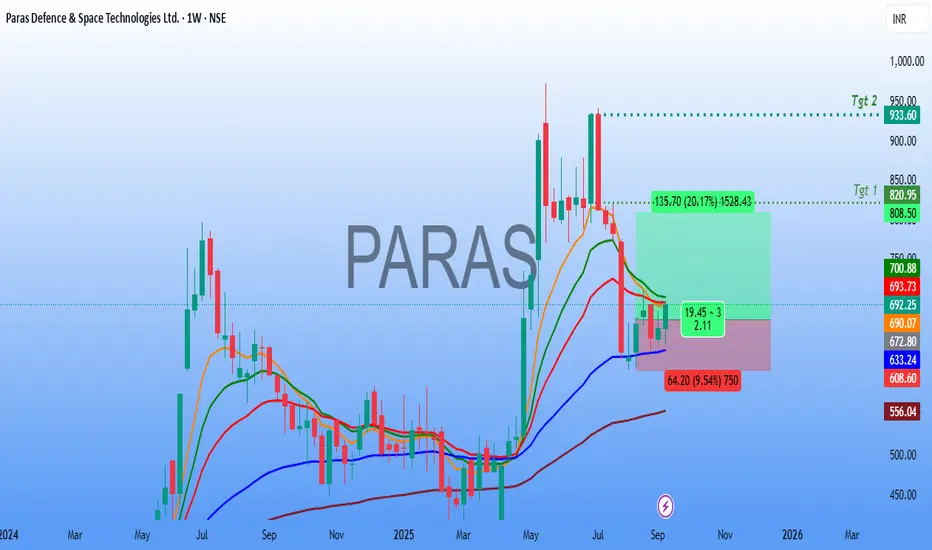
Paras Defence Technical Analysis🚀 Paras Defence & Space Technologies Ltd – Weekly Chart Analysis
The stock is showing signs of a potential reversal after consolidating near key support zones.
🔎 Technical Observations
Price Action:
After a prolonged decline from the highs, the stock has stabilized around the ₹640–660 support region. The recent weekly candle indicates buying interest, with bulls defending key support levels.
Sustained strength above the ₹700 zone can accelerate momentum towards higher levels.
Risk–Reward Setup:
The chart shows a favorable long setup with a potential upside of 20–35%.
📌 Trading Plan
Entry Zone: ₹680 – ₹700
Stop-Loss: ₹640 (weekly close basis)
Target 1: ₹820 – ₹825
Target 2: ₹930 – ₹950
⚠️ Key Notes
The ₹640–650 zone is acting as a strong support; holding this level is crucial for the bullish setup.
A breakout above ₹700 with volume confirmation will strengthen the momentum towards Target 1.
📢 Conclusion
Paras Defence is forming a bullish setup on the weekly timeframe with a good risk-to-reward ratio. If the stock sustains above ₹700, a strong move towards ₹820 and later ₹930+ looks possible. Traders should keep a strict stop-loss at ₹640 to protect capital.
Ethereum sell sign in 15 min as per indicator To identify potential short-selling opportunities in the stock market, technical indicators can signal a stock is overbought, losing momentum, or entering a downtrend. Short-selling is a high-risk strategy, and these indicators are most effective when used together to confirm signals.

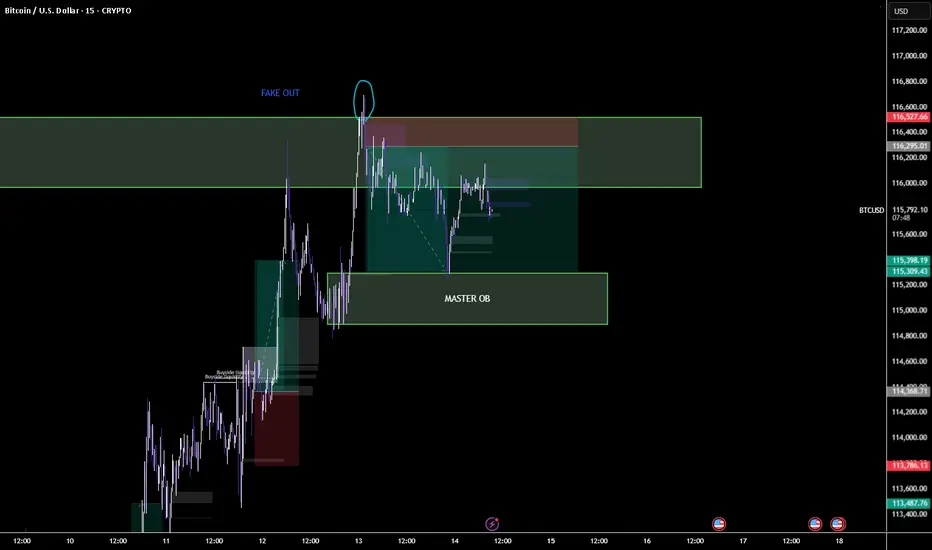
BTCUSD - Fakeout Trap & Master Order Block Setup
BTCUSD – Fakeout Trap & Master Order Block Setup
Price executed a clean **fakeout above liquidity** before dropping back into the **master order block zone**. This setup shows how liquidity hunts trap late buyers before respecting key OB demand. Watching for reaction from the **115.3k zone** to decide next directional move.
Part 2 Candle Stick PatternKey Terminologies in Option Trading
To understand options, you must master the vocabulary:
Strike Price → Pre-decided price where option can be exercised.
Premium → Price paid by the option buyer to the seller.
Expiry Date → Last day the option can be exercised.
In-the-Money (ITM) → Option already has intrinsic value.
At-the-Money (ATM) → Strike price is equal to current market price.
Out-of-the-Money (OTM) → Option has no intrinsic value.
Lot Size → Options are traded in lots, not single shares. For example, Nifty lot = 50 units.
How Option Pricing Works
Options are not priced arbitrarily. The premium has two parts:
Intrinsic Value (IV)
The real value if exercised now.
Example: Nifty at 20,200, call strike 20,100 → IV = 100 points.
Time Value (TV)
Extra value due to remaining time before expiry.
Longer expiry = higher premium because of greater uncertainty.
Option pricing is influenced by:
Spot price of underlying
Strike price
Time to expiry
Volatility
Interest rates
Dividends
The famous Black-Scholes Model and Binomial Model are widely used to calculate theoretical prices.
Greeks and Risk Management
Every option trader must understand Greeks, the risk measures that show sensitivity of option price to different factors:
Delta → Measures how much the option price changes if underlying moves 1 unit.
Gamma → Measures how delta itself changes with price movement.
Theta → Time decay; how much premium falls as expiry nears.
Vega → Sensitivity to volatility. Higher volatility increases premium.
Rho → Sensitivity to interest rates.
Greeks allow traders to hedge portfolios and adjust positions dynamically.
Strategies in Option Trading
Options shine because you can combine calls, puts, and different strikes to create unique strategies.
Directional Strategies
Buying Call → Bullish play.
Buying Put → Bearish play.
Covered Call → Own stock + sell call → generates income.
Protective Put → Own stock + buy put → insurance.
Neutral Market Strategies
Straddle → Buy call + put at same strike → profit from big moves either way.
Strangle → Buy OTM call + OTM put → cheaper version of straddle.
Iron Condor → Sell OTM call and put spreads → profit if market stays in range.
Advanced Plays
Butterfly spread, calendar spread, ratio spreads – for experienced traders.

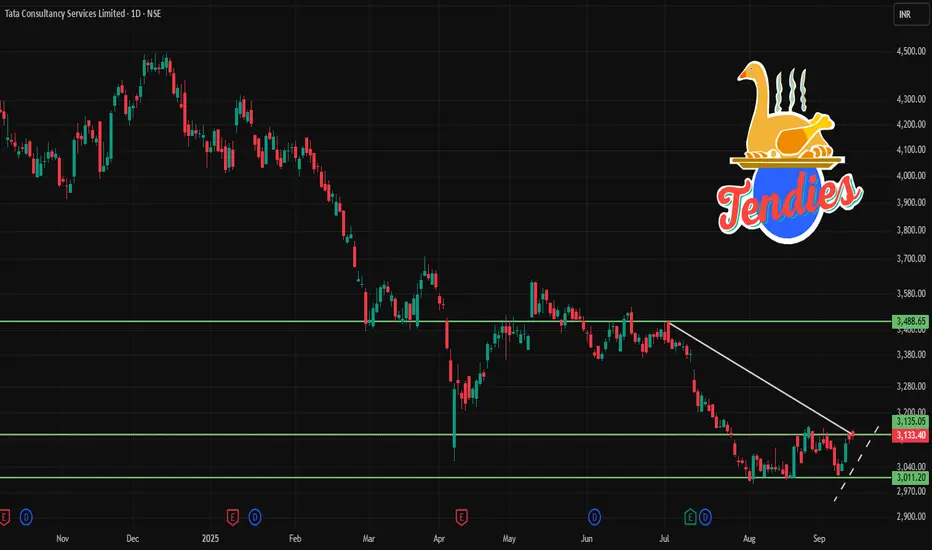
TCS 1D Time frame📉 Current Market Snapshot
Closing Price: ₹3,133.40
Day's Range: ₹3,121.00 – ₹3,148.70
52-Week High: ₹4,547.00
52-Week Low: ₹2,991.60
Market Cap: ₹11,21,000 crore
P/E Ratio (TTM): 22.8
Dividend Yield: 1.93%
Book Value: ₹262
ROE: 52.4%
Debt-to-Equity Ratio: 0.10
EPS (TTM): ₹136.19
Face Value: ₹1.00
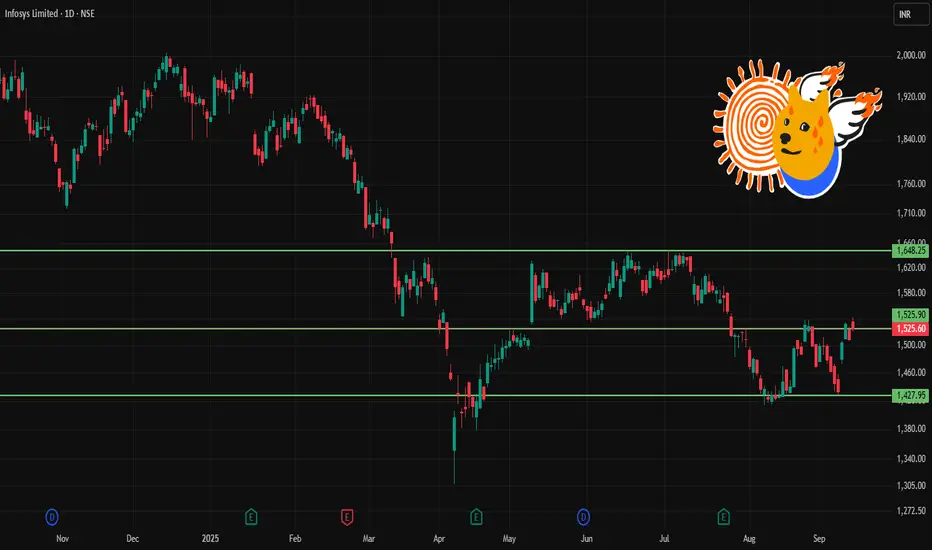
INFY 1D Time frame📉 Current Market Snapshot
Current Price: ₹1,525.60
Previous Close: ₹1,509.70
Day's Range: ₹1,521.10 – ₹1,542.90
52-Week High: ₹2,006.45
52-Week Low: ₹1,307.00
Market Cap: ₹6,33,794 crore
P/E Ratio: 23.0
Dividend Yield: 2.82%
ROE: 28.72%
Debt-to-Equity Ratio: 0.09
Beta: 1.11
EPS (TTM): ₹65.63
Face Value: ₹5.00
VWAP: ₹1,529.86
Volume: 12,856,963 shares
ATR (14): ₹5.72
MFI: 71.75
EMA vs SMA vs WMA: Which Moving Average Should You Use?🔎 Intro / Overview
Moving Averages remain one of the most trusted tools in technical analysis. They smooth price action, highlight the trend, and often act as dynamic support or resistance.
In this post, we compare the 20-period SMA, EMA, and WMA on BTCUSD 4H to show how each reacts differently to market moves.
___________________________________________________________
📔 Concept
SMA (Simple Moving Average): Every candle in the lookback is weighted equally → smooth but slower to react.
EMA (Exponential Moving Average): Recent candles carry more weight → reacts faster, hugs price closely.
WMA (Weighted Moving Average): Linear weighting → a balance between SMA’s stability and EMA’s sensitivity.
The difference lies in responsiveness. Faster averages react early but risk false signals, slower averages confirm trends but lag.
___________________________________________________________
📌 How to Use
1️⃣ Plot the 20-period SMA, EMA, and WMA together.
2️⃣ Watch how each responds during pullbacks, rallies, and consolidations.
3️⃣ Use EMA for quicker signals, SMA for smoother long-term view, and WMA if you prefer a middle ground.
4️⃣ Combine with price action or RSI to avoid relying on moving averages alone.
___________________________________________________________
🎯 Trading Plan
Intraday traders: EMA crossovers (e.g., 9 vs 21 EMA) for faster entries and exits.
Swing traders: SMA for identifying trend direction and major support/resistance.
Balanced traders: WMA for medium-term setups where stability and responsiveness matter equally.
Always align the moving average with your trading style and risk appetite.
___________________________________________________________
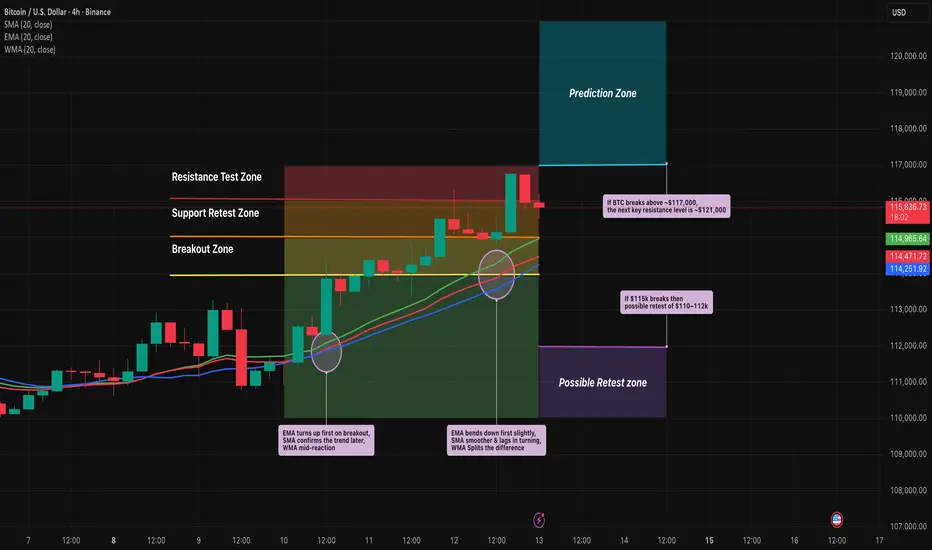
📊 Chart Explanation
On BTCUSD 4H:
EMA (red) bent upward first during the $114k breakout, SMA (blue) confirmed later, and WMA (green) sat between them.
At the $115k retest, EMA dipped first, while SMA lagged.
At $116.5–117k resistance, EMA whipsawed but SMA stayed smoother.
Notice how these differences become clear during sharp pullbacks, quick rallies, and sideways ranges.
___________________________________________________________
👀 Observation
EMA is quick but noisy ⚡, SMA is calm but late 🕰️, WMA strikes a middle ground ⚖️.
___________________________________________________________
❗ Why It Matters?
Choosing the right moving average impacts how quickly you spot entries, confirm trends, and manage stop-losses. Understanding the differences helps traders adapt strategies to both trending and sideways markets.
___________________________________________________________
🎯 Conclusion
No single moving average is “best.” Each serves a purpose depending on the timeframe and style of trading. The key is consistency — choose one that aligns with your plan, test it, and apply it with discipline.
👉 Which one do you prefer in your trading — EMA, SMA, or WMA?
___________________________________________________________
⚠️ Disclaimer
📘 For educational purposes only ·
🙅 Not SEBI registered ·
❌ Not a buy/sell recommendation ·
🧠 Purely a learning resource ·
📊 Not Financial Advice
Sensex - Weekly review Sep 15 to Sep 19Price is consolidating near the 82000 zone. Sustaining above this can make the price to give a strong bullish movement.
Buy above 82040 with the stop loss of 81920 for the targets 82120, 82240, 82360, 82440, 82580, 82700, 82840, and 82960.
Sell below 81700 with the stop loss of 81820 for the targets 81600, 81520, 81400, 81260, 81120, 81020, 81900, and 81740.
Always do your analysis before taking any trade.

Part 1 Trading Master ClassIntroduction to Options
Financial markets offer multiple instruments to trade: equities, futures, commodities, currencies, bonds, and derivatives. Among derivatives, options stand out as one of the most flexible and powerful tools available to traders and investors.
An option is not just a bet on direction. It’s a structured contract that can protect a portfolio, generate income, or speculate on volatility. Unlike buying stocks, where profits are straightforward (stock goes up, you gain; stock goes down, you lose), option trading allows for non-linear payoffs. This means you can design trades where:
You profit if the market goes up, down, or even stays flat.
You control large exposure with limited capital.
You cap your risk but keep unlimited potential reward.
Because of this flexibility, options have become an essential part of modern trading strategies across the world, from Wall Street hedge funds to Indian retail investors trading on NSE’s F&O segment.
What are Options? Basic Concepts
At its core, an option is a contract between two parties:
Buyer of the option → Pays a premium for rights.
Seller (writer) of the option → Receives the premium but takes on obligations.
Definition
An option is a financial derivative that gives the buyer the right, but not the obligation, to buy or sell an underlying asset at a predetermined price (called strike price) on or before a certain date (expiry date).
Underlying assets can be:
Stocks (Infosys, Reliance, Apple, Tesla)
Indices (Nifty, Bank Nifty, S&P 500)
Commodities (Gold, Crude oil)
Currencies (USD/INR, EUR/USD)

BUY TODAY SELL TOMORROW for 5%DON’T HAVE TIME TO MANAGE YOUR TRADES?
- Take BTST trades at 3:25 pm every day
- Try to exit by taking 4-7% profit of each trade
- SL can also be maintained as closing below the low of the breakout candle
Now, why do I prefer BTST over swing trades? The primary reason is that I have observed that 90% of the stocks give most of the movement in just 1-2 days and the rest of the time they either consolidate or fall
Resistance Breakout in BEML
BUY TODAY SELL TOMORROW for 5%

ADANIPOWER 1D Time frameCurrent Price & Trend
Price: ₹648.55
Trend: Bullish — trading near the upper end of its 52-week range (₹432 – ₹681.55).
Momentum: Indicators suggest a strong bullish outlook.
Bullish Scenario
Breakout Above ₹680: A sustained move above ₹680 could target ₹700 – ₹710 in the short term.

SBIN 1D Time frame📉 Current Market Snapshot
Closing Price: ₹823.55
Day's Range: ₹819.80 – ₹825.80
52-Week High: ₹875.45
52-Week Low: ₹680.00
Market Cap: ₹7,60,188 crore
P/E Ratio (TTM): 9.57
P/B Ratio: 1.47
Dividend Yield: 1.93%
EPS (TTM): ₹86.06
Book Value: ₹527.66
Face Value: ₹1.00
Volume: 5,078,018 shares
VWAP: ₹822.84

Private and Public Banks: Their Role in Trading1. Understanding Private and Public Banks
1.1 Public Banks
Definition: Banks owned or majorly controlled by governments.
Examples: State Bank of India (SBI), Bank of Baroda, Punjab National Bank, and international giants like China Development Bank or Germany’s KfW.
Role: Support trade finance, infrastructure, and developmental goals while also operating commercially.
Trust Factor: Often seen as safer due to government backing.
1.2 Private Banks
Definition: Banks owned by private individuals or institutions, focused on maximizing profits.
Examples: HDFC Bank, ICICI Bank, Axis Bank, JPMorgan Chase, Goldman Sachs, HSBC (though HSBC has mixed ownership).
Role: More aggressive in expanding into global markets, offering innovative trading products, and catering to high-net-worth individuals and corporates.
2. Banking as a Foundation for Trading
Both types of banks serve as pillars of the trading ecosystem. Their activities include:
Providing Liquidity: Banks buy and sell financial instruments, ensuring markets don’t dry up.
Market Making: Many large banks act as intermediaries in forex and derivatives trading.
Credit Access: Traders and corporations rely on bank credit to fund positions.
Clearing & Settlement: Banks ensure smooth processing of trades through clearinghouses.
Risk Management: Offering hedging tools, swaps, options, and forward contracts.
3. Role of Public Banks in Trading
Public banks play a dual role: stabilizing markets while also enabling participation in global trading.
3.1 Trade Finance
Provide letters of credit (LCs) and bank guarantees for exporters/importers.
Ensure trust in international trade transactions.
3.2 Forex Market Interventions
Act on behalf of central banks to stabilize currency markets.
Support importers by ensuring adequate foreign exchange availability.
3.3 Developmental Trading Role
Encourage financing of essential commodities (oil, wheat, fertilizers).
Maintain food and energy security through commodity trade funding.
3.4 Example: State Bank of India (SBI)
India’s largest public bank actively supports exporters through concessional finance.
Plays a key role in rupee-dollar trade settlement, enhancing India’s presence in global forex.
3.5 Strengths of Public Banks in Trading
Government backing ensures trust and credibility.
Ability to fund large-scale infrastructure trading projects.
Acts as a stabilizer during financial crises.
4. Role of Private Banks in Trading
Private banks are more aggressive and profit-oriented, often setting trends in trading innovations.
4.1 Active Participation in Global Markets
Private banks like JPMorgan, Goldman Sachs, Barclays are market leaders in forex, commodities, and equity trading.
Operate investment banking arms specializing in derivatives, structured products, and electronic trading platforms.
4.2 Wealth Management and Private Banking Services
Offer exclusive access to equity trading, hedge funds, and forex products for wealthy clients.
Provide advisory services to optimize portfolio exposure to global markets.
4.3 Technological Edge
Private banks are pioneers in algorithmic trading and high-frequency trading (HFT).
Platforms like HDFC Securities, ICICI Direct offer retail access to stock markets.
4.4 Example: Goldman Sachs
Dominates derivatives and commodities markets.
Provides structured financing deals for corporations to hedge against risks.
4.5 Strengths of Private Banks in Trading
Innovation-driven, offering sophisticated trading products.
Higher efficiency and faster adoption of fintech.
Wider global presence compared to many public banks.
5. Comparative Roles of Public vs Private Banks in Trading
Aspect Public Banks Private Banks
Ownership Government Private shareholders
Risk Appetite Conservative, stability-driven Aggressive, profit-driven
Innovation Moderate High (HFT, derivatives, fintech)
Global Trading Role Primarily support trade finance and forex Market leaders in derivatives, equities, commodities
Trust Factor Strong due to state backing Strong brand but vulnerable in crises
Client Base Mass market, corporates, governments High-net-worth individuals, institutions, corporates
6. Contribution to Different Types of Trading
6.1 Equity Trading
Public Banks: Generally less active in proprietary equity trading but support retail and institutional participation.
Private Banks: Major global equity traders, offering brokerage, research, and portfolio management.
6.2 Forex Trading
Public Banks: Assist central banks in intervention and stabilize exchange rates.
Private Banks: Global market makers, driving trillions of dollars in daily forex transactions.
6.3 Commodity Trading
Public Banks: Finance essential imports like crude oil and food grains.
Private Banks: Dominate speculative trading in oil, gold, and agricultural futures.
6.4 Derivatives & Structured Products
Public Banks: Use derivatives mainly for hedging national interests.
Private Banks: Innovate complex structured products, options, swaps, and exotic derivatives.
7. Challenges Faced by Public and Private Banks in Trading
7.1 Public Banks
Political interference in lending and trade financing.
Slower adoption of new technologies.
Higher burden of non-performing assets (NPAs).
7.2 Private Banks
Higher exposure to speculative risks.
Vulnerable to global financial shocks (e.g., Lehman Brothers collapse).
Criticism for prioritizing profit over public interest.
8. The Changing Landscape: Fintech and Digital Trading
Both public and private banks are facing disruption from fintechs:
Digital trading apps (Zerodha, Robinhood, Groww) are reducing dependency on banks for stock trading.
Still, banks remain indispensable for clearing, settlement, large-scale financing, and providing credibility.
Public banks are slowly catching up with digitization, while private banks continue to push boundaries with AI-driven trading systems.
Conclusion
The roles of public and private banks in trading are complementary rather than competitive. Public banks provide stability, credibility, and developmental support, while private banks bring innovation, speed, and global connectivity. Together, they form the backbone of the international trading ecosystem.
As trading becomes more globalized, technology-driven, and interconnected, both public and private banks will need to adapt rapidly. The future will likely see a hybrid financial system where state-backed security and private sector innovation coexist to shape the world of trading.

Option Trading Pros and Cons of Option Trading
Advantages
Limited risk (for buyers).
Leverage: control large positions with small capital.
Flexibility: profit in all market conditions.
Hedging tool.
Disadvantages
Complexity: requires deep understanding.
Option sellers face unlimited risk.
Time decay works against option buyers.
Requires good volatility forecasting.
Practical Examples of Option Trading
Example 1: Buying Call on Reliance
Reliance at ₹2,500. Buy 2600 CE for ₹50.
Expiry day: Reliance at ₹2,700.
Profit = (2700–2600) – 50 = ₹50 per share × lot size.
Example 2: Protective Put for Portfolio Hedge
You hold Nifty ETF at 20,000.
Buy 19,800 PE. If market crashes to 19,000, your put limits loss.
Psychology and Risk Control
Option trading is not just about math; it’s about discipline:
Avoid over-leveraging.
Always define stop-loss.
Respect time decay (theta).
Manage emotions – fear of missing out (FOMO) and greed are costly.

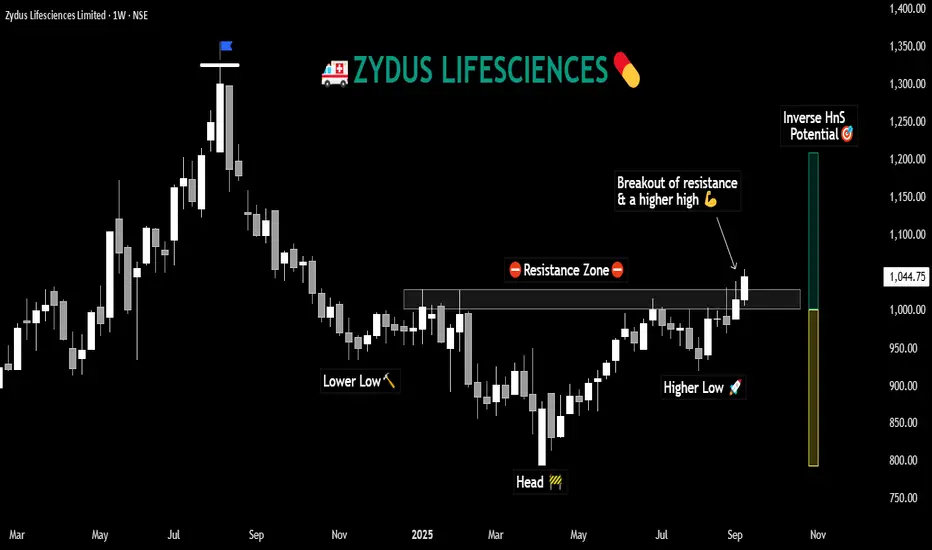
ZYDUS- Inverted Head and Shoulders PatternPattern Under Observation
⬜️ The Inverted Head and Shoulders (HnS) is one of those patterns that tells us that market might have done falling and is getting ready to rise again. An inverted HnS after a bearish run is the reciprocal of a HnS pattern at the top of a rally.
⬜️ The psychology behind the pattern is very simple: at first, sellers are in charge, but later each time they push the price down, buyers push it back up with more force towards a certain level. By the time the right shoulder forms, buyers are clearly stronger, and the breakout of resistance (neckline) confirms the shift.
⬜️This pattern works best after a clear downtrend, especially near a support area. But if you see it forming in a sideways, choppy market, you have to be careful as it might trick you with a false breakout.
⬜️ For targets we measure the distance from the lowest point of the pattern to the resistance zone (neckline) and then extend a 1:1 from resistance. This gives us a probable target zone which can be hit with momentum. As the stocks is coming out of resistance, some short covering and fresh buying leads to such expected move.
⬜️ Higher targets to previous highs can’t be rules out of course.
Stock Under Observation
Here are a few compelling observations indicating the end of a downtrend in the Zydus Lifesciences Limited
➞ The stock has formed Inverted HnS pattern after a yearlong bearish move.
➞ It has broken out of resistance zone after 9 months
➞ It is currently trading at the highest price since January 2025
➞ It has printed a higher low and higher high structure shift
➞ There are two consecutive weekly close above the psychological 1000 resistance zone
➞ A continuation can take it to potential targets or towards previous highs.
➞ Could be worth taking bearable limited risk.
Remember that this is not an investment advice. This is purely educational, and I personally don't have any position in this stock. Please apply your due diligence before taking decisions.
Keep boosting for more educational ideas in future.
All the best 👍

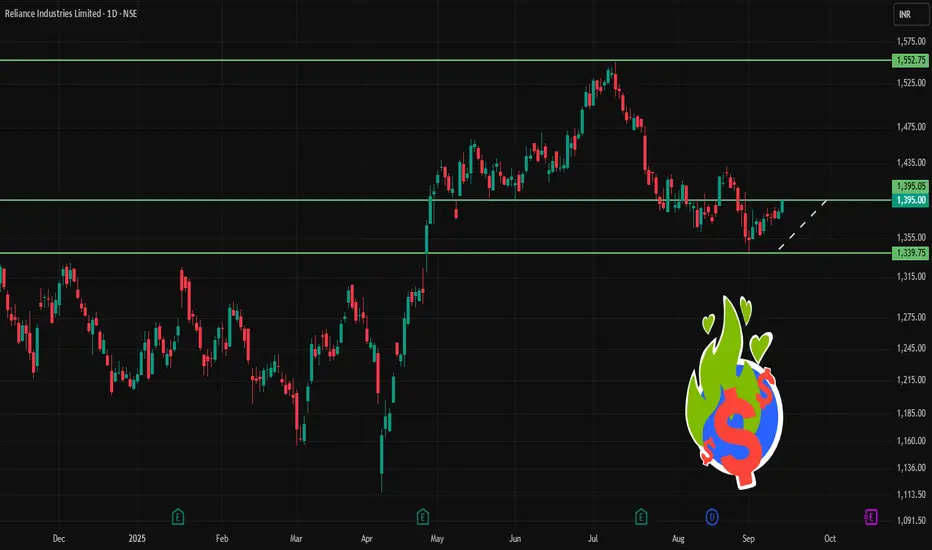
RELIANCE 1D Time frameClosing Price: ₹1,395.00
Day's Range: ₹1,380.50 – ₹1,396.30
52-Week High: ₹1,551.00
52-Week Low: ₹1,114.85
Market Cap: ₹18,87,780 crore
P/E Ratio (TTM): 25.30
Dividend Yield: 0.85%
Book Value: ₹1,100.00
EPS (TTM): ₹55.00
Face Value: ₹10.00
Volume: 7.4 million shares
VWAP: ₹1,388.40
Part 2 Support And ResistanceTypes of Options: Calls and Puts
There are only two fundamental types of options:
Call Option – Gives the right to buy the underlying asset at the strike price.
Example: Nifty is at 20,000. You buy a call option with a strike of 20,100. If Nifty rises to 20,400, you can buy at 20,100 and profit.
Put Option – Gives the right to sell the underlying asset at the strike price.
Example: Infosys is at ₹1,500. You buy a put option with a strike of ₹1,480. If Infosys falls to ₹1,400, you can sell at ₹1,480 and profit.
So, calls = bullish bets; puts = bearish bets.
Key Terminologies in Option Trading
To understand options, you must master the vocabulary:
Strike Price → Pre-decided price where option can be exercised.
Premium → Price paid by the option buyer to the seller.
Expiry Date → Last day the option can be exercised.
In-the-Money (ITM) → Option already has intrinsic value.
At-the-Money (ATM) → Strike price is equal to current market price.
Out-of-the-Money (OTM) → Option has no intrinsic value.
Lot Size → Options are traded in lots, not single shares. For example, Nifty lot = 50 units.
How Option Pricing Works
Options are not priced arbitrarily. The premium has two parts:
Intrinsic Value (IV)
The real value if exercised now.
Example: Nifty at 20,200, call strike 20,100 → IV = 100 points.
Time Value (TV)
Extra value due to remaining time before expiry.
Longer expiry = higher premium because of greater uncertainty.
Option pricing is influenced by:
Spot price of underlying
Strike price
Time to expiry
Volatility
Interest rates
Dividends
The famous Black-Scholes Model and Binomial Model are widely used to calculate theoretical prices.

HDFCBANK 1D Time frame📉 Current Market Snapshot
Closing Price: ₹967.80
Day's Range: ₹962.25 – ₹970.75
52-Week High: ₹1,018.85
52-Week Low: ₹806.50
Market Cap: ₹14,85,200 crore
P/E Ratio (TTM): 21.44
P/B Ratio: 3.38
Dividend Yield: 1.13%
EPS (TTM): ₹45.97
Book Value: ₹339.84
Face Value: ₹1.00
Volume: 14,363,519 shares
VWAP: ₹966.64

Divergence SecretsGreeks and Risk Management
Every option trader must understand Greeks, the risk measures that show sensitivity of option price to different factors:
Delta → Measures how much the option price changes if underlying moves 1 unit.
Gamma → Measures how delta itself changes with price movement.
Theta → Time decay; how much premium falls as expiry nears.
Vega → Sensitivity to volatility. Higher volatility increases premium.
Rho → Sensitivity to interest rates.
Greeks allow traders to hedge portfolios and adjust positions dynamically.
Strategies in Option Trading
Options shine because you can combine calls, puts, and different strikes to create unique strategies.
Directional Strategies
Buying Call → Bullish play.
Buying Put → Bearish play.
Covered Call → Own stock + sell call → generates income.
Protective Put → Own stock + buy put → insurance.
Neutral Market Strategies
Straddle → Buy call + put at same strike → profit from big moves either way.
Strangle → Buy OTM call + OTM put → cheaper version of straddle.
Iron Condor → Sell OTM call and put spreads → profit if market stays in range.
Advanced Plays
Butterfly spread, calendar spread, ratio spreads – for experienced traders.
Options vs. Futures and Stocks
Stocks → Simple ownership. Risk = unlimited downside, reward = unlimited upside.
Futures → Obligation to buy/sell at future price. High leverage, unlimited risk.
Options → Rights, not obligations. Limited risk (for buyer), flexible payoffs.

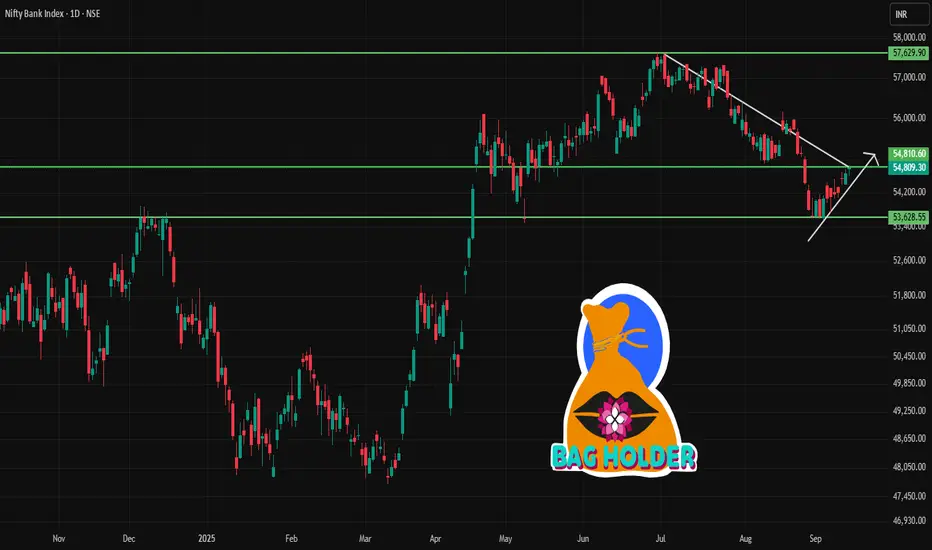
BANKNIFTY 1D Time frame📉 Current Market Snapshot
Closing Price: ₹54,809.30
Day's Range: ₹54,580.35 – ₹54,852.25
52-Week Range: ₹47,702.90 – ₹57,628.40
Market Cap: ₹45,50,788 crore
P/E Ratio: 14.9
Dividend Yield: 1.09%
Price-to-Book Ratio: 2.03
1-Year Return: +5.87%
5-Year Return: +147.36%
10-Year Return: +12.5%
Nifty on Resistance 13/09/25Today Nifty on Resistance level 25175 . This resistance level is very strong . Last 2 month nifty range bond movement only 3% . Nifty 70% chance to return down side if gap up open then possible to breakout otherwise return to down side.
