Nifty - Weekly review Feb 9 to Feb 13According to the daily chart, the price is near the trend direction deciding zone 25690 - 25720. The lower time frame chart shows that the price is getting ready to move up.
Buy above 25740 with the stop loss of 25680 for the targets 25780, 25820, 25860, 25920, 25980, 26040, 26120 and 26200.
Sell below 25600 with the stop loss of 25660 for the targets 25560, 25520, 25460, 25400 and 25320.
Always do your analysis before taking any trade.
Parallel Channel

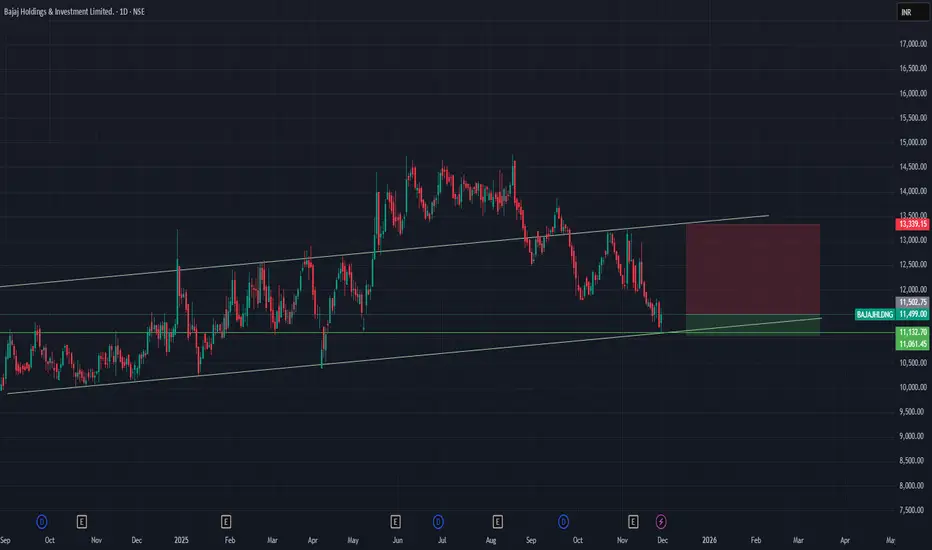
Bajaj Holding INvesting ready for 15% upsideBajaj Holding is ready for 15% upside. with small stop loss.
- RSI is 41
- On Support line
Please consult your financial advisor before investing.
Powergrid inside Perfect Descending Parallel Channel PatternPowergrid seen travelling perfectly inside the descending channel pattern, taking perfect resistance and support at the channel (from April 2025 till now)
Now seen at the perfect crucial point where it can either move bullish or bearish in the upcoming days
Bearish view gets cancelled on getting past the red dotted line...till that we can't be bullish on Powergrid!!!
Just add to the watchlist and let's watch how its going to move!!!!
will update once the decider move occurs!!!!
Just Sharing my view ...not a tip nor Advice!!!
Thank you!!!

Nifty - Budget Day Analysis...During budget day, the price can give a volatile and big move. This volatility is risky to trade. People who like the thrilling effect trade on such days without any plan or analysis.
Usually, during volatile time what emotions make a trader do impulsive trading?
Fear of missing out, greed trading, confirmation bias and revenge trading.
Premium will be high during opening and decay fast during the budget time.
Important support levels are 24900 and 25000. If broken, the next support is around 24500.
Important resistance levels are 25300 and 25600. If broken, the next resistance is at 25900.
Always do your analysis before taking any trade.

Gold at Make-or-Break Zone | Channel Support Under TestGold is currently trading inside a rising channel and has pulled back toward the lower side of the structure. This move looks more like a healthy correction rather than a breakdown, as long as price continues to hold the marked support area.
If buyers step in near channel support, upside continuation remains possible toward the higher zone. A clear break below support, however, would weaken the structure and shift the bias to the downside. For now, this is a wait-and-react zone, not a chase.
⚠️ Disclaimer
This analysis is for educational purposes only and should not be considered financial advice. Trading involves risk. Please do your own research and use proper risk management.

Reliance - Multi time frame analysisThe price is trending inside a descending channel in the lower time frame and is now testing the important zone at 1400. As per the daily chart, the price has taken support from 1370. Another support is also there at 1340. If the price does not gain bullish strength, there is a chance to test 1340.
Buy above 1404 with the stop loss of 1392 for the targets 1416, 1428, 1440 and 1454.
Sell below 1380 with the stop loss if 1392 for the targets 1368, 1354, 1340 and 1322.
Always do your analysis before taking any trade.

NIFTY: Textbook Double Top with a Possible Crash of 7000 pt?Technical Analysis
• Previous All-Time High:
Nifty formed its earlier ATH around the 26,300 zone near the end of September 2024.
• Second Phase of Bull Rally:
The next leg of the rally began in early April 2025, with Nifty once again moving up to the 26,300 resistance, but failing to break above it.
• Repeated Rejection at Resistance:
Multiple attempts to decisively cross the 26,300 zone were observed between December 2025 and early January, all of which failed — reinforcing this level as a strong supply zone.
• Distribution Phase:
A textbook distribution pattern appears to be forming, indicating potential exit of smart money.
o FII selling: Approximately ₹80,000 crore sold since December 2025.
Macro Headwinds
• Ongoing geopolitical uncertainty
• Safe-haven rally in Gold & Silver, driven by sustained central bank buying
________________________________________
Trade Setup
Entry Trigger
• Breakdown below the upward trending channel around 24,900
• Daily candle close below this level for confirmation
________________________________________
Trade Structures
• Put Ratio Back Spread
o Limited risk
o Unlimited reward potential
• Long-term Bear Put Spread
o High risk–reward profile
o Target RR of at least 1:10
Risk Factors
• Indian Union Budget on 1st February
→ Avoid aggressive short-term option selling or directional trades around the event
Educational purpose only. Happy chart reading!!!

A New World without the US Dollar at the helm?Civilizations halt.
Empires fall.
New worlds and new world orders are built on the ruins of older greats.
Is this the slow decline of the largest empire known to mankind?
Whatever happens, I wish it happens over the next 50 years so I can be here to witness the shift in awe.
Technically speaking, US Dollar has been in a long term uptrend channel since 2008 and this channel is now seriously being tested and is at a risk of being violated. What is interesting is this isn't just a technical move, this is a move backed by a fundamental shift in Global order.
How will the world look like if US is not at the helm? Only time will tell.
see you later—ciao!

Leading Diagonal to Double Zigzag – Jio Financial’s Full CycleFrom the lows of ₹198.65 , the stock kicked off with a classic leading diagonal — an overlapping structure, exactly how impulsive moves often begin when sentiment is still uncertain. This marked the start of a larger impulsive advance.
Post the Wave 2 low at ₹203.10 , price surged into a powerful Wave 3 rally toward ₹338.30 . Momentum confirmed the strength of this move, with RSI overshooting well into the overbought zone , validating the impulsive nature of the advance.
The rally ended with Wave 5 topping marginally above Wave 3 , but momentum failed to confirm the new high. A clear bearish RSI divergence signaled exhaustion near the top.
Since then, price has transitioned into a W–X–Y double zigzag correction , unfolding neatly within a well-aligned descending channel . Typically, such structures resolve with an upside breakout, but markets don’t always follow the textbook.
Instead, price has broken below the channel and is now sitting exactly at the 0.618 Fibonacci retracement of the entire impulse near ₹252 .
From a momentum perspective, RSI is deeply stretched and hints at a possible relief bounce . If that bounce materializes, it is likely to be corrective in nature — potentially a retest of the broken channel — before one final leg lower.
The ideal structural path would be:
A short-term bounce to cool off RSI
Followed by a final Wave (v) decline below ₹252.25
Ideally accompanied by bullish RSI divergence or a clear bullish reversal candlestick
Such a move would complete Wave (c) of Y , thereby finishing the broader W–X–Y corrective structure . The correction is expected to terminate near the major pivot support zone between ₹236 and ₹228 , just above the 0.786 Fibonacci retracement .
For now, this remains a wait-and-watch setup .
Patience is key rather than bottom fishing . Let price action confirm strength — meaningful reversals usually come with clear signals, not guesses.
Disclaimer:
This analysis is for educational purposes only and does not constitute investment advice. Please do your own research (DYOR) before making any trading decisions.

Bajaj Finance: Impulse Complete, Correction in ControlBajaj Finance completed a clean five-wave impulsive advance , topping out near ₹1,102.5 , followed by a clear loss of momentum. Since that peak, price action has shifted from trend to overlap , signaling a corrective phase rather than continuation.
Structurally, the decline is unfolding within a descending channel , fitting well with a W–X–Y corrective structure . The internal swings remain choppy and overlapping — classic correction behavior — with price respecting the channel boundaries so far.
During the impulsive rally ( Waves 1–5 ), the 50 DMA acted as dynamic support , confirming strong upside momentum. Post the top, price has slipped below the 50 DMA and is now oscillating around it, indicating momentum fatigue . A sustained hold below the 50 DMA, combined with a rollover in the average , would reinforce the short-term bearish / corrective bias , with the average potentially flipping into dynamic resistance .
From a price projection perspective, the ongoing Wave Y is favoring a move toward key Fibonacci retracement levels . The 0.618 retracement near ₹945 stands out as a high-probability reaction zone , while a deeper flush could extend toward the 0.786 retracement near ₹903 if downside pressure accelerates.
Risk is clearly defined. A sustained break above the upper boundary of the corrective channel would invalidate the W–X–Y interpretation and signal a structural shift back toward strength . Until then, the path of least resistance remains corrective .
Bottom line:
The impulsive phase is done. The market is digesting gains. Structure — not emotion — favors patience and respect for the corrective channel.
Disclaimer:
This analysis is for educational purposes only and does not constitute investment advice. Please do your own research (DYOR) before making any trading decisions.

SMALL CAP INDEXHello & welcome to this analysis
The index appears to be ending a wedge pattern near an Ichimoku cloud resistance with future Kumo bearish. It also has a slanting channel upper trendline resistance approaching.
The wedge would be considered broken below 17775, downside levels where it could then retrace to would be the Ichimoku Base line near 17400 and if that fails to hold it could further retrace till 16600 where it would form a Bullish Harmonic Gartley.
The PRZ of the Gartley coincides with a gap up area and the slanting channel lower trendline.
This bearish view would be invalid above 18150
All the best

Nifty - What happens next?The price has broken the 25500 zone and the lower trend line of the channel. Now the important support levels as per the daily chart are 25020, 24900, 24600 and 24500. The price has to bounce from the 24600 or 24500 zone.
In the smaller time frame, the price is testing the lower trend line, and I expect 25400 to act as resistance if the price has a pullback.
25000 is a psychological level, and the price will be volatile at that level.
As of now bank Nifty and Metal index have not fallen much and had a small pullback. But if these indices show more bearishness, then the fall will be fast.
Always do your analysis before taking any trade.

Nifty - Expiry day analysis Jan 20The price rejected the 25600 zone in the opening and fall towards 25500. In the afternoon session, it tested 25600 again. This movement has created a descending channel. The channel has zig zag movement, so trade carefully.
Buy above 25680 with the stop loss of 25620 for the targets 25720, 25760, 25820 and 25860.
Sell below 25580 with the stop loss of 25630 for the targets 25540, 25500, 25460 and 25400.
Expected expiry day range is 25400 to 25800.
Always do your analysis before taking any trade,

Equitas Small Finance Bank – Swing Trade ViewPrice has broken out of a long-term falling channel, signaling a trend shift from bearish to bullish.
Post-breakout structure shows higher highs and higher lows, confirming strength.
Price has broken out of a long-term falling channel, signaling a trend shift from bearish to bullish.
Buy Zone :
₹66–₹67 on pullback to former resistance turned support
Or on daily close above ₹70 for continuation
Stop-Loss:
Below ₹65 (structure-based)
Targets:
T1: ₹73–₹75
T2: ₹78–₹80

Gold Hits Resistance Inside Rising Channel | Short-Term PullbackHello Everyone, i hope u all will be doing good in your life and your trading as well, let;s analyise Gold as it is trading inside a rising channel, but price is currently facing strong resistance near the channel top. The recent move shows signs of rejection, which opens the door for a short-term pullback, not a trend reversal.
This is a counter-trend short focused only on a corrective move. As long as price stays below the marked resistance zone, selling pressure can continue toward lower channel support. Buyers are still in control on higher timeframes, so shorts should remain quick and disciplined.
Key Levels
Short Zone: Near channel resistance
Pullback Targets: 4625 → 4610 → 4597
Invalidation: Above 4660
Disclaimer This analysis is for educational purposes only and should not be considered as financial advice. Trading involves risk. Please do your own research and use proper risk management before taking any trade.
Analysis By @TraderRahulPal | More analysis & educational content on my profile.
If this update helped, like and follow for regular updates.

XAUUSD | 15M | Channel Resistance Rejection – Short SetupGold price is trading inside a well-defined ascending channel. Price has now reached the upper channel resistance, aligning with a previous intraday high / supply zone, where selling pressure is visible.
A rejection from this area suggests a potential short-term bearish move, with price likely to rotate back toward the mid / lower channel support.
Technical Structure
Overall structure: Ascending channel
Entry zone: Upper channel resistance
Confirmation: Rejection wicks + loss of momentum
Bias: Short / Pullback trade
Trade Idea
Sell near resistance after confirmation
Stop-loss above channel high
Targets toward channel support / demand area
This setup is based purely on price action and market structure.
Wait for proper confirmation before entering.
⚠️ Not financial advice. Manage risk accordingly.

Sensex - Weekly expiry Jan 14The price was falling steadily in a descending channel, and now it is trying to move up by forming an ascending channel.
83500 is an important zone to decide the trend direction when it has a confluence with the channel trend line.
Buy above 83600 with the stop loss of 83480 for the targets 83720, 83860, 83980, 84100 and 83220.
Sell below 83300 with the stop loss of 83460 for the targets 83180, 83060, 82940, 82800 and 82640.
The expected expiry day range is 82900 to 83900.
Always do your analysis before taking any trade.

Siemens Down to Support zone??!!Siemens has been travelling inside a Ascending Expanding Channel Pattern(bold yellow line) from March 2025( making higher highs and higher lows )
Now it is in the down move to making a higher low (to support level)
This down move is being done by market in the form of Descending channel pattern making lower highs and lower lows(shown as purple line)
There is also a Head & Shoulders pattern ...which has given BREAKDOWN with Good Volume support (yesterday-13-10-2025)
Siemens is looking to take support at 2900 levels(2920)
SL can be bit choppy (either the high of Breakdown candle/high of right shoulder)
Bearish view can be negated once the red dotted line breaks!!!
Let's wait and watch!!!
Thank you!!!!
Just my view...not a tip nor advice!!!!

Sensex - Weekly review Jan 12 to Jan 16The price was falling steadily within a descending channel. The price has to break and sustain above it to move up.
Buy above 83560 with the stop loss of 83440 for the targets 83680, 83800, 83960, 84100, 84260, 84420, 84560 and 83700.
Sell below 83300 with the stop loss of 83440 for the targets 83180, 83040, 82900, 82740, 82600 and 82480.
Always do your analysis before taking any trade.

Sensex - Weekly expiry day analysis Jan 8The price moved in a descending channel, and today the price consolidated in a narrow range. This movement gave the move above the channel. This can give a pullback or upward move.
The patterns seen in the chart are 1. Rounding bottom 2. Descending channel
Buy above 84900 with the stop loss of 84780 for the targets 85020, 85180, 85300, 85460 and 85600.
Sell below 84640 with the stop loss of 84780 for the targets 84520, 84400, 84260, 84140 and 84040.
Always do your analysis before taking any trade.

HAL - Trading Within Descending Channel💹 Hindustan Aeronautics Ltd (NSE: HAL)
Sector: Defence | CMP: 4526
View: Corrective Bias within Descending Channel | Early Mean-Reversion Attempt
HAL continues to trade within a well-defined descending channel on the daily timeframe, with price respecting both the falling supply line and the lower demand boundary over multiple months, confirming a controlled corrective structure rather than trend breakdown. The recent test of the lower channel base near the 4200 zone has resulted in a reactionary rebound, forming a higher low on the immediate swing and indicating demand absorption at the channel bottom. The ongoing move reflects a mean-reversion attempt toward the channel midpoint, with price currently stabilising around the 4520–4550 region. Volume behaviour remains contained, suggesting structural repair rather than an aggressive trend reversal, and any meaningful shift from corrective to recovery would require sustained acceptance above the channel midpoint.
From a support–resistance perspective, HAL remains below multiple overhead supply zones. Immediate resistance is observed near 4575, followed by 4623 and 4702, with the 4900–5000 zone acting as a major institutional supply area. On the downside, 4448 acts as the nearest short-term support, followed by 4369 and 4321, while the 4200–4250 zone remains the key daily accumulation band; a breakdown below this region would materially weaken the structure. Overall, price remains range-bound between reactive support and strong overhead supply, keeping the environment patience-driven.
Momentum conditions are improving but still developing. The latest price action shows a decisive bullish candle alongside a favourable EMA structure shift, while volatility has begun to expand following prior compression. RSI remains in a healthy zone, trend strength is moderate, and the move is supported by above-average volume, indicating genuine participation rather than a low-quality bounce. Relative performance versus the benchmark remains positive, suggesting underlying leadership despite the corrective phase.
From an STWP analytical framework, the level around 4544.90 is tracked purely as a reference derived from recent momentum expansion, while the 4340–4380 zone continues to act as the primary risk reference supporting the structure. On the upside, 4790–4950 aligns with prior supply reactions, with higher swing reference zones visible beyond 5130. Internally, sentiment remains constructive with an upward bias, strong but developing momentum, elevated participation, and higher risk due to proximity to reaction zones, reinforcing the need for structure-led observation over prediction.
Derivatives data reflects a disciplined bullish bias, with call-side participation dominating near the ATM region and put positioning remaining defensive. Price–OI alignment, healthy liquidity, and moderate-to-low implied volatility favour controlled directional exposure, though continuation remains conditional on follow-through, given sensitivity to time decay near key levels.
From a demand–supply lens, the 4429–4342.60 zone stands out as the key daily demand area preserving structural stability, while 4788–4857 remains the primary daily supply zone. Intraday demand is layered at 4426–4410.50 (strong), followed by 4393–4385, and 4367–4342.60 (strong). Intraday supply emerges at 4548–4584, with higher resistance near 4585–4601.90. Any healthy pullback would ideally retrace into these demand zones with price stability and contraction; sustained acceptance below the daily demand zone would signal structural weakness.
Final Outlook:
Momentum: Strong (Developing) | Trend: Upward Bias | Risk: High | Volume: High

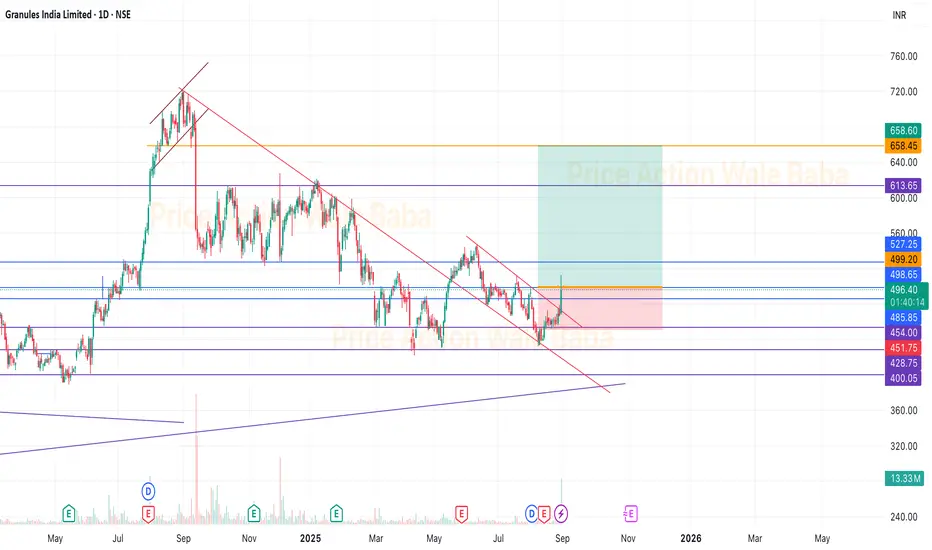
Granules - BreakoutGranules has give good breakout with volume and proper consolidation.
Above 520, we can see proper rally in the stock and good to hold for the long term.
Keep buying on every dip and wait for the next 3-6 months for the good returns.
LTIMThis analysis is for educational purposes only. LTIMindtree (LTIM) stock trades within a defined channel, recently finding support at the lower boundary and reversing upward, now positioned above key moving averages including the 50-150-200. It also holds above the channel's support level, signaling a bullish trend with potential for further upside; always use a stop-loss to mitigate risk
