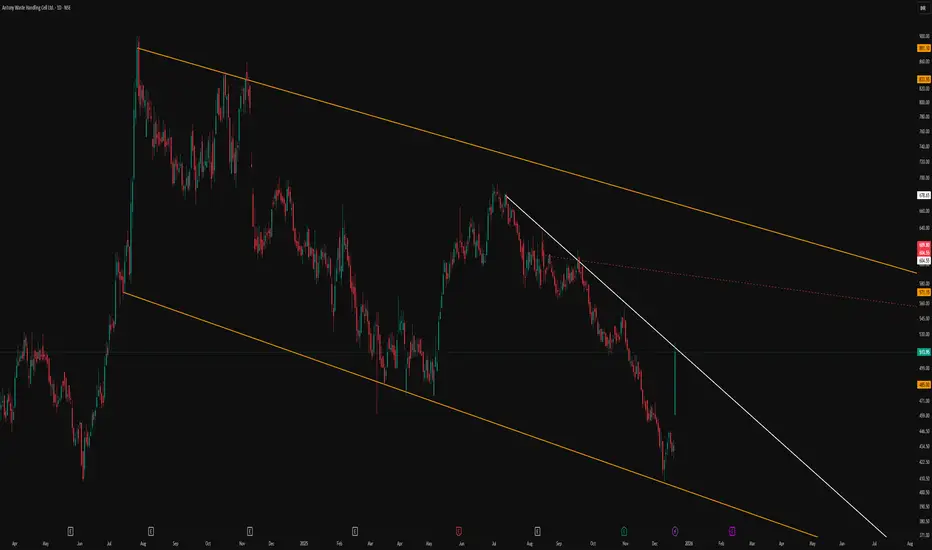
Classic Descending Channel With Clear Structural LevelsThe primary feature of this chart is the broad descending parallel channel marked by the orange lines, which frames the entire corrective phase in a neat, orderly manner. Price has repeatedly respected both the upper and lower boundaries, reinforcing the relevance of this channel as a dominant structure.
A trend‑changing resistance line is drawn in white, connecting swing highs and visually separating the prevailing downtrend from any potential shift in behavior. This line serves as a clear reference for how price has reacted to supply zones within the channel, without implying any future breakout or directional bias.
The red dotted line acts as an internal, hidden line derived from prior price interaction, helping to map out the internal rhythm of the move. Overall, the chart is intended purely as a structural illustration of how price respects channels and internal reference lines, without any forecast or trade signal.
Parallel Channel
Sensex - Weekly review Dec 15 - Dec 19Friday's movement was choppy, and the price is now testing the intermediate resistance at the 85300 zone. Next resistance is at the 85500 zone.
Buy above 85320 with the stop loss of 85180 for the targets 85460, 85580, 85740, 85900, 86060, 86220, 86400 and 86560.
Sell below 84960 with the stop loss of 85100 for the targets 84840, 84700, 84540, 84400, 84240, 84080 and 83900.
As per the daily chart, the price is testing the trend line, and it has to break and sustain above it.
Always do your analysis before taking any trade.

Double Zigzag Setup: Bulls Step Up, Retest Will DecideFeature, Detail
Pattern : Double Zigzag (W-X-Y) continuation structure
Bias : Bullish — Wave X looks complete with fresh buying pressure
Trigger : Breakout and successful retest of the channel (₹278–₹280 zone)
Current Signal : Strong expansion candle supported by a notable volume spike
Target : ₹292.15 (Wave Y ≈ Wave W)
Invalidation (SL) : Close below ₹276.55
Disclaimer: Edu Only, DYOR.

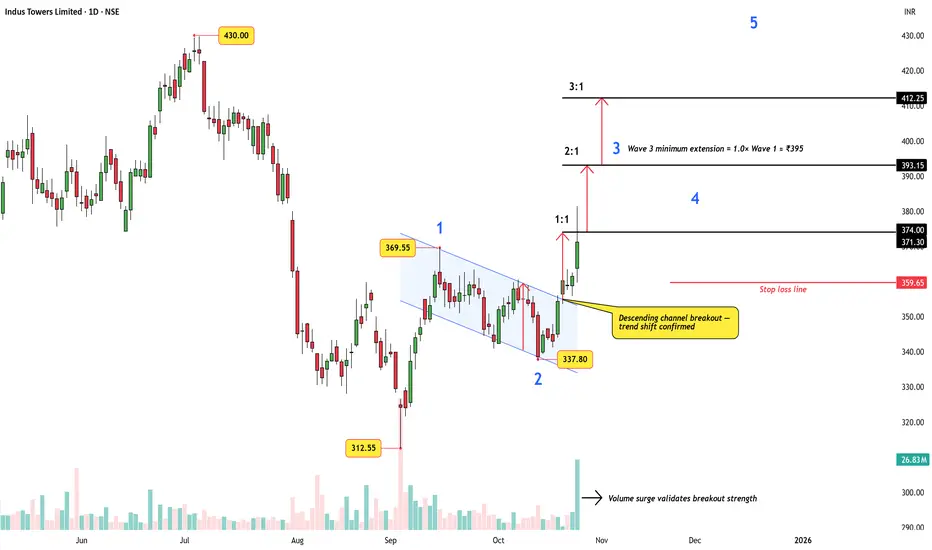
Indus Towers: Channel Breakout Meets Wave TheoryA simple but powerful concept from classical technical analysis — the channel breakout target — plays out beautifully here.
This idea, also discussed by Dr. Sudhir Dixit in his book on breakout signals, gives traders a disciplined way to estimate post-breakout targets.
After a steady five-wave advance from ₹312.55 to ₹369.55, Indus Towers entered a clean descending channel , forming the corrective Wave 2.
The breakout that followed came with a strong volume surge , confirming a clear shift in trend direction.
Concept Recap
In a channel breakout, the target can be derived by measuring the height of the channel (distance between support and resistance) and projecting it upward from the breakout point.
That gives the 1:1 projection , while stronger rallies often stretch toward 2:1 or 3:1 multiples of that range.
Wave Perspective
Elliott Wave traders can interpret this breakout as the early phase of Wave 3 , which typically extends 1.0 to 1.618× Wave 1 .
In this case, the 1.0× projection aligns near ₹395, while higher targets in the ₹412–₹430 zone fit naturally within Wave 3–5 progression.
Key Chart Highlights
Descending channel breakout — trend shift confirmed
Volume surge validates breakout strength
Wave 3 minimum extension ≈ ₹395
Stop-loss below ₹359 keeps the structure intact
Takeaway:
Even without labeling waves, the logic of a channel breakout offers a structured, rule-based method for identifying profit zones.
Combine it with wave theory, and you transform a simple pattern into a roadmap for impulsive rallies.
Disclaimer: This analysis is for educational purposes only and does not constitute investment advice. Please do your own research (DYOR) before making any trading decisions.
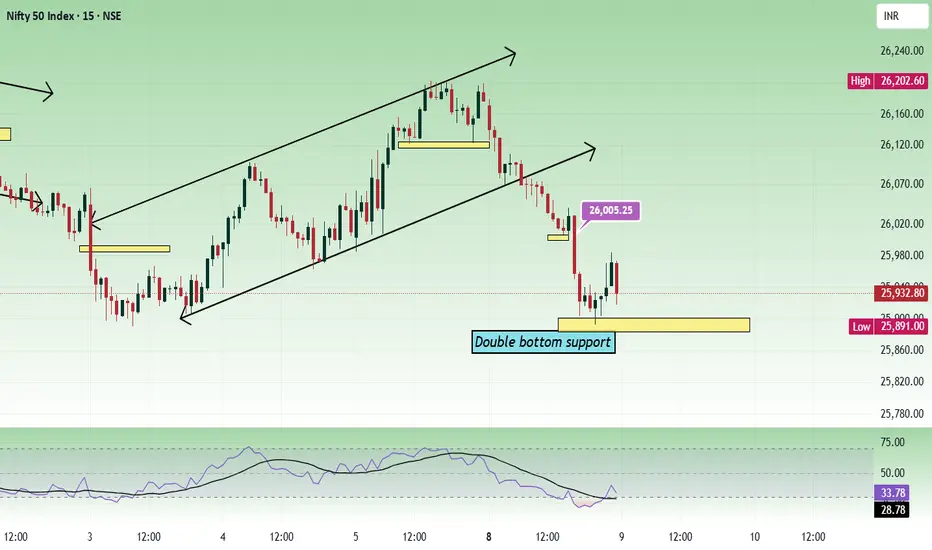
Nifty - Expiry day analysis Dec 9The price broke the channel and fall down towards the double bottom support at the 25900 zone. The price can move in this range 25800 to 26200 as per the higher(daily) and lower(15 minutes) chart analysis.
As per the daily chart, we can see a strong support at the 25850 zone.
Buy above 25900 with the stop loss of 25840 for the targets 25940, 25980, 26020, 26100, 26160 and 26200.
Sell below 25780 with the stop loss of 25840 for the targets 25740, 25700, 25640, 25600 and 25540.
Expected expiry day range is 25700 to 26100.
Always do your analysis before taking any trade.
TCS – Supply Zone + Channel Resistance | Short Idea (4H)Price has reached a major supply zone aligned with the upper channel resistance, creating a high-probability rejection zone.
The confluence of:
Horizontal resistance
Supply zone
Rising channel top
makes this area a strong rejection point.
🔵 Reason for Short Setup
Price is reacting at a previous rejection zone
Clear bearish wick activity near resistance
Channel structure shows exhaustion at the top
Risk:Reward remains favorable
🎯 Trade Plan
Entry: Around current rejection zone
Stop-Loss: Above supply zone + channel breakout
Target 1: Mid-channel
Target 2: Lower channel support
🔍 Market Structure
4H trend is still forming higher lows, but momentum weakens at resistance
If price closes above the blue zone, setup becomes invalid
Watching for confirmation candle (bearish engulfing / rejection wick)
⚠️ Invalidation
A strong 4H close above the blue resistance breaks the idea.
💬 Note
This is a pure price-action confluence setup. Will update once price reaches mid-channel target or shows breakdown signals.

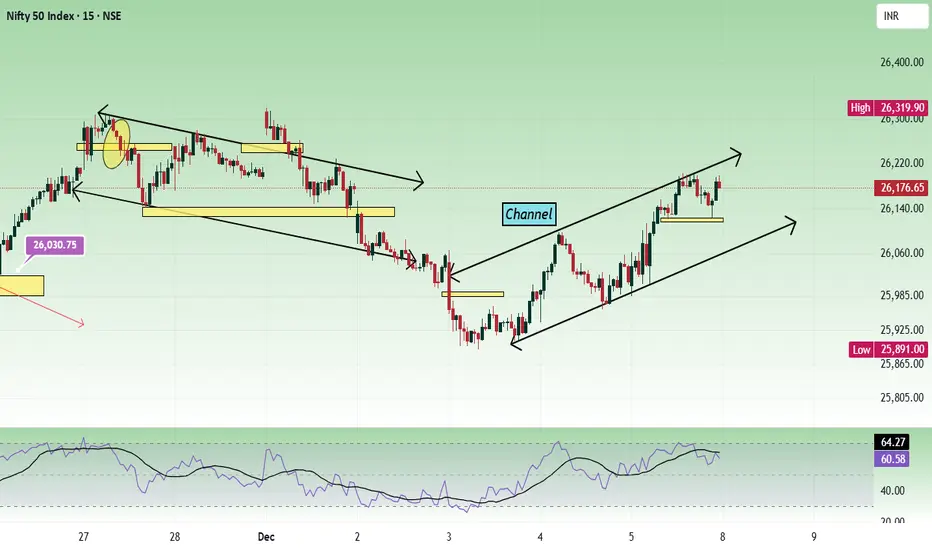
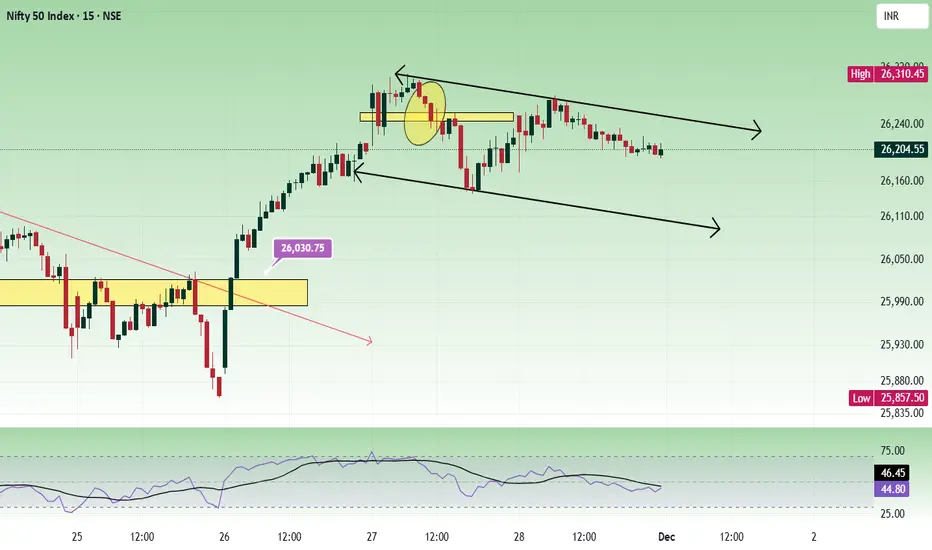
Nifty - Weekly review Dec 8 to Dec 12We can see two types of channels in the chart. Channel resistance and double top resistance is at the 26200 - 26220 zone. 26320 is another resistance. Since we can see 2 resistances nearby, and if the price is unable to gain strength, this zone can be choppy. As long as the price is above 26000, it is buy on dips unless the price falls with strong bearish strength.
Friday's movement was bullish as per the daily chart.
Buy above 26100 with the stop loss of 26050 for the targets 26140, 26180, 26240, 26300, 26360, 26420 and 26480.
Sell below 25900 with the stop loss of 25960 for the targets 25860, 25820, 25760, 25700, 25660, and 25600.
Always do your analysis before taking any trade.
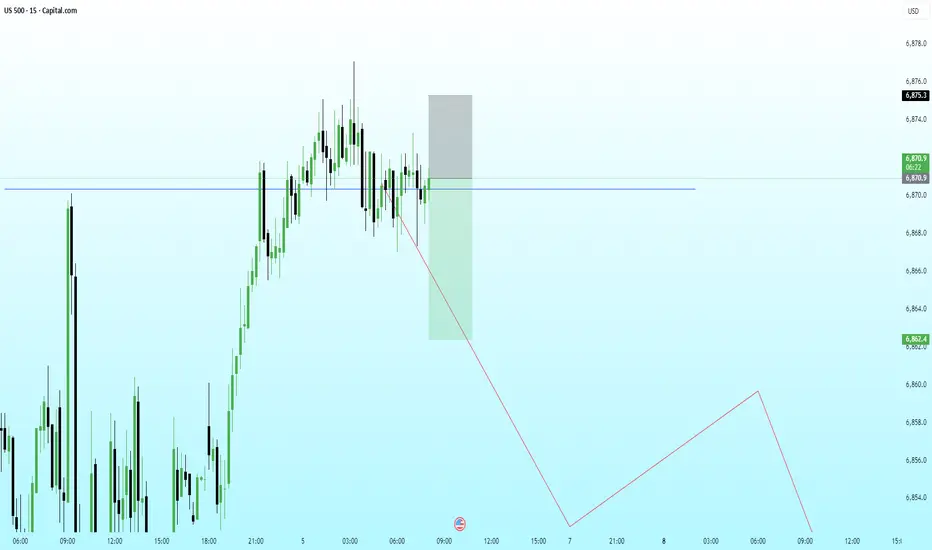
US500 – Clean Retest of Broken Structure With Bearish ContinuatiPrice has retested the broken structure level (blue line) and is now reacting inside a premium zone, suggesting sellers may re-enter the market from this region. The consolidation and repeated rejections indicate absorption of buy-side pressure.
With HTF context still pointing toward a deeper correction, this LTF retest offers a potential distribution setup before a continuation lower toward the next major liquidity pocket.
Bearish Path:
• Retest of the broken structure
• Reaction from premium supply zone
• LTF breakdown and structure shift
• Continuation toward downside liquidity + inefficiencies below
ICICI Bank — 200-DMA Rejection Keeps the Downtrend IntactMarket Context
ICICI Bank continues to trade inside a broad descending channel that has governed price since the 1500 peak. Every counter-trend rally has been corrective so far, and the recent recovery has shown the same character — overlapping candles, choppy subdivisions, and clear respect for channel resistance.
Key Technical Drivers
1. Rejection at the 200-DMA
The rally stalled exactly at the 200-Day Moving Average. This is the same zone where price lost momentum earlier, reinforcing that the long-term bias remains downward. A failed attempt to reclaim the 200-DMA in a corrective environment typically signals trend continuation rather than reversal.
2. Channel Resistance Still Untouched
Even though momentum carried the stock above short-term levels, the broader upper channel boundary continues to act as the main ceiling. Price behaviour near this level is corrective, not impulsive — another sign that the move is still part of a larger complex structure.
3. Structure Supports a Triple Zigzag (W-X-Y-X-Z)
This entire decline is best interpreted as a higher-degree W-X-Y-X-Z correction.
W bottomed at 1342.60
X rallied to 1445
Y bottomed at 1317.40
The ongoing rally fits well as the second X wave
Wave (c) of this X leg may be close to completion, but the subwaves allow room for a marginal push to retest the channel top before turning lower. Nothing in the current leg looks impulsive enough to suggest a larger trend reversal.
Trading Plan
Direction: Expect the next leg to unfold downward as Wave Z begins.
Target Zone: Break below 1317.40 is likely, with measured support near 1280–1300 at the lower boundary.
Invalidation: A sustained break above 1411.90 invalidates the bearish Z-wave view and opens the door for a trend reassessment.
Conclusion
The failed 200-DMA retest, corrective price structure, and channel resistance all point to the current recovery nearing exhaustion. Whether Wave X makes one more marginal high or not, the broader path remains lower toward the Wave Z terminal zone.
Disclaimer: This analysis is for educational purposes only and does not constitute investment advice. Please conduct your own research before taking any trading decisions.

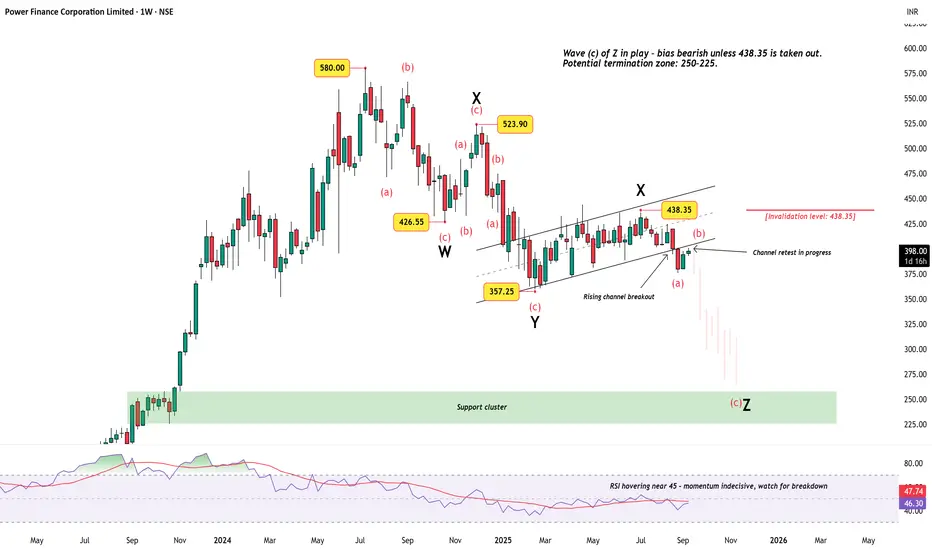
Power Finance Corporation – Complex Correction Still in PlayAfter topping out near ₹580, Power Finance Corporation (PFC) has been locked in a prolonged corrective structure. The price action since mid-2023 suggests a triple correction (W-X-Y-X-Z) , with the final leg (Wave Z) now unfolding.
Technical View
Price broke down from a rising channel and is currently retesting the underside of that channel – a classic setup to watch for continuation.
Wave (c) of Z appears to be in progress, keeping the near-term bias tilted bearish unless price crosses above ₹438.35 (invalidation level).
A potential termination zone lies around ₹250–225, aligning with the highlighted support cluster.
RSI is hovering in the mid-40s, showing lack of upside strength and leaning toward further weakness.
Summary
Bias remains bearish while below ₹438.35. A deeper leg into the ₹250–225 support cluster cannot be ruled out before this complex correction completes.
Disclaimer: This analysis is for educational purposes only and does not constitute investment advice. Please do your own research (DYOR) before making any trading decisions.
Nifty - Expiry day analysis Dec 2The price faced resistance at 26320 and fall down towards support. Now the price is testing the double bottom support at 26120.
If the price opens gap down and shows a bullish sign around the 26040 zone, buy above 26060 with the stop loss of 26010 for the targets 26100, 26140, 26180 and 26220. Channel resistance will be there at the 26200 zone.
If the price opens flat, check how it is reacting around 26200 and if it shows bullish strength, buy above 26240 with the stop loss of 26190 for the targets 26280, 26320, 26360 and 26400.
Sell below 25980 with the stop loss of 26030 for the targets 25940, 25900, 25860 and 25820.
Please note if the price opens at the 25300 zone or 25200 zone and shows bearish strength, then it is a sell.
Expected expiry day range is 25900 to 26300.
Always do your analysis before taking any trade.

Nifty - Weekly review Dec 1 to Dec 5The price was rejected from the resistance at the 26300 - 26320 zone. Sustaining above this is important to move up further. The daily chart shows the price has formed an inside bar. This type of range, when broken with strength, can give good movement.
26000 is the nearby psychological support zone.
If the price opens gap down and takes support from the lower trend line of the channel, buy above 26150 with the stop loss of 26100 for the targets 26190, 26240, 26280, 26320, 26360 and 26420.
Sell below 25980 with the stop loss of 26030 for the targets 25940, 25900, 25860, 25820, 25760 and 25720.
Always do your analysis before taking any trade.
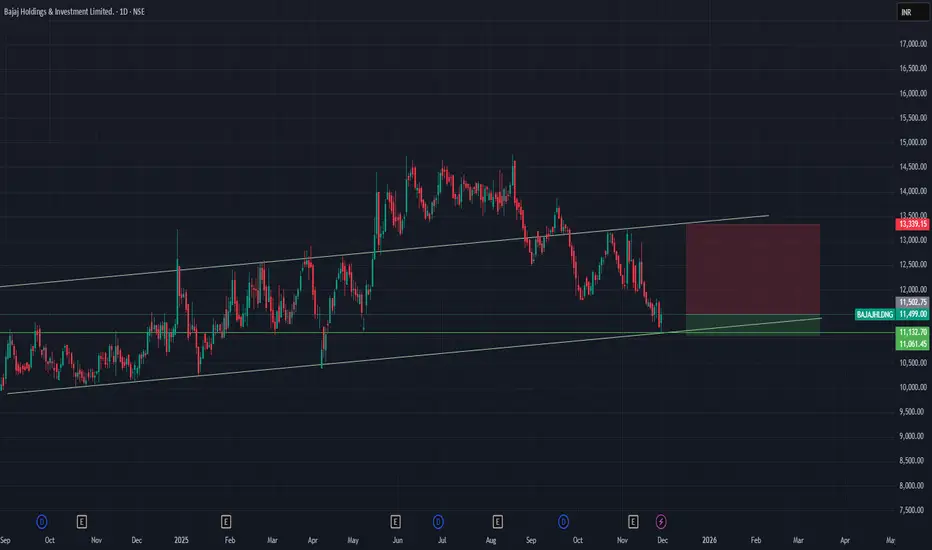
Bajaj Holding INvesting ready for 15% upsideBajaj Holding is ready for 15% upside. with small stop loss.
- RSI is 41
- On Support line
Please consult your financial advisor before investing.
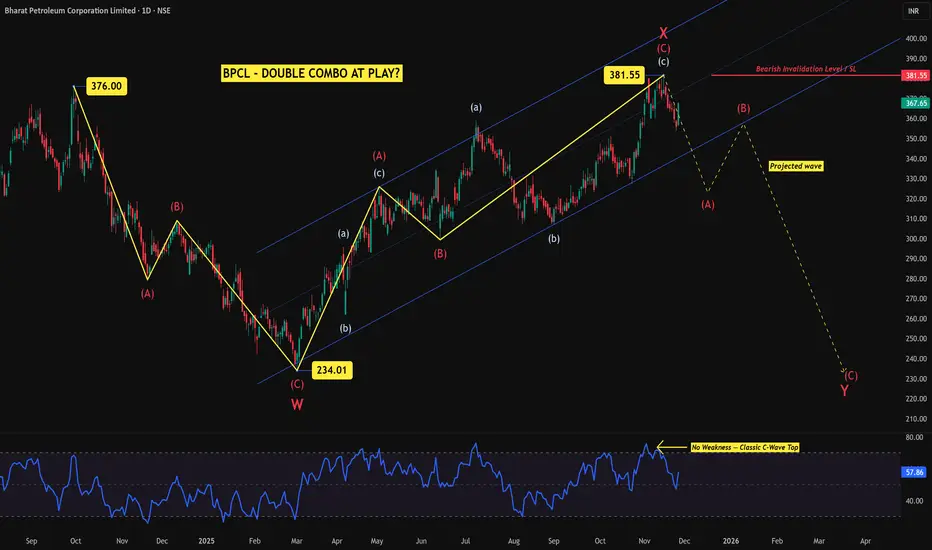
BPCL – Is a Double Combo Unfolding?After reviewing the recent price action in BPCL, the structure that initially looked like a potential impulsive rally has revealed a different internal behaviour upon closer inspection. The key deciding factor was the momentum profile at the recent high near 381.55 . Instead of showing the typical loss of strength expected at the end of a Wave 5, the RSI remained firm with no bearish divergence , which is a classic characteristic of a C-wave termination , not an impulsive fifth wave.
This prompted a reassessment of the entire advance.
Revisiting the Structure
From the March low near 234.01 , price advanced in a clear two-stage corrective manner. Both segments carried zigzag characteristics, aligning better with a W–X–Y double combo rather than an impulsive 1–2–3–4–5 sequence.
Wave W ended at 234.01 after a clean A-B-C decline.
The strong recovery that followed subdivided into two smaller zigzags, forming Wave X , which topped out at 381.55 .
The RSI behaviour at this point supported the corrective interpretation, showing strong momentum without the exhaustion typically seen at the end of an impulsive structure.
This combination lends weight to the view that the rally into 381.55 was corrective in nature.
Current Outlook – Wave Y in Progress
If the 381.55 high is accepted as the completion of Wave X, the decline from that point can be viewed as the early stages of Wave Y, which typically unfolds as another A-B-C structure.
The initial decline resembles a developing Wave A .
A corrective Wave B rebound can follow.
A deeper Wave C may then complete the entire double combo, with possible downside levels aligning toward the 240–260 region depending on the depth of the final leg.
These projected swings are guidelines, not certainties, and the internal structure of each leg must be monitored.
Invalidation Level
The critical level for this view is clear:
A decisive move above 381.55 invalidates the entire bearish W–X–Y expectation.
If price breaks and sustains above this level, the corrective interpretation collapses and a new bullish sequence would be favoured instead.
Conclusion
The internal characteristics of the rally—especially the RSI behaviour—support the idea that BPCL is unfolding a double combo correction rather than a completed impulsive advance. As long as the 381.55 level holds, the risk of further decline remains open, with a potential full completion of Wave Y lower.
Disclaimer:
This analysis is for educational purposes only and does not constitute investment advice. Please do your own research (DYOR) before making any trading decisions.
BITCOIN NEED BREATHE CRYPTO:BTCUSD
BTC need take relief of selling because selling is continuously happened so one little bounce is possible and that bounce works as retest of channel breakdown.
Reverse Scenario:
Formation of any bottom pattern
V shape recovery
Long consolidation after with volume brake out.
All chances is possible but there are low possibility
🧠 Always DYOR (Do Your Own Research)
⚖️ This is not financial advice or suggestion
👉 “Risk Is Real 💸 Stay Practical🚀”
💬 Please feel free to ask any questions (It's Free)

If This Is Just Beginning Than End Is Danger.CRYPTO:BTCUSD
Weekly Closing Is Importance For Confirmation And If We Get Confirmation Than Follow Through Is Another Confirmation.
Channel breaking started. if we calculate channel target then around $45000 USD 💀
Please Do Your Own Research Before Talking Any Trade.
I am not finical advisor.
If you have any questions, please feel free to ask me.

Nifty 50 On UP Trend for 2026Nifty has formed a channel pattern for the past 1 year and in Nov 2025 it has broken the channel and has also done a retracement. Based on the height of the channel, we can expect Nifty to touch 29000, but maybe it can go beyond that and touch 30K by end of 2026 or early 2027.
Disclaimer: Kindly check with your financial advisor before taking any trade.

L&T Technology Services: Correction Complete Near Golden Ratio?After a textbook five-wave impulse from ₹2,924 (2022 low) to ₹6,000 (2024 high), L&T Technology Services appears to have completed a proportional A–B–C correction, finding support precisely near the 0.618 retracement (₹4,099) of the entire advance.
Wave Structure
The advance from the 2022 low unfolded as a clean 5-wave impulse, capped by Wave 5 near ₹6,000.
The subsequent decline subdivides neatly into A–B–C, with Wave C forming a perfect five-wave internal pattern.
Sub-wave (v) of C bottomed around ₹3,951 — just below (iii), confirming structural completion with ideal symmetry.
Fibonacci & Channel Confluence
The decline halted exactly at the 0.618 retracement of the prior impulse — a zone that often attracts buying in post-impulse corrections.
The downward-sloping corrective channel that’s guided Wave C is now flattening, with price repeatedly testing its upper boundary.
A sustained breakout above ~₹4,300–₹4,400 would signal that the market may be transitioning into a new impulsive phase.
Trade Perspective (Educational View)
Scenario 1 – Bullish:
A weekly close above ₹4,400 confirms breakout from the C-wave channel, opening the door toward ₹5,200 → ₹5,650 in subsequent impulsive waves.
Scenario 2 – Extended Correction:
Failure to clear the channel and a close below ₹3,950 would extend the correction toward deeper retracements near ₹3,600 or even ₹3,400.
Summary
L&T Technology Services has now checked every box of a mature corrective phase — Fibonacci alignment, structural symmetry, and wave alternation.
A breakout above the declining channel would be the first real hint that the larger uptrend is ready to resume. Until then, patience beats prediction.
Disclaimer :
This analysis is for educational purposes only and does not constitute investment advice. Please do your own research (DYOR) before making any trading decisions.

#ANGELONE: Big Swing Setup Inside Falling Channel#AngelOne | CMP: 2,793.40
Trading inside a falling channel , after a successful retest of the 1949–2022 breakout zone .
Dips toward 2,341 can be considered.
🛡 Supports: 2133–2101 / 2022–1949 (Major Zone)
🚧 Resistances: 3285 / 3503 / 3896 (ATH)
🎯 Falling Channel Target post Breakout: ~4,900 (+77% from CMP)
As long as 1,949 holds , structure stays bullish .
Massive swing opportunity forming. 🔥
#AngelOne #FallingChannel #ChartPattern #CandlestickPattern #PriceAction #SwingTrading
📌 #Disclaimer: This analysis is shared for educational purposes only. It is not a buy/sell recommendation. Please do your own research before making any trading decisions.

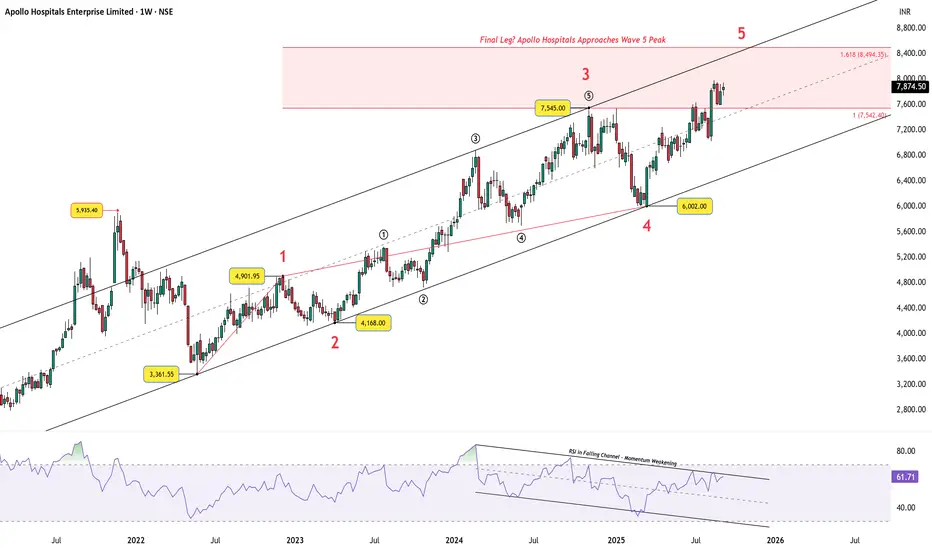
Apollo Hospitals – Wave 5 Approaches Completion at ATH ZoneAfter a strong multi-year uptrend, Apollo Hospitals now trades inside the projected terminal zone of Wave 5. The stock has rallied from its Wave 4 low near ₹6,002 and is advancing toward the Fibonacci cluster between ₹7,542 – ₹8,494, where 1.0x and 1.618x extensions converge.
The long-term channel has guided price action well: Wave 4 respected the lower boundary, and now Wave 5 is pressing near the upper half of the channel.
However, the RSI tells a different story . Momentum has been stuck in a falling channel, even as price climbs higher. This bearish divergence signals exhaustion — a common occurrence when a fifth wave approaches completion.
Key Takeaways:
Wave 5 is nearing its potential terminal zone.
Price resistance sits between ₹7,542 – ₹8,494.
RSI falling channel highlights weakening momentum.
Signs of exhaustion suggest caution at current levels.
Disclaimer: This analysis is for educational purposes only and does not constitute investment advice. Please do your own research (DYOR) before making any trading decisions.
JTEKT India Technical AnalysisHere's a comprehensive TradingView report for JTEKT India Limited:
Current Price:160.90
📊 TECHNICAL SETUP OVERVIEW
JTEKT India is displaying a compelling technical structure within a well-defined ascending channel pattern that has been in play since the 2020 lows. The stock is currently consolidating after a significant rally and appears to be setting up for the next leg of movement.
KEY TECHNICAL OBSERVATIONS
1. Channel Pattern Analysis:
- Long-term Ascending Channel: The stock has been respecting a parallel channel since 2020, with clear support and resistance boundaries
- Current Position: Trading in the middle zone of the channel, suggesting room for movement in either direction
- Channel Support: Lower trendline around 120-130 zone
- Channel Resistance: Upper trendline projecting towards 220-240 zone
2. Moving Average Structure:
All major moving averages are sloping upward, confirming a strong bullish trend across multiple timeframes.
3. Price Action Patterns:
- Clear higher highs and higher lows formation since 2020
- Recent consolidation after touching 220+ levels suggests healthy profit-booking
- Volume expansion during rallies indicates strong buying interest
- Formation of a potential inverse head and shoulders pattern on monthly timeframe
4. Support & Resistance Levels:
Immediate Support Zones:
- S1: 148-150 (8/13 EMA cluster)
- S2: 134-135 (50 EMA + channel support)
- S3: 120-122 (psychological level + lower channel boundary)
Resistance/Target Zones:
- Target 1:188.50 (Previous swing high)
- Target 2: 209.71 (Major resistance + psychological 200 level)
- Target 3: 255.40 (Channel top + Fibonacci extension)
PROJECTION & TREND ANALYSIS
Bullish Scenario (Higher Probability):
If the stock holds above 148-150 support zone:
1. First target: 188.50 (18% upside potential)
2. Breakout above 190 could trigger momentum towards 209.71
3. Ultimate target within channel: 255.40 (58% upside from current levels)
Bearish Scenario (Risk Assessment):
Break below 134 (50 EMA) could lead to:
- Retest of 120-122 zone (channel support)
- Deeper correction to 110-115 if channel breaks
- This would invalidate the current bullish setup
CONCLUSION
JTEKT India Limited presents a well-defined bullish channel with strong moving average support. The technical structure suggests the stock is consolidating before the next leg up, with multiple targets identified.
Accumulate on dips toward 148-150, add on strength above 170, with ultimate targets of 188, 210, and ₹255.
Disclaimer: This is a technical analysis for educational purposes only. Not financial advice. Technical analysis should be combined with fundamental research, and proper risk management should always be employed. Past performance does not guarantee future results.
#JTEKT #TechnicalAnalysis #StockMarket #ChannelTrading #SwingTrading #NSE #AutoSector #MovingAverages #TrendAnalysis #IndianStocks

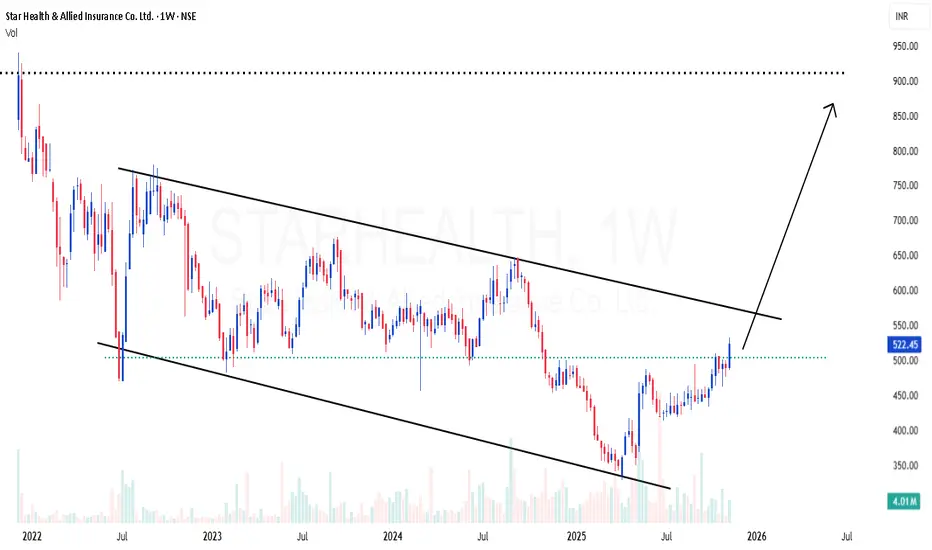
STARHEALTH | Strong channel breakout ahead with good risk rewardSTARHEALTH | Strong channel breakout ahead with good risk reward
CMP : 522
SL : 460
Target : 900+
Asian Paints Turns Colorful Again!Hello Mates! Here’s a chart that really caught my attention this week Asian Paints showing strength after a long phase of quiet sideways movement. The structure is clean, the breakout is sharp, and the message from price action is clear momentum is shifting again.
After spending almost two years inside a broad consolidation zone between 3600 and 2600 (blue box), the stock finally formed a smaller accumulation base between 2200 and 2600 (green box). Within this base, price consistently made higher lows, hinting at renewed buying interest.
Now a strong breakout above the upper boundary of this smaller channel backed by volume confirms that buyers are regaining control.
A short term retest near 2650–2700 could offer an ideal pullback entry before continuation.
Technically two targets come into play-:
Target 1: The falling resistance trendline near ₹3100.
Target 2: falling resistance line breakout can lead this move toward 3600, which also aligns with the upper blue supply zone the same area that capped price for nearly two years.
Overall, this looks like a base-to-base transition where a fresh uptrend is emerging after a long consolidation. A sustained close above 3100 would further confirm this shift in structure.
Trading Insight-:
When higher lows meet a strong breakout, it often signals that the accumulation phase is ending and smart money is stepping back in.
Regards-- Amit.
