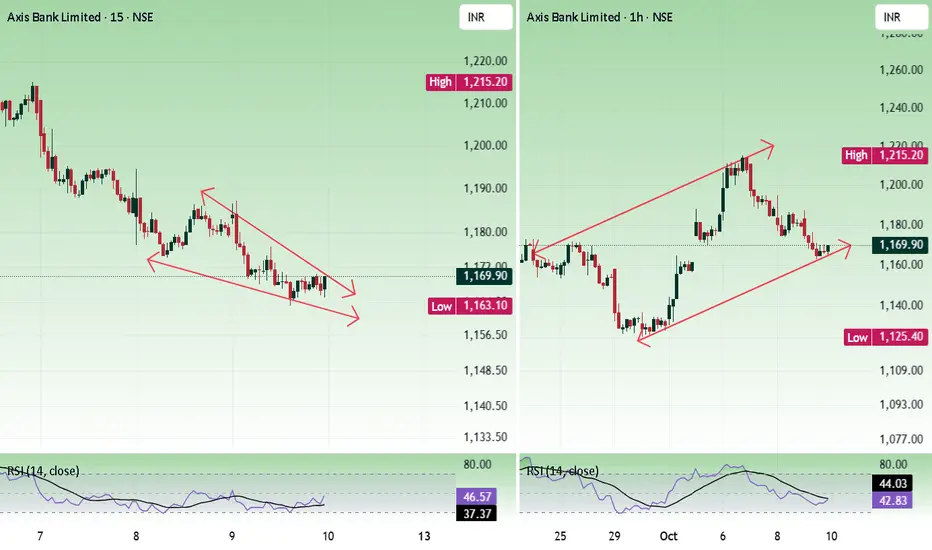
Axis bankPrice faced resistance at the 1200 - 1220 zone and falling. In higher time, the price is moving inside an ascending triangle. In a lower time frame, a falling wedge has formed. Both are bullish patterns. Holding 1160 is important for bulls.
Buying is risky if the price dont have volume strength.
Buy above 1168 with the stop loss of 1161 for the targets 1174, 1182, 1190, and 1198.
Sell below 1156 with the stop loss of 1164 for the targets 1148, 1140, 1132, and 1126.
Always do your analysis before taking any trade.
Parallel Channel
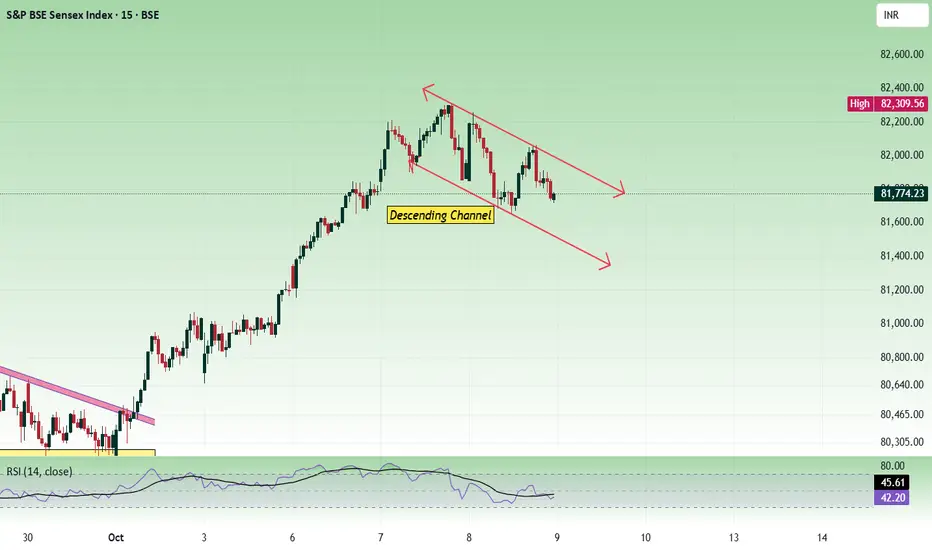
Sensex - Expiry Day Analysis Oct 9Price was facing resistance from the 82300 zone and falling. This movement was forming a descending channel as the fall was in a zig-zag manner. Nearby support is at the 81500 zone and resistance at the 82000.
Buy above 82040 with the stop loss of 81900 for the targets 82120, 82260, 82400, 82520, and 82600.
Sell below 81820 with the stop loss of 81920 for the targets 81740, 81620, 81500, 81380, and 81220.
Expected expiry day range is 81400 to 82000.
Always do your analysis before taking any trade.
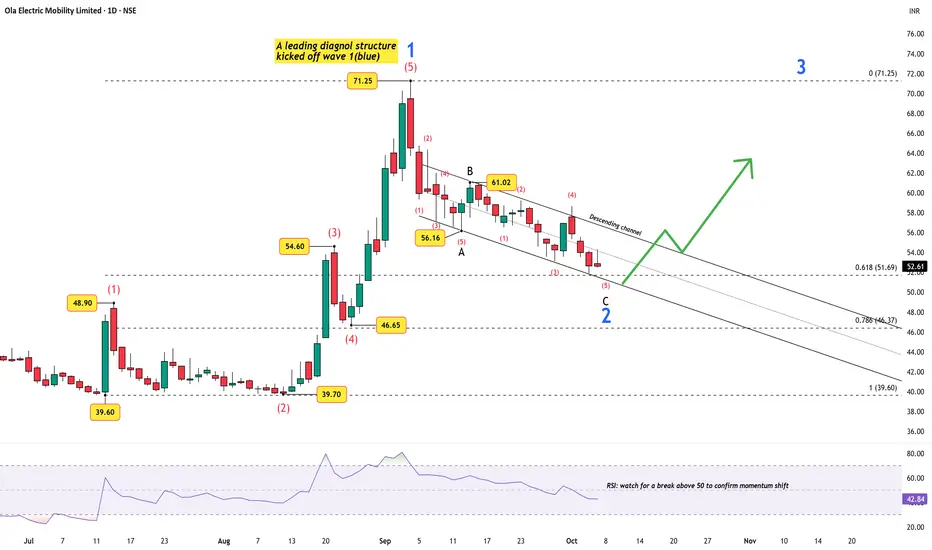
Charging Up for Wave 3 — Ola’s Motor Just Got Certified!The electric vehicle (EV) space in India is heating up again — and Ola Electric seems to be quietly positioning itself for the next leg of growth. The company’s recent government certification for its in-house ferrite motor marks an important milestone: a domestically designed motor that avoids costly rare-earth materials, potentially boosting margins and cutting import dependence.
This development strengthens Ola’s role in India’s push toward self-reliant, cost-efficient electric mobility, just as the market eyes the next growth phase in EV adoption.
Technically, the stock appears to be cooling off after its first strong impulse. The chart reveals a leading diagonal structure kicking off Wave 1, followed by a Wave 2 correction unfolding as a 5-3-5 zigzag inside a descending channel . Price now hovers near the 0.618 to 0.786 Fibonacci retracement zone (₹51–₹46) — historically a prime setup area before a potential Wave 3 expansion.
The RSI near 43 suggests downside momentum is fading, but the confirmation cue will be a break above 50 , signaling a shift in control to buyers.
In short: fundamentals are recharging while the technical battery is nearly full. Accumulation makes sense only once either
price dips toward ₹46–₹47 (deep retracement pocket), or
A breakout from the descending channel confirms that Wave 3 is ready to drive the next rally.
For now, Ola’s story is less about “if” and more about “when.”
Disclaimer: This analysis is for educational purposes only and does not constitute investment advice. Please do your own research (DYOR) before making any trading decisions.
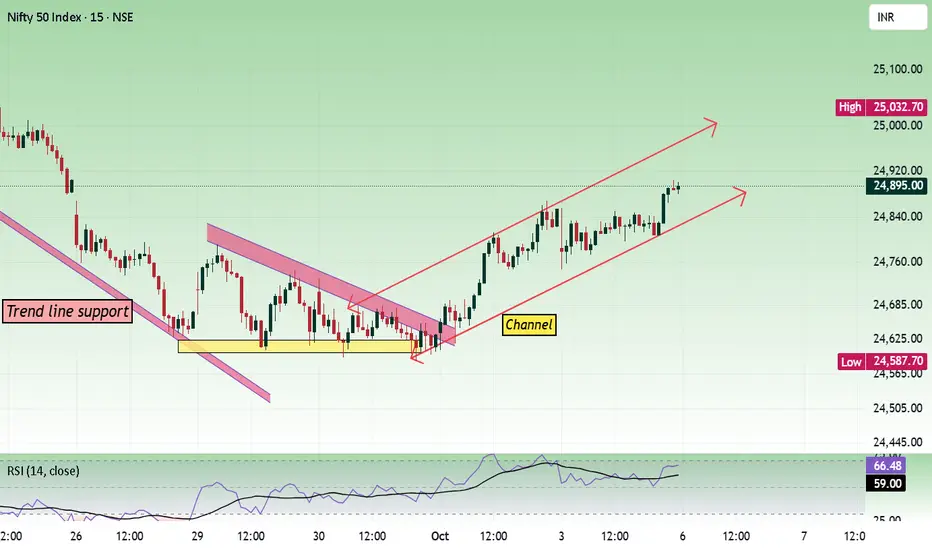
Nifty - Weekly Review Oct 6 to Oct 10In a lower time frame, the price is moving within an ascending channel. Channel movement requires more patience to identify trade setups and execute them. In the daily time frame, the price is taking a trendline support.
Nearby resistance is seen at the 25000 zone.
Buy above 24920 with the stop loss of 24860 for the targets 24960, 25000, 25040, 25100, 25160, 25220, and 25280.
Sell below 24760 with the stop loss of 24820 for the targets 24720, 24660, 24600, 24560, and 24520.
Always do your analysis before taking any trade.
Britannia holds mild bullish trend with steady support zonesTopic Statement:
Britannia remains a mildly bullish stock, resilient to broader market corrections and ideal for structured trading.
Key Points:
1. The stock recently formed a double top candlestick pattern, indicating possible short-term resistance
2. Price can be accumulated when it falls below the 50-day EMA, a level that has historically provided good entries
3. It moves within an up-trending bullish channel, making it well-suited for disciplined channel-based trading strategies

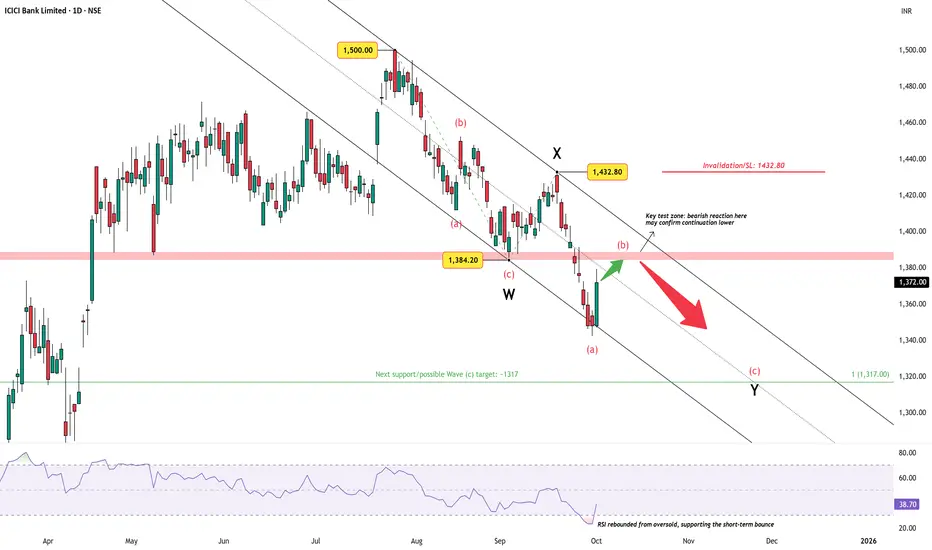
ICICI Bank – Relief Rally into ResistanceAfter topping at ₹1500 , ICICI Bank has corrected over 10% into late September, carving out a clear W–X–Y corrective structure. The recent bounce from oversold RSI levels was expected, but price is now heading straight into the crucial resistance band near ₹1384 .
A bearish reaction here would validate the ongoing correction, opening the path toward the next support / Wave (c) target at ~₹1317 .
However, any sustained move above ₹1432.80 would invalidate the bearish view and suggest a different structure in play.
Overall, the setup currently favors caution on rallies, with focus on whether sellers defend the resistance band.
Disclaimer: This analysis is for educational purposes only and does not constitute investment advice. Please do your own research (DYOR) before making any trading decisions.
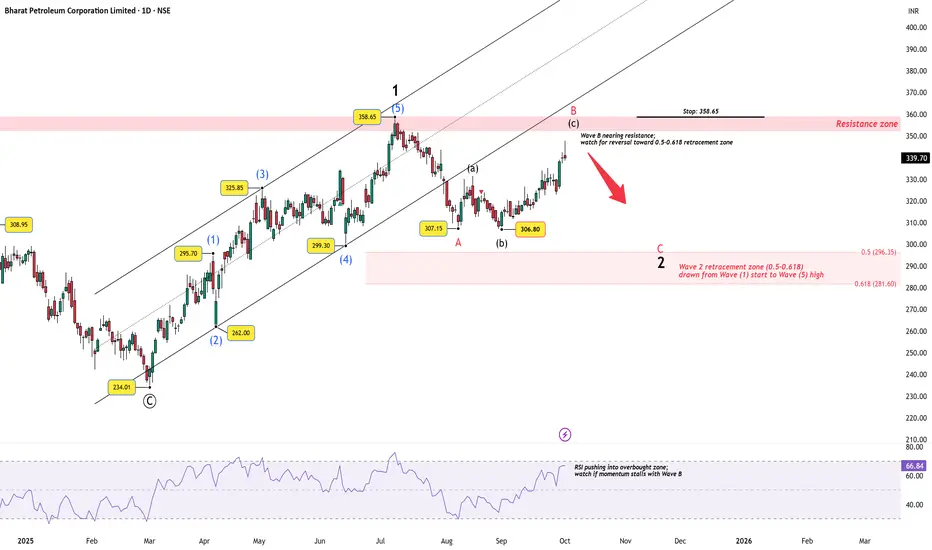
BPCL– Wave B Nearing Resistance, Wave 2 Correction Still in PlayBack on August 20, I highlighted that BPCL had completed a 5-wave advance from 234.01 to 358.65 , marking higher degree Wave 1, and that a corrective Wave 2 was in progress. (Earlier technical analysis write-up is attached here: )
At that time, only Wave (a) of the correction was visible. Since then, price action has unfolded further:
Wave B is now rising into a strong resistance cluster near 350–358.
Unless price decisively breaks above 358.65 , the move remains corrective.
A final Wave C decline into the 0.5–0.618 retracement zone (296–281) remains the higher probability path.
Momentum check: The RSI is pushing higher alongside Wave B, but if momentum stalls here, it would confirm the setup for a downward leg.
Key Levels:
Resistance / Stop: 358.65
Retracement Zone: 296 – 281
Summary: The corrective roadmap outlined in August is still intact. With Wave B nearing exhaustion, focus now shifts to a potential Wave C decline toward 296–281, before the larger bullish structure resumes with Wave 3.
Disclaimer: This analysis is for educational purposes only and does not constitute investment advice. Please do your own research (DYOR) before making any trading decisions.
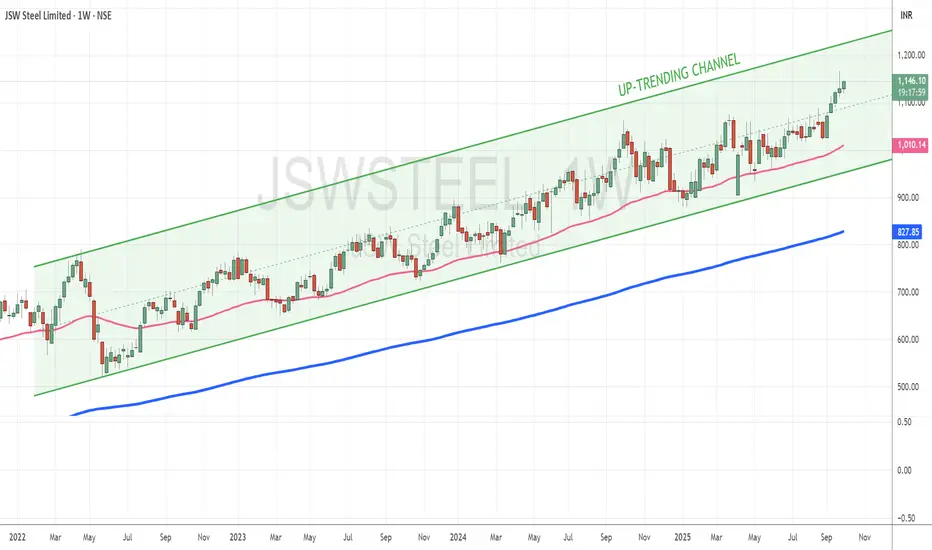
JSW Steel powers through bullish channel with momentumTopic Statement:
JSW Steel is on a relentless bullish run, steadily climbing within a strong up-trending channel that continues to attract accumulation.
Key Points:
1. The stock is moving consistently in a strong bullish channel, making directional trading highly structured and reliable
2. It rarely dips below the 50-day EMA, and when it does, it presents a strong investment or accumulation opportunity
3. The clearly defined channel makes it ideal for disciplined channel-based trading strategies
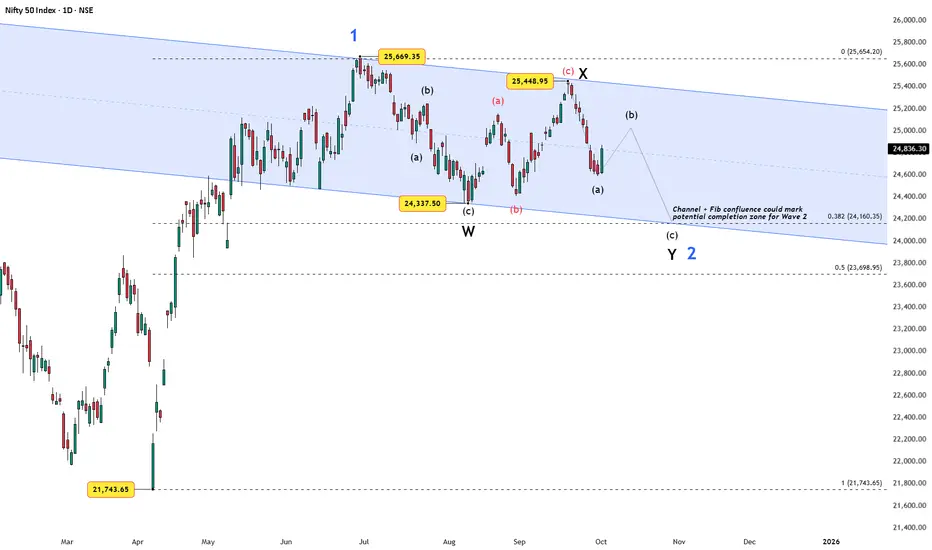
Nifty 50 – Wave 2 Correction and the Confluence ZoneDisclaimer: This analysis is for educational purposes only and does not constitute investment advice. Please do your own research (DYOR) before making any trading decisions.
After bottoming at 21,743.65 in March 2025, Nifty launched a strong impulsive rally that topped at 25,669.35, marking Wave 1 of a new higher-degree advance.
Since then, price has been moving inside a downward-sloping channel , forming what appears to be a Wave 2 correction.
The subdivisions so far suggest a W–X–Y structure :
Wave W ended at 24,337.50.
Wave X topped at 25,448.95.
Wave Y is now unfolding, with (a) in place, (b) potentially in progress, and (c) likely still pending.
To assess possible completion zones, Fibonacci retracements of Wave 1 offer key checkpoints:
0.382 retracement at ~24,160, aligning with the channel base.
0.5 retracement at ~23,699, a deeper but still acceptable Wave 2 target.
This channel + fib confluence provides a meaningful area where Wave 2 could terminate, setting the stage for the next bullish leg — Wave 3.
Key Levels:
Resistance : 25,450 – 25,670 (breakout here invalidates the immediate Wave 2 scenario).
Support : 24,160 (0.382 fib and channel base).
Deeper support : 23,700 (0.5 fib).
Alternate scenario: If price continues sideways without decisive weakness, the correction may evolve into a triangle for Wave 2 instead of a W–X–Y.
Takeaway: As long as price respects the channel and fib zones, Wave 2 remains corrective in nature. A sustained break higher would open the path for Wave 3 — the next impulsive advance.
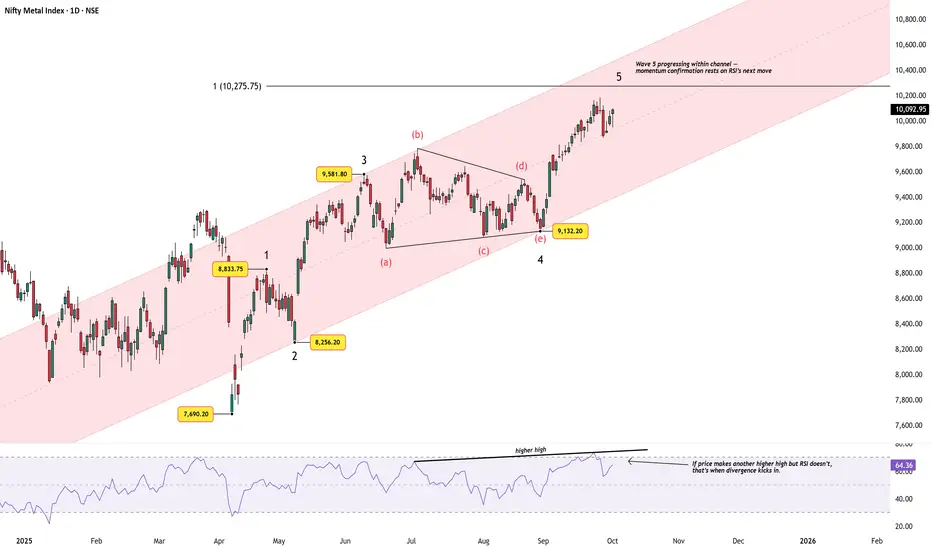
Nifty Metal Index – Fifth Wave Progression Within ChannelChart Structure:
The Nifty Metal Index continues to respect its rising channel, now advancing in Wave 5 after a clean contracting triangle in Wave 4. The impulse structure remains intact, with price steadily hugging the channel’s midline and now stretching toward the upper half.
Elliott Wave View:
Wave 1 topped near 8,833.75, after a strong rally from 7,690.20.
Wave 2 retraced into 8,256.20, holding close to the 0.382 retracement of Wave 1.
Wave 3 extended sharply to 9,581.80.
Wave 4 unfolded as a clean contracting triangle (a–b–c–d–e), ending at 9,132.20.
Wave 5 is currently progressing within the channel, with price advancing to 10,275.75, towards the 1.0x Fib extension level of Wave 1 projected from Wave 2.
Momentum Check:
RSI has confirmed the latest higher high, keeping momentum aligned with price. The key to watch now: If price makes another higher high but RSI fails to do so, that’s when bearish divergence would emerge.
Summary:
The index maintains a constructive Elliott Wave structure, but we are in late-wave territory. The channel provides a natural guide — holding the midline favors further upside, while a sustained breach of the lower channel would warn that Wave 5 has matured.
Disclaimer: This analysis is for educational purposes only and does not constitute investment advice. Please do your own research (DYOR) before making any trading decisions.
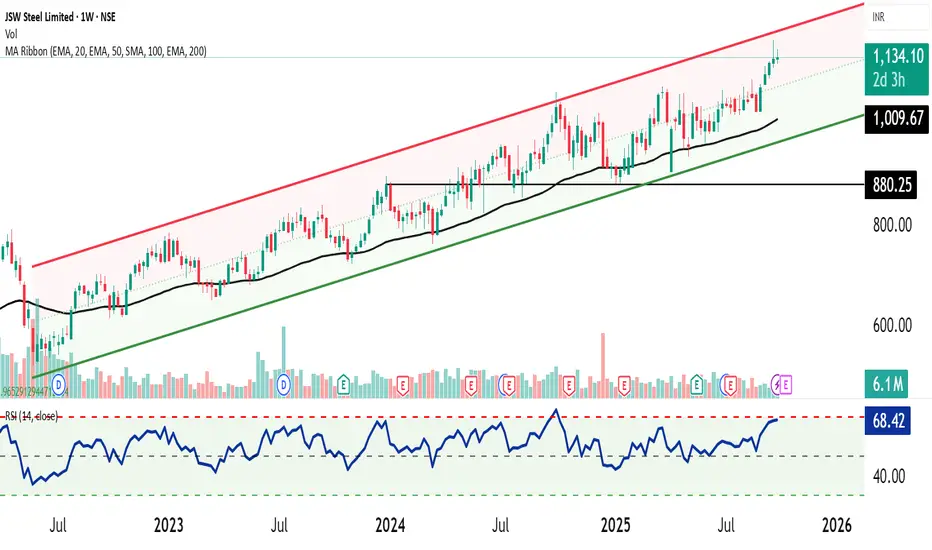
JSW Steel - Upward Parallel Chanel 📈 JSW Steel is moving in a well-defined Upward Parallel Channel on the weekly timeframe, reflecting a strong and sustained uptrend. The price action has consistently respected the channel boundaries, confirming steady buying interest.
📊 Overbought Condition:
However, the stock is currently trading near the upper band of the channel, with momentum indicators suggesting an overbought zone. This raises the possibility of a cool-off phase or a retracement toward the mean reversion (mid-channel support).
🔎 Momentum Indicators:
RSI readings indicate stretched levels, warranting caution for fresh long entries at current prices.
Volume trends remain supportive of the overall uptrend, but short-term corrections cannot be ruled out.
🎯 Projection & Outlook:
While the medium- to long-term trend stays firmly bullish, traders should watch for a possible retracement toward mid-channel support before fresh accumulation. Sustaining within the channel ensures the continuation of the uptrend, while any breakout above the channel could accelerate momentum further.
⚠️ Disclaimer:
This is a technical projection for educational purposes only and not an investment recommendation. Traders should adopt proper risk management while framing any strategy.
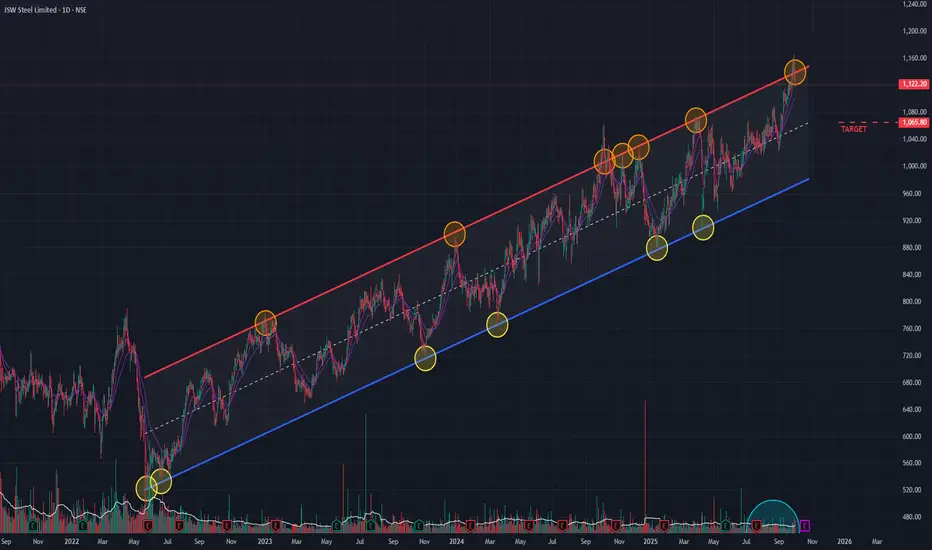
JSW Steel (D) - Tests Upper Boundary of Long-Term ChannelJSW Steel is currently trading at a critical juncture, testing the upper resistance trendline of a well-defined channel pattern that has been in place since May 2022. Historically, this trendline has acted as a strong barrier, often leading to a price reversal back towards the lower end of the channel.
Bearish Indicators Emerge 📉
Several technical indicators are suggesting that the upward momentum is waning and a potential downturn could be imminent:
- RSI Divergence: The Relative Strength Index (RSI) is showing bearish signs on the daily chart and is also starting a negative crossover on the weekly chart.
- Momentum Shift: Short-term Exponential Moving Averages (EMAs) on the daily chart are entering a negative crossover , signaling a potential shift in short-term momentum to the downside.
- Rising Bearish Volume: There has been a noticeable increase in selling volume as the stock approaches this resistance, indicating strengthening bearish pressure.
Outlook and Key Levels
Given the stock's position at a historical resistance level combined with multiple bearish technical signals, a cautious approach is warranted.
If the channel pattern holds true, the stock could reverse from this level and head downwards. A potential downside target in this scenario would be the support level near ₹1,065 . The price action in the coming sessions will be crucial to confirm this potential reversal.
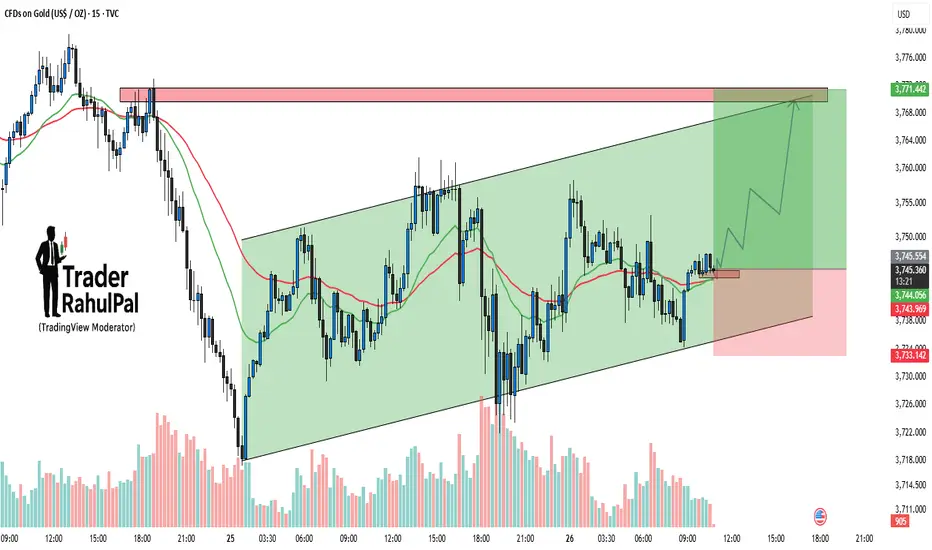
Gold – Channel Support Holding, Upside Target Towards 3770Gold is trading within a well-defined ascending channel on the 15-min chart. Price action has repeatedly respected both support and resistance lines, which makes this pattern highly reliable in the short term. Currently, the price is bouncing from the lower channel support and holding firmly above the 3740–3743 zone. As long as this support area is protected, the bullish momentum remains intact and the next upside target comes in around 3770, aligning with the channel resistance. A breakout above 3770 could trigger an even stronger rally, while a failure to hold below 3733 would invalidate the setup and shift the bias to the downside.
Disclaimer: This analysis is for educational purposes only and should not be taken as financial advice. Please do your own research or consult your financial advisor before investing.
Analysis By @TraderRahulPal (TradingView Moderator) | More analysis & educational content on my profile
👉 If you found this helpful, don’t forget to like and follow for regular updates.
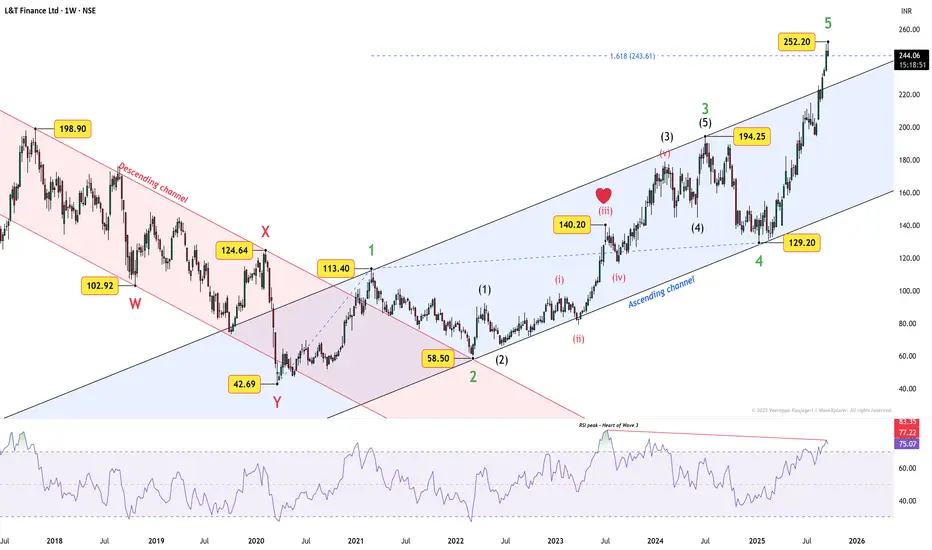
L&T Finance – Story of Two Channels and the Heart of Wave 3The chart of L&T Finance tells a neat Elliott Wave story through channels and Fibonacci.
First, notice the two channels. The old descending channel captured the corrective W-X-Y down to ₹42.69. From there, price shifted into an ascending channel .
Look how cleanly price respected this structure:
Green Wave 1 kissed the upper line of the ascending channel.
Green Wave 2 bottomed at ₹58.50 — right at the intersection of both channels.
Green Wave 3 again touched the channel’s upper line, marking its high with precision.
Green Wave 4 rested at the lower line of the channel.
Within Wave 3, the strongest push came at ₹140.20 — the famous heart of Wave 3 (what traders call the 3-of-3-of-3). RSI also peaked there, confirming it as the most powerful thrust of the sequence.
Now, price has surged into Green Wave 5 , reaching ₹252.20 , which is already above the 1.618 Fibonacci extension. It could extend higher, but RSI is diverging — momentum is not confirming the new highs.
That makes me cautious. While my view is leaning bearish, I don’t want to chase the upside here. Confirmation will come only if price falls back inside the ascending channel . Once that happens, I’ll update bearish targets based on fresh price action.
For now, the chart has delivered a textbook lesson: two channels, a Fibonacci story, and the heart of Wave 3 flashing exactly where it should.
Disclaimer: This analysis is for educational purposes only and does not constitute investment advice. Please do your own research (DYOR) before making any trading decisions.
SCHWSCHW has recently delivered a Triangle Pattern breakout within the context of a long-term parallel channel that has been forming over several years. This convergence of patterns suggests a potential shift in momentum and a likely resumption of the broader trend.
The breakout from the triangle indicates emerging bullish sentiment, but a decisive breakout above the 2-year high is still pending. This level is a critical resistance, and once breached, it could confirm the breakout’s strength and initiate a more sustainable upward move.
Following such a breakout, a retest of the breakout zone would be a healthy technical development and could provide an ideal entry point for long-term investors.
Looking ahead, if the breakout holds and the stock maintains its trajectory, SCHW may attempt to reach the upper boundary of the outer parallel channel over the next 2–3 years, offering a favorable risk-reward setup for position traders and long-term investors.
Summary:
Pattern Identified: Triangle breakout within a long-term parallel channel
Key Resistance: 2-year high (yet to be broken)
Potential Entry: On breakout and subsequent retest
Medium/Long-Term Target: Upper edge of the outer parallel channel
Outlook: Bullish with long-term growth potential over 2–3 years

Axis Bank rally faces overbought pressureTopic statement:
Axis Bank has rallied sharply over the past 10 sessions, but signs of short-term exhaustion and resistance suggest a potential pause or pullback.
Key points:
1. The recent price surge has filled the gap created on 18th July 2025, reaching a potential resistance zone
2. MFI is elevated at 86, indicating the stock is highly overbought in the short term
3. Candlesticks have formed a steep 70-degree ascent, reflecting sharp bullish intensity
4. Price has jumped above both the 50 and 200-day EMAs, signaling strong momentum but potential overheating
5. The stock may now consolidate below the 1200 level due to increased selling pressure
6. The long-term bullish channel remains intact, as price bounced off the lower trendline support during its recent move

DKPast 6 year it has consolidated very well.
Earlier in Jun '22, Dec '22 and Apr '24 it tried to cross the level of 33 however failed to do so.
Today's move looks like a clear Breakout and now it may try to test the upper edge of the channel.
Risk is very deep at 22, Therefore any shakeout later may be good idea to add more.
Hold for 2 year

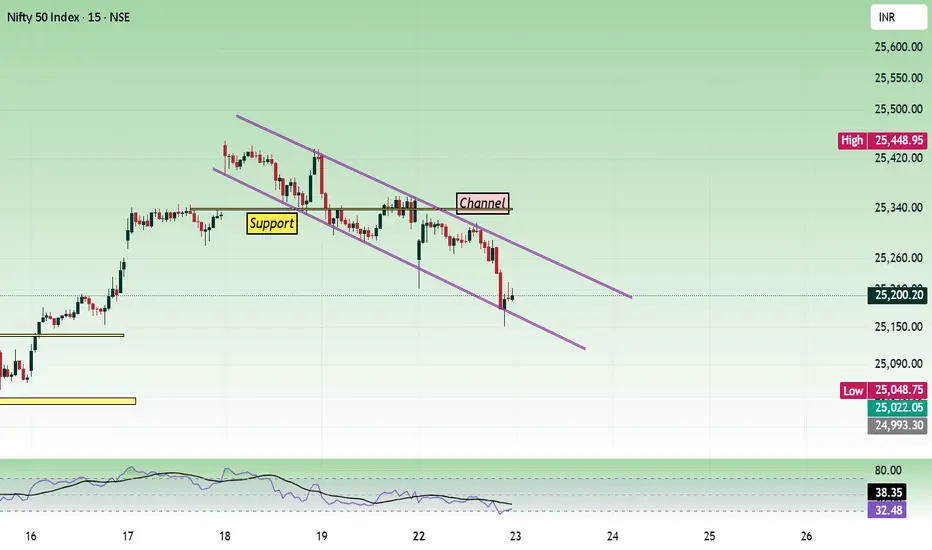
Nifty - Expiry Day Analysis Sep 23Price faced resistance around the 25300 - 25320 zone and fall down. Next nearby support is seen at 25080 as per the one-hour chart.
In the lower time frame, the price is moving inside a descending channel.
Buy above 25240 with the stop loss of 25200 for the targets 25280, 25320, 25360, 25420, and 25480.
Sell below 25160 with the stop loss of 25200 for the targets 25120, 25080, 25040, 25000, and 24950.
Expected expiry day analysis is 25050 to 25400.
Always do your analysis before taking any trade.
Nifty - Weekly Analysis Sep 22 - Sep 26The price is moving within a channel and is testing an important support level at 25350. It can give good movement by sustaining above 25350.
Buy above 25350 with the stop loss of 25290 for the targets 25400, 25460, 25500, 25560, 25620, 25680, and 25740.
Sell below 25240 with the stop loss of 25280 for the targets 25200, 25160, 25100, 25040, 25000, 24960, and 24920.
As per the hour chart, 25300 is a strong support. Any strength around this level can make the price to move towards 25800.
Always do your analysis before taking any trade.

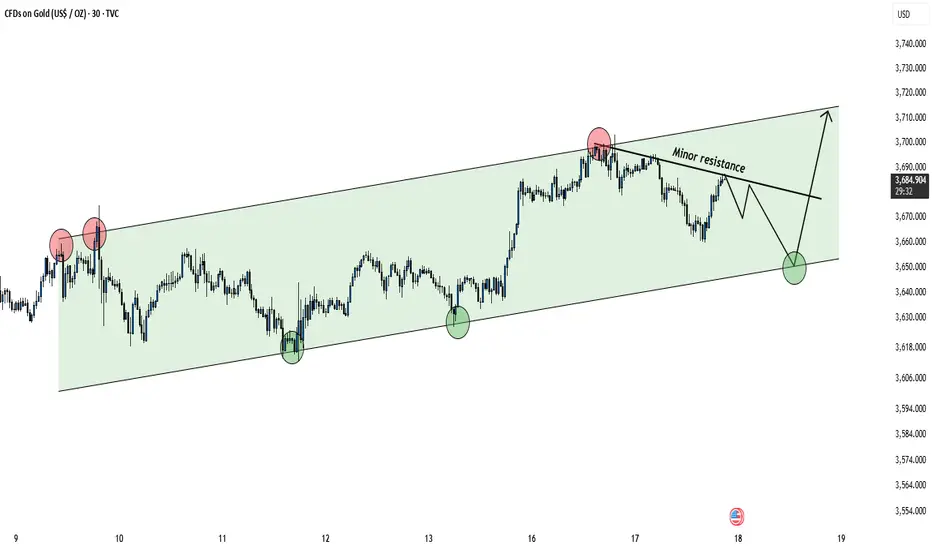
Gold Trading Inside Channel – Key Support & Resistance Levels!Hello Traders!
Gold is currently moving inside a well-defined ascending channel on the 30-min chart. Both buyers and sellers are respecting the levels of this channel, giving us clear trading opportunities.
Key Observations
Price has tested the upper channel resistance multiple times, facing rejection near $3,710–$3,720.
The lower channel support around $3,650 has been well respected, creating strong buying reactions.
A minor resistance trendline is now forming, which could temporarily limit upside momentum.
Short-term path suggests: rejection from minor resistance → retest of channel bottom → potential bounce back toward the upper channel.
Trading Plan
Bullish bias remains intact as long as Gold holds above $3,650 channel support.
A bounce from support may target $3,710–$3,720 zone again.
If support breaks, deeper correction may follow.
Rahul’s Tip
Always wait for confirmation near channel edges. Trading inside the channel can be tricky, but respecting support and resistance gives you high-probability setups.
Disclaimer: This analysis is for educational purposes only and should not be taken as financial advice. Please do your own research or consult your financial advisor before investing.
Analysis By @TraderRahulPal (TradingView Moderator) | More analysis & educational content on my profile
👉 If you found this helpful, don’t forget to like and follow for regular updates.
Sensex - Expiry day analysis Sep 11Today's price moved in a descending channel pattern, and the range was small. Trend direction deciding level is 81500.
Buy above 81520 with the stop loss of 81400 for the targets 81600, 81720, 81800, 81920, 82040, and 82200.
Sell below 81260 with the stop loss of 81380 for the targets 81180, 81060, 80980, 80860 and 80720.
The daily chart shows the price is at the trendline resistance. It can make the price volatile.
Always do your analysis before taking any trade.

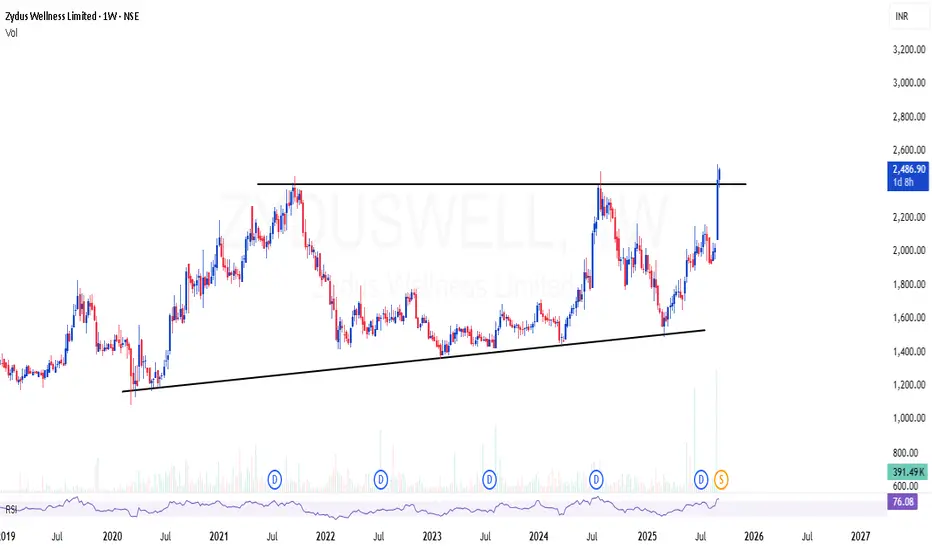
ZYDUSWELL | Simple channel breakout - Looks potential 60-70%ZYDUSWELL | Simple channel breakout - Looks potential 60-70%
CMP : 2486 (Dip : 2200)
SL below : 2000
Target : 4000+
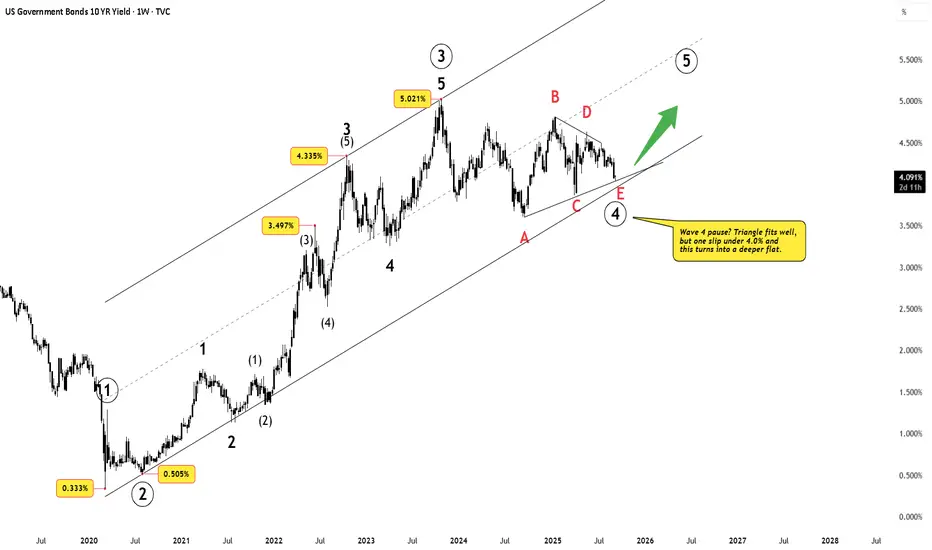
US 10Y Yield – Wave 4 Pause Before the Final SurgeDisclaimer: This analysis is for educational purposes only and does not constitute investment advice. Please do your own research (DYOR) before making any trading decisions.
The Setup
The US 10-year yield has been consolidating after topping near 5.021%. Price action since then has formed a contracting structure that looks very much like a Wave 4 triangle .
At present, yields hover near 4.0% — a crucial pivot.
Triangle view: Wave 4 is complete, setting the stage for Wave 5 higher.
Flat view: If yields break below 4.0%, Wave 4 may stretch deeper into a flat correction, potentially testing 3.6–3.7%.
Either way, the Elliott script points to one more advance: Wave 5 up .
What Wave 5 Could Mean
If the US 10-year yield really enters Wave ⑤ up, buckle up:
Bond prices tank → inverse relation, so Treasuries bleed.
Equities feel the heat → higher yields = expensive valuations, especially for growth stocks.
Dollar flexes → global FX could see USD strength.
Borrowing costs bite → mortgages, corporate loans, government debt servicing all tighten.
In short: Wave ⑤ = a macro “stress test .”
Why India Should Care
A breakout in US yields rarely stays a US-only story. For India, it means:
FII outflows as global funds chase safer US returns
INR under pressure , increasing imported inflation risks
Indian bond yields rising , even without RBI action
Equity market stress , especially in IT and rate-sensitive sectors
Final Thoughts
The triangle scenario points to an imminent breakout above 5.0%. A deeper flat only delays it. For traders and investors, this is the chart to watch — because Wave 5 in US yields isn’t just a bond market story, it’s a global macro shockwave .