HDFC Bank Surges to Lifetime High Within a Defined Bullish ChannTopic Statement:
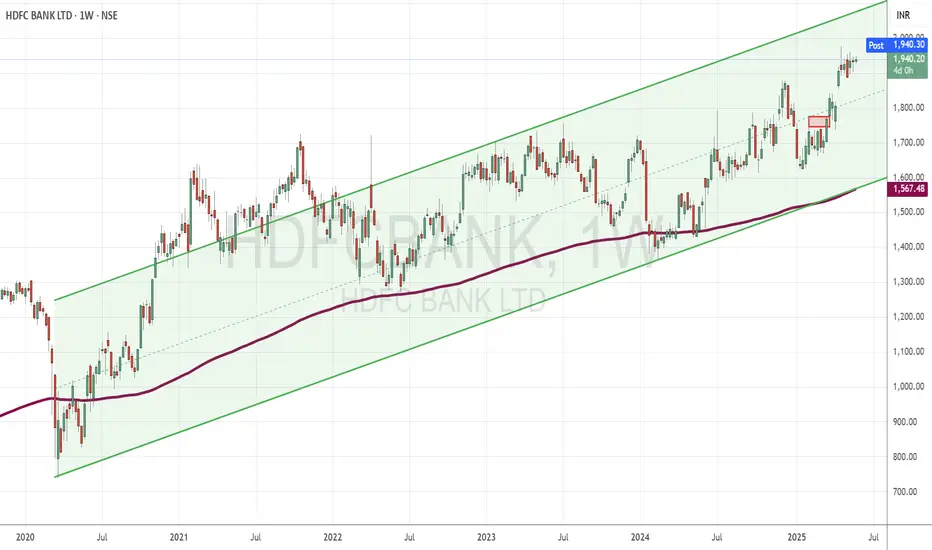
HDFC Bank is on a strong bull run, steadily climbing within a well-defined uptrending channel.
Key Points:
* The stock is trading within a bullish uptrending channel, offering clear opportunities for channel-based trading
* It is currently at its lifetime high, reflecting strong investor confidence and momentum
* The price has significantly overextended above the 200-day EMA, indicating the stock is highly overbought and may be due for consolidation or a pullback
Parallel Channel
HDFC LIFE: NOT A LONG, A FAKE BREAK OUT???1. NSE:HDFCLIFE broke the previous ATH at 780 and weekly candle closed above it
2. Retails are excited to look at this and might buy in bulk on Monday.
3. There is a perfectly fitting channel and the channel top near 810.
4. Wait for the price action near the channel.
5. Possibility of a fake break down from the channel top and a great opportunity to short if close below 770 after touching the channel top.
6.So, wait and watch and enjoy the show!!

RelianceDaily chart is showing price is at double bottom support. In lower time frame price is moving inside a descending channel.
Buy above 1411 with the stop loss of 1401 for the targets 1421, 1434, 1446 and 1458.
Sell below 1390 with the stop loss of 1401 for the targets 1380, 1366, 1354 and 1340.
Always do your own analysis before taking any trade.

UNIONBANK – Positional Breakout SetupPattern: Double Bottom | W Pattern Inside Channel
Trend: HH-HL Structure | Trading Inside Ascending Channel
Volume: Noticeable Build-Up
DMAs: Trading Above Key DMAs
Stage: Aiming for Stage 2 Breakout
The stock is forming a double bottom (W pattern) inside a well-respected ascending channel, with a clean higher high–higher low structure and visible volume build-up. It's now trading above key DMAs, hinting at underlying strength. With price approaching a key breakout zone, it looks primed for a potential Stage 2 continuation.
🔔 Trade Plan
Entry: ₹143.38+ (on breakout and daily close above)
Stop Loss: ₹121.74 (closing basis )
Target 1: ₹151.72
Target 2: ₹172.83
Risk–Reward Insight 🎯
Risk from entry to SL is ₹21.64.
Reward to Target 1 is ₹8.34 (~1:0.38)
Reward to Target 2 is ₹29.45 (~1:1.36)
While T1 gives a conservative move, the bigger play lies in T2 — the upper edge of a 1-year trading range. This is where smart money tends to scale in.
💡You don’t have to go full throttle on day one.
✅ Consider buying a test quantity above ₹143.38 to assess breakout strength.
If the move confirms with strong follow-through and volume, you can look to add on dips or above T1 with a tighter trailing SL.
This approach helps you ride trends without overexposing yourself early. The key is to stay mechanical and let the setup prove itself.
⚠️ Risk Management is Non-Negotiable
Never ignore your stop loss.
Don't chase.
Stick to your plan and size positions according to your risk appetite.
This setup looks technically clean — but remember: even the best setups fail without confirmation. Let price and volume lead the way.
📌 Disclaimer:
This is not investment advice. I am not a SEBI-registered advisor. All content is for educational purposes only. Please do your own analysis and always trade responsibly.

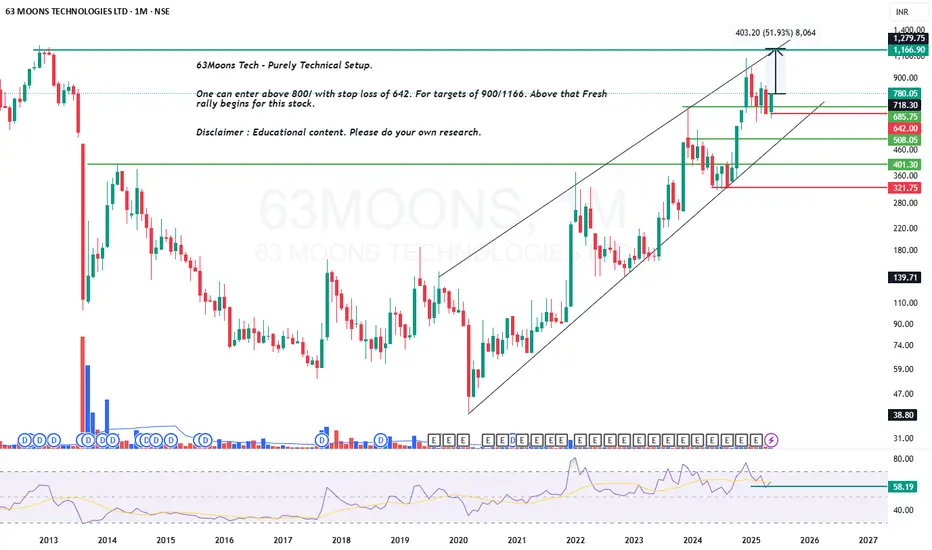
63Moons - Looks for Fresh upmove. Valid Above 80063Moons Tech - Purely Technical Setup.
One can enter above 800 with stop loss of 642. For targets of 900/1166. Above that Fresh rally begins for this stock.
Disclaimer : Educational content. Please do your own research.
Is BTCUSD still in WXY correction phase ?BTCUSD continues to be correcting till 48K-62K band, this is weekly chart so it will take time.
Current up-move seems to be X wave as indicated.,
Why 51-62K is the band where correction will end ?
a. Technical divergence gets resolved here
b. 1.618 Fib relation of assumed corrective Wave-W falls in this band
Can the current rising segment impulsive ?
No because current rising segment is pretty corrective supporting high probability of next wave-Y
Will the correction stop at Wave-Y ?
May not be as one more leg up (Wave-X) and one more Leg down (Wave-Z) can be formed

BEL – Sector Strength + Double Bottom + Volume Thrust 📈 BEL – Sector Strength + Double Bottom + Volume Thrust = A Setup Worth Tracking
The India Defence Index just broke into new all-time highs, possibly driven by rising geopolitical tensions — but beyond the headlines, the sector remains structurally strong.
BEL (Bharat Electronics Ltd) is showing powerful confluence:
A double bottom breakout
Sectoral support
Rising volumes
Key moving averages reclaimed
All of this sets up a technically sound positional opportunity.
🧠 Technical Highlights
✅ Stock trading above key DMAs
✅ Volume picking up — watch for 4x–5x surge to confirm strength
✅ ATH at ₹339.90 may act as resistance; clean breakout above it = add/fresh entry
✅ Defence sector index at ATH – macro tailwind active
🧮 Setup Overview
Entry Zone ₹32.7
Stop Loss (SL) ₹287.65
ATH Resistance ₹339.90
Target (Positional) ₹399.10
SL % -10.09%
Target % +24.72%
Risk : Reward 1 : 2.45
🧭 Suggested Strategy
🔄 Add 30–40% at breakout
🧘 Wait for pullback or retest to add more
🚫 Avoid chasing — shakeouts are very likely
🧠 Gradual accumulation + disciplined risk management > FOMO
📊 Volumes should confirm — clean candle with strong demand = green signal
⚠️ Final Note:
We are not entirely out of danger — markets can throw brutal pullbacks and false breakouts. Defensive positioning, proper sizing, and exit planning are essential.
📉 Disclaimer:
This is not a buy/sell recommendation. For educational purposes only. Do your own research and manage risk as per your trading style.

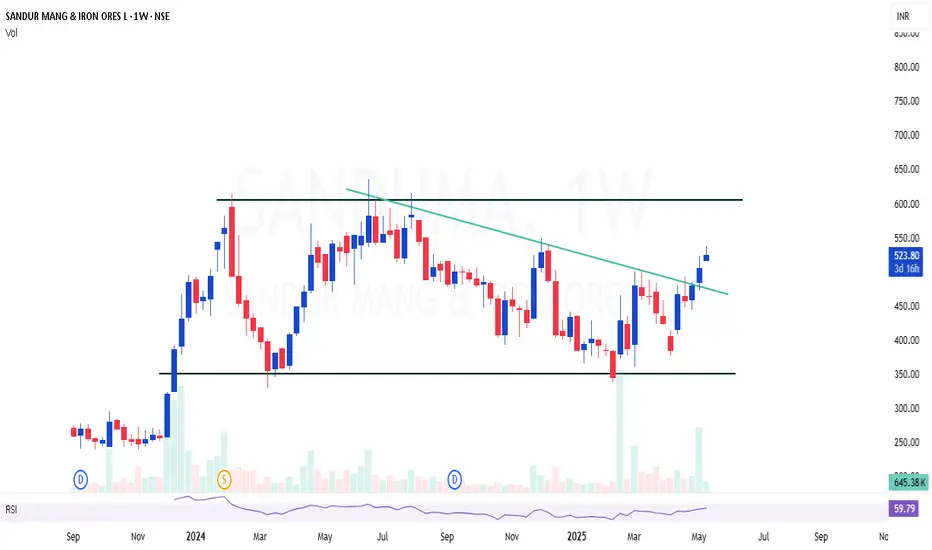
SANDUMA | High quality stock with good technical setupSANDUMA | High quality stock with good technical setup - Looks good for doubling
Investment and reserves are increasing strongly
Breakout above the channel line will take us straight away to 800+
CMP : 523
Target : 800
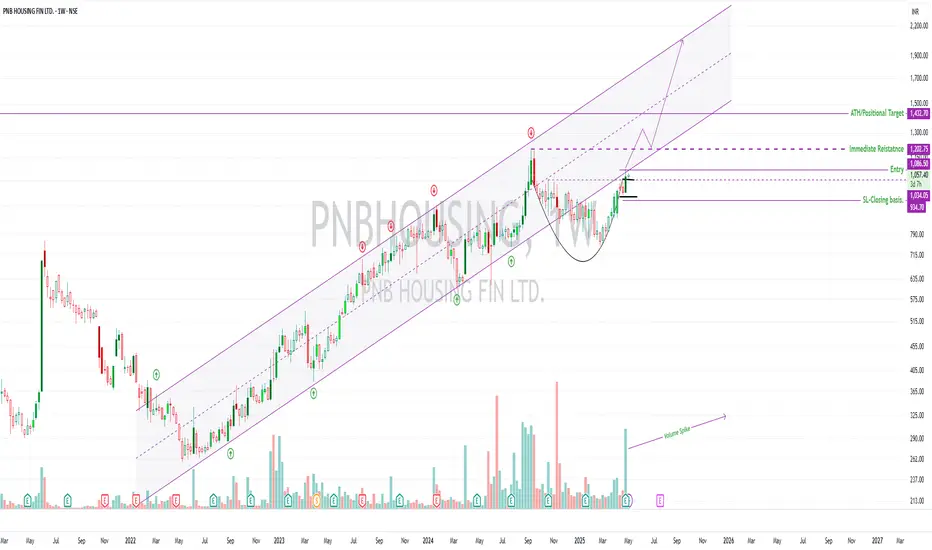
PNB Housing Finance – Weekly Positional Setup🏠 PNB Housing Finance – Weekly Positional Setup
🧭 Strategy: Cup & Handle breakout | 🏦 Sector: Housing Finance / NBFC
🔍 Setup Overview
The stock is trading above key DMAs, indicating strong trend alignment 🔼
Sector momentum is clearly picking up — Housing Finance & NBFCs showing traction 📈
After briefly breaking below its ascending channel, price is now attempting a re-entry — often a bullish sign of reclaiming strength 🔁
A Cup & Handle pattern is forming on the weekly chart — a classical continuation setup 🏺
The first breakout zone was ₹1034.05, which had decent Weekly volume — but caution due to weakness seen in Daily TF 📉
📊 Volume Insight (Why It Matters)
✅ Weekly TF shows volume spike during recent bullish move
⚠️ However, on the Daily TF, red candles had higher volume — suggesting distribution or supply at higher levels
⛔ Avoid low-volume breakouts — these tend to fail or trap early entries
🔑 Wait for a clean Weekly close above ₹1086.50 with volume support(Risk Takers can take the leap now)
🧩 Confluence Factors (Multiple Confirmations = Stronger Setup)
Pattern is forming inside a long-term ascending channel
Reclaiming the channel = bullish structural strength
Sector strength + stock above all key moving averages = powerful context
All this happening in a period where broader market (Nifty 500) is still below 200DMA, making relative strength stand out
⚠️ Macro & Technical Risks
Price could stall or reverse at the positional target near ₹1432.70 (ATH zone)
Geopolitical uncertainty and macroeconomic shifts (rate changes, FII flow) could derail the move
If volume does not accompany breakout, avoid or reduce position
🛡️ Risk Management & Strategy
Use ₹934.70 as SL, based on structure, strictly on closing basis
Total risk: 13.36%, potential reward: 31.85%, giving R:R = 1 : 2.36
Only enter after clear breakout confirmation with volume
This is a positional setup, not a short-term one.
Most important: Position sizing is critical — don’t overcommit on early setups
🎯 Educational Note
Cup & Handle setups are most powerful when supported by:
Multi-timeframe confirmation 📈
Sectoral strength 🏦
Channel/structural context 📐
Volume breakout 📊
Patience is your edge. Enter only when all the pieces align.
Disclaimer: This analysis is for educational and informational purposes only. It does not constitute investment advice or a recommendation to buy or sell any securities. Always conduct your own research and consult with a qualified financial advisor before making any trading decisions. Past performance is not indicative of future results. Trade responsibly.
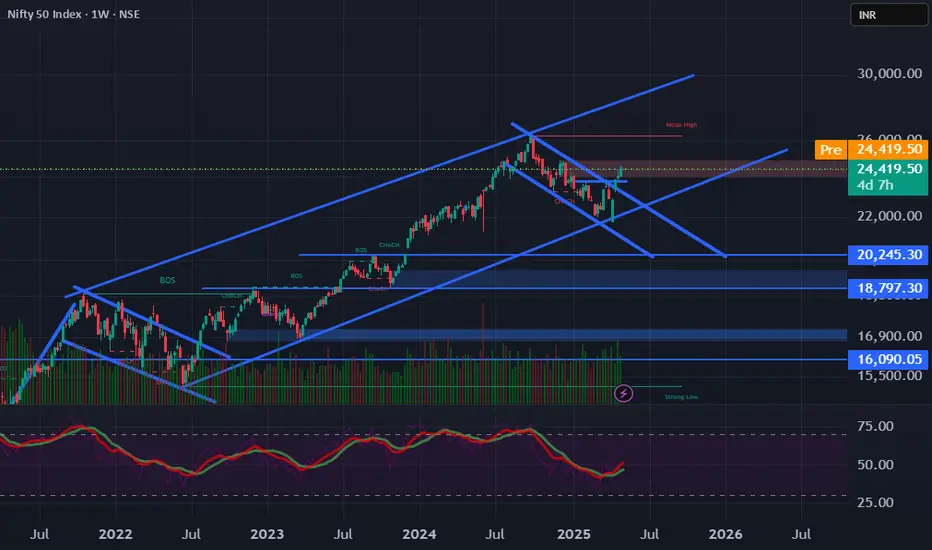
Channel Pattern - NIFTYNIFTY
Nifty now trade channel pattern break and trade above .
Next nifty uptrent Target 28500 shortly.
Nifty 2021 oct to 2024 sep trading in channel pattern only. So Pattern support zone recently enter and recover. Pattern continue coming days also.
Next short term target 24500 if hold above 24500 Next target 28500.
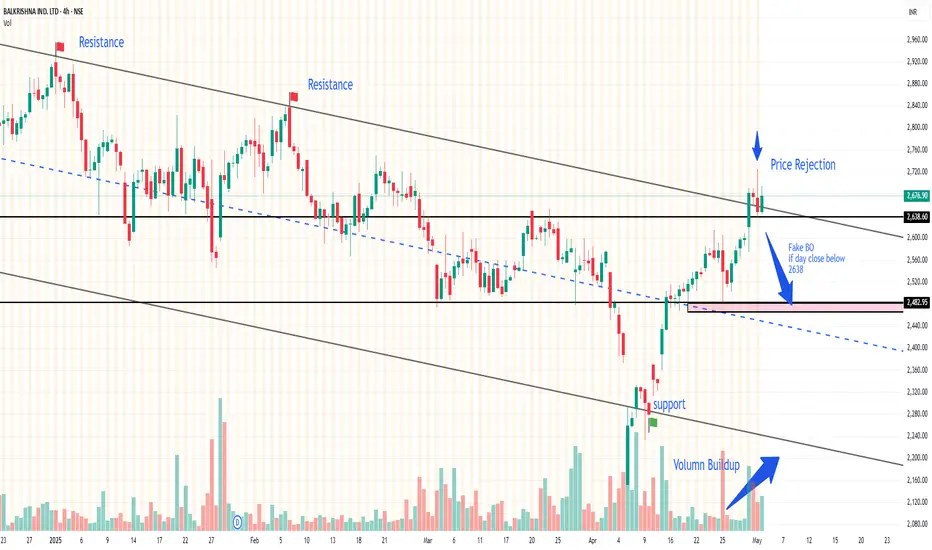
BALKRISIND case study on a possible fake BO1. Balkrisna IND made a Breakout of a long run parallel channel of 9 months (starting from 23rd sep 24)
2. Good volume buildup but there is price rejection from the top.
3. A possible case of fake BO if close below key support and channel @2638.
4. Analysis invalidated if the price in day candle close above 2724.
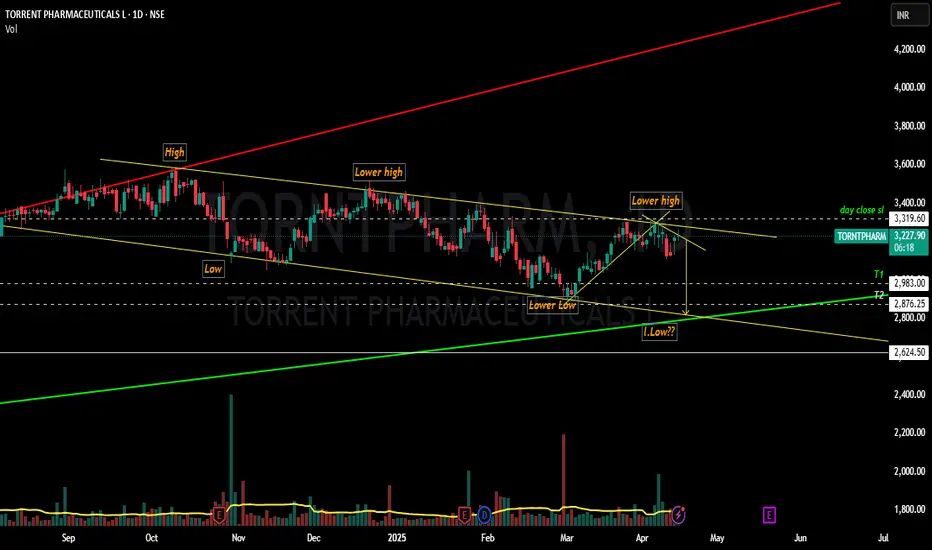
TORNTPHARM Final Bearish move before bulls entry????Yesssss!!!! Chart patterns suggest me the above titled opinion...
TORNTPHARM has been travelling in a Ascending Expanding channel pattern IN A BULLISH MODE MAKING SERIES OF HIGHER HIGHS AND HIGHER LOWS... (shown below)
Inside the bullish pattern , it is now currently in the downward phase that too inside rectangular descending channel pattern making a SERIES OF LOWER HIGHS AND LOWER LOWS....
It's moving like a written script till now....let's wait and watch whether the director(market) has any twist in the script or not!!!
This is just my opinion....not a tip nor advice!!!!
Thank you!!!!!!!
USD INRHello & welcome to this analysis
USDINR topped out on 10th Feb @ 88 to see a sharp reversal all the way till 4th April when it formed a bullish Harmonic Deep Crab pattern @ 85 that too lead to a more sharper bounce back till 9th April when it formed a bearish Harmonic Reciprocal ABCD pattern near the top end of the slanting channel.
From there we have witnessed yet another steep downward move which is currently resting at the lower end of the slanting channel. Failure to hold 84.45 - 84.35 could lead to a further downward move till 83.70 where it would attempt to form a bullish Harmonic ABCD pattern that could coincide with DXY bullish harmonic pattern near 95.
So if you have exposure to currency for any reasons whatsoever - overseas trips, college fees, business, commodities trading, etc - this might be of help to you.
Disclaimer - Not a trading advise, kindly do your study carefully before taking a decision

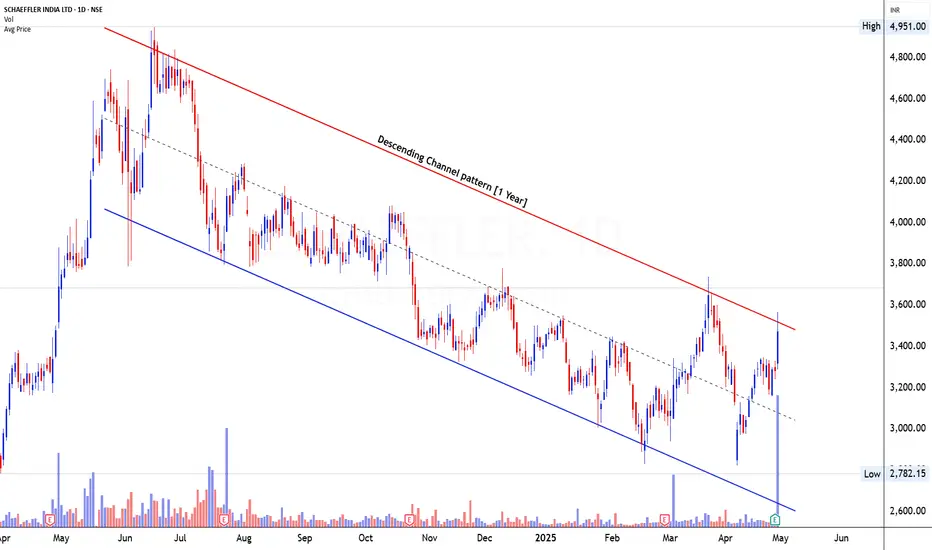
SCHAEFFLER INDIA LTD- Descending Channel Pattern1. Pattern Analysis
Schaeffler India Ltd has been consolidating within a well-defined Descending Channel Pattern over the past 1 year, with the price consistently respecting both the upper red resistance trendline and lower blue support trendline. This bearish structure indicates a clear trend of lower highs and lower lows during this period. However, the price action has recently approached the channel’s resistance zone with strong momentum, hinting at a potential breakout or reversal scenario. This 1-year channel qualifies as a tradable pattern in the Mr. Chartist methodology.
2. Volume Analysis
Volume analysis reveals a distinct shift in sentiment. After a prolonged period of low to moderate volume during declines and consolidation, the most recent sessions have witnessed a dramatic rise in volume, particularly on bullish candles. This surge in volume near the channel’s upper boundary strongly indicates accumulation and institutional participation. The large bullish candle formed with above-average volume suggests increased conviction behind the move, which is crucial for a valid breakout scenario.
3. Candlestick or Price Analysis
From a price structure standpoint, Schaeffler has formed a series of strong bullish candles leading into the current resistance zone around ₹3,500–₹3,600. The most recent candle is wide-ranged with a strong closing near the day’s high, suggesting the bulls are in control. Importantly, the move off the lower blue support trendline is sharp and directional, breaking minor internal resistances within the channel. The strength of this impulsive leg increases the likelihood of a breakout attempt through the red descending trendline, which would mark a significant trend reversal.
4. Validation of Signal
Although the breakout hasn’t yet confirmed with a close above the upper channel line, the signal is nearing validation. The sharp move upward, paired with a spike in volume and favorable candlestick behavior, aligns with early breakout characteristics. A confirmed daily close above ₹3,600, followed by bullish follow-through, would validate the breakout from the descending channel pattern. Until then, this setup should be watched closely for confirmation, especially if the price consolidates tightly below resistance before a breakout.
5. Tradable Points Determination
Entry Point Determination
A potential entry could be initiated upon a confirmed breakout above the ₹3,600 level, preferably supported by another strong bullish candle on volume. Conservative traders may wait for a retest of the breakout zone post-breakout before entering.
Target Point Determination
The height of the descending channel ranges approximately from ₹3,600 at the top to ₹2,800 at the bottom, giving us a height of ₹800. Adding this height to the breakout level of ₹3,600 gives a measured target of around ₹4,400 in the coming weeks or months if the trend sustains.
Stop Loss Placement and Trailing SL Follow-Up
A suitable stop loss could be placed below ₹3,300, near the recent swing low before the breakout leg. Once the breakout is confirmed and price sustains above ₹3,700, the SL can be moved up to the breakout point at ₹3,600. Subsequent trailing can be done by following swing lows or using the 21-day EMA as a dynamic stop.
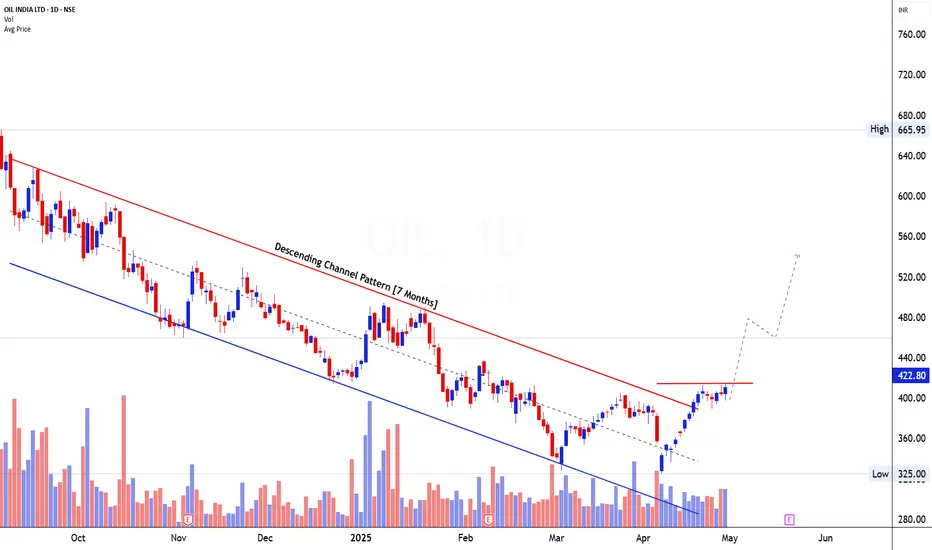
OIL INDIA LTD- Descending Channel pattern1. Pattern Analysis
Oil India Ltd has formed a Descending Channel Pattern over the last 7 months, which qualifies as a tradable setup based on Mr. Chartist’s framework. The pattern is visually clear with well-respected trendlines: the red trendline marks resistance while the blue defines support. This bearish channel has consistently contained price within lower highs and lower lows, but the recent price action shows a strong approach toward the channel’s upper boundary. A smaller horizontal resistance line also emerges just below ₹425, adding another layer of confluence for a potential breakout area.
2. Volume Analysis
Volume has shown constructive behavior in recent sessions, particularly during the rise from the lower boundary of the channel. The recent rally off the lows is accompanied by increasing volume, reflecting strong accumulation. Compared to the lower volume during the downtrend phases inside the channel, the expansion of volume on bullish candles stands out. The surge in volume at support and during breakout attempts is a positive confirmation of underlying demand and investor interest building up at these levels.
3. Candlestick/Price Analysis
The candlestick structure has evolved into a sequence of strong bullish candles as the price rebounded from near ₹325. These candles exhibit conviction, with higher closes and narrowing wicks, which suggests diminishing selling pressure. The most recent candle has approached the critical horizontal and channel resistance around ₹422–₹425. This level is psychologically important as it also aligns with the previous swing highs, forming a localized resistance zone. A breakout above this level, if accompanied by high volume and a wide-range bullish candle, would be a strong reversal signal.
4. Validation of Signal
The signal is nearing confirmation. The combination of a long-term descending channel pattern nearing the end of its structure and the clustering of resistance at ₹425 offers a textbook breakout opportunity. The price has risen rapidly from the channel’s lower support, breaking internal downtrend lines and marching toward resistance. Once price closes and sustains above the ₹425 mark with strength, this would validate the breakout from the descending channel pattern and indicate a shift from downtrend to uptrend.
5. Tradable Points Determination
Entry Point Determination
The ideal entry point would be on a confirmed breakout above ₹425, supported by volume. Traders looking for aggressive entry can consider initiating partial positions between ₹420–₹425 while watching for a strong breakout candle.
Target Point Determination
The channel’s height ranges between ₹550 and ₹325, giving a measured move target of around ₹200. Adding this to the breakout level of ₹425 gives a price target near ₹625, which also aligns with prior price memory zones.
Stop Loss Placement and Trailing SL Follow-Up
A logical stop loss can be placed below the recent swing low at ₹385. Once the breakout is confirmed and price sustains above ₹450, the SL can be trailed to ₹425 (breakout level). Further trailing can follow swing lows as the stock progresses higher toward the ₹500 and ₹600 zones, protecting profits while remaining in the trend.
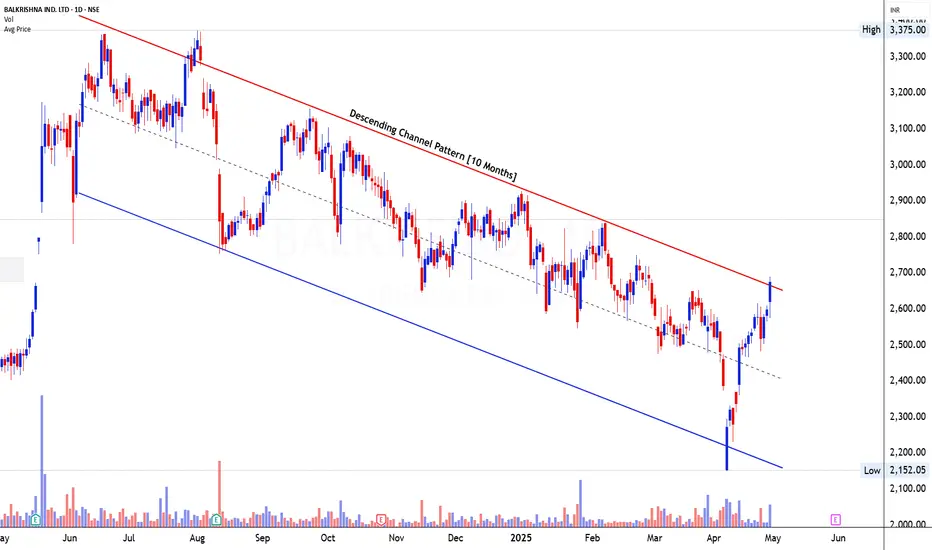
BALKRISHNA INDUSTRIES LTD – Descending Channel Pattern
1. Pattern Analysis
The price structure has developed a Descending Channel Pattern over a span of 10 months, making it a tradable and valid setup as per Mr. Chartist's methodology. The pattern is defined by a sequence of lower highs and lower lows, bounded by clearly marked red resistance and blue support trendlines. The price is currently hovering very close to the upper resistance of this descending channel, indicating an attempt at a breakout. Given that descending channels are typically considered bullish reversal formations when price action breaches the upper trendline, this chart now sits at a critical juncture.
2. Volume Analysis
The volume dynamics offer strong evidence of accumulation, particularly in the recent phase where the price surged from the lower end of the channel toward resistance. There has been a notable increase in volume during the most recent upswing, especially as the price approached the upper trendline. This suggests the presence of institutional buying or smart money entering the stock at lower levels. The previous downswings were characterized by muted volume, while the upswings are supported with rising participation — a classic bullish divergence in volume behavior.
3. Candlestick Analysis
Recent price action has been marked by bullish candles with expanding bodies and strong closes near the day’s highs. This aggressive price movement toward the channel resistance, backed by rising volume, reinforces the bullish undertone. In particular, the bullish momentum off the lower support (around ₹2,150) to the current level suggests a shift in sentiment from supply dominance to demand. However, the current candle sitting just at the resistance line is crucial — a strong breakout with a wide-range candle closing above ₹2,700 would confirm a pattern breakout and trend reversal.
4. Validation of Signal
The bullish setup is nearly validated but not fully confirmed yet. The descending channel pattern’s resistance has been tested but not conclusively broken. The stock is showing strength as it challenges this upper boundary with both price action and volume signaling intent. If the price can sustain above the channel with follow-up buying pressure, it would mark a valid breakout. Until then, the breakout anticipation remains strong but requires confirmation on a closing basis. The risk/reward remains favorable, given the proximity to breakout level and supportive buying volumes.
5. Tradable Points Determination
Entry Point Determination
A clean and confirmed entry will be on a breakout above ₹2,700 with strong bullish follow-through. Traders may also consider a pre-breakout entry between ₹2,660–₹2,690 with a tight stop, expecting a breakout in the next few sessions.
Target Point Determination
Based on the height of the descending channel (roughly ₹600), the measured move target after breakout would project toward ₹3,250–₹3,300, aligning well with previous consolidation zones from early 2024.
Stop Loss Placement and Trailing SL Follow-Up
For initial risk control, a stop loss can be placed below the most recent swing low at ₹2,500. Upon breakout confirmation, this can be trailed to the breakout zone (around ₹2,700). As the stock moves past ₹2,900, further trailing can be done using higher swing lows on the daily chart to lock in gains while allowing trend continuity.
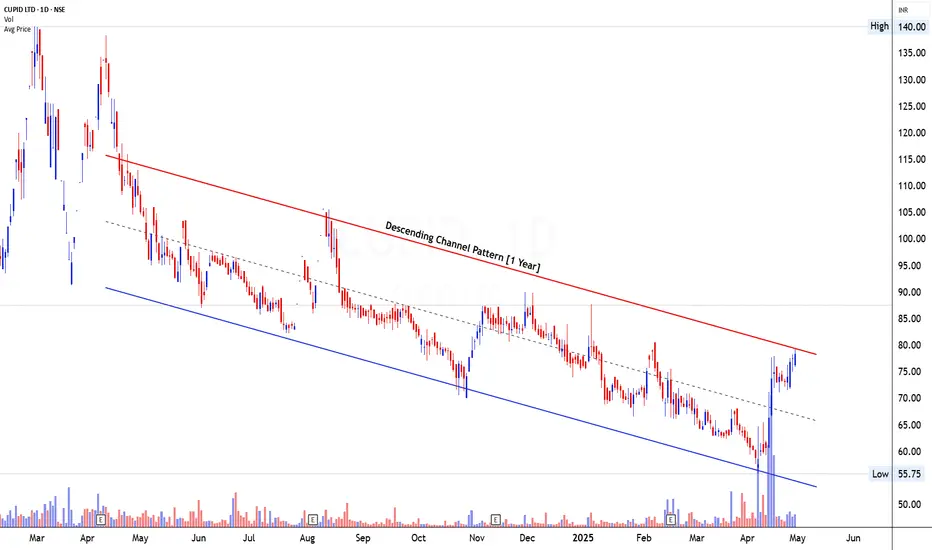
CUPID LTD – Descending Channel Pattern
1. Pattern Analysis
CUPID Ltd has been trading within a well-defined Descending Channel Pattern for the past 1 year, marked by a consistent sequence of lower highs and lower lows. The pattern is bounded by a red resistance line at the top and a blue support line at the bottom, reflecting a controlled downtrend. This descending channel reflects a classic corrective phase after a prior sharp fall, allowing the stock to gradually stabilize its structure. As of the latest price action, CUPID is testing the upper boundary of this descending channel, suggesting a potential breakout attempt. While a clean breakout hasn’t yet been confirmed, the approach toward this resistance zone after a strong move from the lower boundary increases the probability of bullish continuation. The channel structure remains valid and offers a clear risk-to-reward framework for traders anticipating a breakout.
2. Volume Analysis
Volume behavior in CUPID has undergone a significant shift in recent sessions. During the earlier phases of the downtrend, volume remained muted and largely unconvincing on both up and down days, confirming the overall weakness. However, in the most recent up move, particularly the rally from ₹56 to ₹78, there has been a noticeable surge in volume, pointing toward renewed buying interest. Notably, the bars representing this advance have coincided with volume expansion, which is often an early indicator of accumulation. This surge hints at the presence of institutional or smart money entering the counter at lower levels. Additionally, the volume spike near the lower blue channel support suggests buyers stepping in strongly at value zones, further lending strength to the ongoing bullish momentum.
3. Candlestick Analysis / Price Analysis
The price action in CUPID has shifted to a bullish tone, especially since bouncing off the lower boundary of the channel. Over the past few weeks, the stock has formed a series of higher lows, and the recent candles are characterized by strong bodies with minimal upper wicks—indicative of decisive bullish control. The move from the ₹56–₹58 zone to ₹78 has been quick and with conviction. These price formations near the channel resistance convey an intent to break out rather than reject the level, which makes the ongoing structure even more interesting. The absence of strong bearish reversal candles and the steady upward grind suggest that sellers are gradually losing control. Additionally, the recent price bars have consistently closed near their intraday highs, signaling aggressive buying during market sessions.
4. Validation of Signal
Although the price has not yet cleanly broken out of the descending channel, the convergence of volume, price behavior, and structure validates a bullish setup in progress. The current structure hints that CUPID is building strength for a breakout. The key validation will occur once the price closes above ₹80–₹82 with strong volume, confirming that supply has been absorbed. Until then, the setup can be considered a pre-breakout accumulation stage with bullish bias. The stock has not shown signs of exhaustion or long-wick candles that would indicate rejection, reinforcing the expectation of further upside. A breakout from such a long-standing descending channel would signal a major reversal, potentially changing the trend from bearish to bullish for the medium term.
5. Tradable Points Determination
Entry Point Determination
An ideal entry can be considered near the current levels around ₹76–₹78, with confirmation to add aggressively above ₹82 once a breakout candle closes strongly. Traders willing to anticipate the breakout may initiate positions with tighter risk management.
Target Point Determination
The height of the descending channel is approximately ₹35–₹40, ranging from the lower boundary (₹55) to the upper resistance (₹90). On a successful breakout above ₹82, we can expect the following targets:
Target 1: ₹95 (near-term resistance)
Target 2: ₹105–₹110 (measured move projection)
Target 3: ₹120+ (extended rally potential)
Stop Loss Placement and Trailing SL Follow-Up
A logical stop loss should be placed just below the recent swing low at ₹70 to protect against failed breakout attempts.
For trailing:
Move SL to ₹75 once price crosses ₹90
Move SL to ₹85 once price crosses ₹100
Lock profits at ₹95+ and trail for ₹110 or beyond
This trailing approach ensures protection of profits while participating in potential long-term reversal.
Bearish Setup in Gold: Breakdown Confirmed with Strong Volume!Hey, what's up Traders! I’ve been watching Gold closely, and it seems like we’re seeing a descending channel setup. After hitting the top, it’s now testing the lower boundary. If Gold can't hold this support level, we could see a nice downward move. The entry range I’m eyeing is around 3275-3295 , with a stop loss just above at 3239 .
1st target : 3209
2nd target : 3160
Final target : 3120
The volume behind this move suggests we might see more selling pressure. If Gold breaks through the lower trendline, the downside move could gather more momentum. As always, let’s manage risk carefully, stay sharp, and watch the price action closely!
Disclaimer: This analysis is for educational purposes only. Please consult a financial advisor before making investment decisions.
If you found this helpful? Don’t forget to like, share, and drop your thoughts in the comments below.

Nifty at Crucial Juncture. 22670 To Watch For!Nifty has shown some resilience despite Global Fallout following Tariff War.
Scenario B had been in the Play until Friday.
However The Retaliation from China led to Historical Correction in Global Market.
Considering above Change in Global Sentiment, Our Approch needs some reconsideration.
With Scenario C likely to come into play with Big Gap down suggested by Gifty, let's have a look at Crucial Level that is 22670.
Whether Nifty sustains and Closes the coming Week above it or Below it could decide which Scenario plays out
Scenario A - Nifty doesn't break the Low made at 22000 and closes above 22670. This could lead to further upside testing 24750 25000 Zone.
Scenario B - Nifty falls out of the Green Parallel Channel closing below 22670. This could lead to further downside testing 21300 Zone.
However in either scenario Chances of Downfall Continuation looks less likely given the Weakness Suggested by The Divergence in RSI
And Nifty trading near Demand Zone.
We Need a decent Pullback before further Greater Downfall..
Which Scenario do you think will be in Play this week?
We will be on sidelines next week unless Nifty takes Support at 22670 Zone or tests 21300 Zone.
🤞

Breakout Vinati Organics Ltd. (Daily Timeframe)Downtrend channel since August 2024.
Well-established descending channel broken decisively on the upside. Breakout from the downward parallel channel, signaling potential trend reversal.
Price closed above both the upper trendline and horizontal resistance (around ₹1,690–₹1,700).
Immediate Resistance 1,690–1,700 is Broken, Next Resistance can be 2,309.
Stock breakouts 1,690 resistance, now this resistance turned into support.
Breakout Entry: Around 1,700–1,729 (current levels suitable for momentum buyers)
Retest Entry: Ideal entry on pullback to 1,690 if price retests breakout zone SL: Below 1,650
Wait for a daily close above 1,730 for confirmation if entering late.

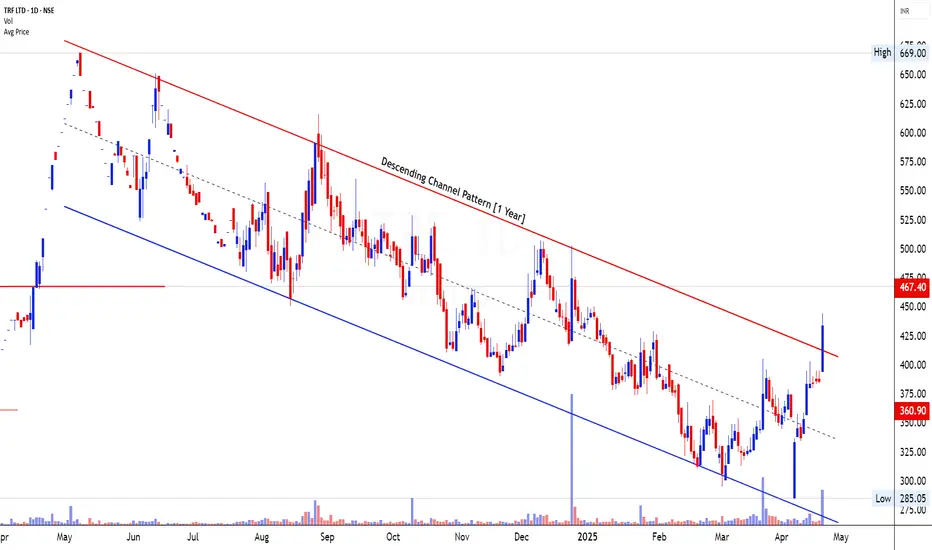
TRF Ltd- Descending Channel Pattern BreakoutWeekly Chart-
1. Pattern Analysis
TRF LTD currently showcases a powerful confluence of three distinct bullish patterns across varying timeframes, making the setup especially notable. On the monthly chart, we identify a Rounding Bottom pattern spanning an impressive 13 years. This rare and robust pattern has finally transitioned into the breakout phase, confirming a long-term structural reversal from its historic lows. The neckline breakout occurred above the ₹360 level, with the next major resistance seen around ₹467.
Simultaneously, the weekly chart illustrates a strong recovery from the ₹360 support zone, a level that has held significance for over a year. The price has now started reclaiming higher levels with renewed momentum. Adding to this setup, the daily chart reveals a Descending Channel breakout, a pattern that spanned nearly a year. Price has decisively broken above the upper trendline of the descending channel, completing a short-term reversal within a broader long-term bullish context.
Together, these patterns highlight a strong reversal narrative, where long-term and short-term structures are aligned, increasing the reliability of the bullish signal.
2. Volume Analysis
Volume behavior is a critical supporting indicator in this setup. On the monthly timeframe, we’ve observed volume expansion during the breakout phase of the 13-year Rounding Bottom. Such elevated volumes indicate strong accumulation by institutional players, likely building long-term positions.
The weekly volume remains significantly above average, particularly in the last two candles, as the stock pushed above the ₹360 level. This supports the idea that the bounce is not random but backed by genuine buying interest.
On the daily chart, the breakout from the Descending Channel was marked by a surge in volume, creating a classic volume-price breakout pattern. This alignment of increasing volume with breakout points across all timeframes signals strong conviction behind the price move and validates the breakout quality.
3. Candlestick / Price Analysis
The price action on the daily chart has turned highly constructive. A sequence of strong bullish candles with wide ranges and strong closes confirms intraday demand dominance. The candle on the breakout day from the channel is particularly notable, closing near the day’s high with a wide range, forming a bullish marubozu pattern—often a signature of trend change.
The weekly chart reflects a clean reversal with the current candle engulfing previous minor resistances and forming a powerful bullish candle. The shift in sentiment is visible through successive higher lows and higher highs over the past few weeks.
On the monthly chart, the structure confirms the end of a multi-year base-building phase, with the current candle showing strong follow-through after a confirmed breakout. The price is well above the 10-month average and is now targeting prior highs with limited resistance in the near zone.
4. Validation of Signal
All three timeframes – monthly, weekly, and daily – are currently aligned in favor of a bullish reversal. The monthly rounding bottom breakout is validated with both volume expansion and price follow-through. The weekly chart confirms a successful retest of the ₹360 level, and the daily breakout from the descending channel adds momentum and timing for potential swing and positional entries.
Moreover, price is now hovering close to the ₹433 level, just shy of the major monthly resistance at ₹467. A sustained move above ₹467 would likely open doors to higher targets based on the full projection of the rounding bottom base.
Thus, we have a multi-timeframe breakout confirmation that strengthens the bullish signal and reduces the probability of a failed breakout.
5. Tradable Points Determination
Entry Point Determination
Traders may look for an entry around the current price near ₹430–₹435. Given the recent breakout and strong bullish structure, any small dip or consolidation near this level would offer a low-risk entry setup. For those waiting for confirmation, a breakout above ₹467 will act as a further entry trigger.
Target Point Determination
Based on the rounding bottom base width and prior high projections:
Target 1: ₹525 – a near-term swing target based on channel height from the daily pattern.
Target 2: ₹600 – medium-term target from the breakout of the descending channel and historical supply zones.
Target 3: ₹700+ – long-term target derived from the height of the Rounding Bottom base, projected from the ₹360 neckline breakout level.
Stop Loss Placement and Trailing SL Follow-up
An initial stop loss can be placed below ₹385, just under the breakout zone and recent swing low. For positional trades based on the monthly structure, a wider stop near ₹360 may be considered to accommodate volatility.
Once price sustains above ₹467, traders should consider trailing the stop loss higher—perhaps to ₹420 initially and then to ₹467 as price nears ₹525. This trailing approach helps secure profits while staying in the trend.Mo
BANKNIFTY Descending Channel Breakout Alert – Targeting 57450+The chart displays a descending channel breakout in the Bank Nifty Index on the daily timeframe. After months of consolidation between a downward sloping resistance and support trendline, a strong breakout has been observed.
🔺 Resistance Zone (Red Channel)
Multiple rejections along the red downward sloping trendline marked as Resistance.
The breakout candle has successfully closed above this zone, confirming a bullish breakout.
🔻 Support Zone (Green Channel)
Historically strong buying zones identified at the green support trendline.
Each dip toward this line was followed by a bullish move.
📈 Breakout Confirmation
The price has broken out of the resistance channel, and the breakout zone is highlighted with a black circle.
The pattern height is used to estimate potential upside targets post-breakout.
🎯 Target Levels Post-Breakout
Initial Target: 53,950+
Next Target: 55,450+
Projected Final Target: 57,450+
(Calculated by adding the pattern height to the breakout level)
🛑 Stop Loss Strategy
A strict stop loss is placed below 51,450, to manage risk in case the breakout fails.

Britannia Sustains Strength in Upward ChannelTopic Statement:
Britannia is maintaining its upward momentum as the stock continues to trade within a bullish up-trending channel.
Key Points:
- Price is moving in an up-trending channel, making it suitable for channel-based trading strategies.
- The stock recently retraced to the 38.2% Fibonacci level at 4800 and received strong buying support at that level.
- The 180-day EMA acts as a strong support zone for the stock.
