Hidden Parallel Channel: Weighted Lines & Zones ExposedThis chart illustrates key technical elements where price interacts with multiple reference lines and zones, emphasizing their observed relevance based on proximity and historical behavior.
The red counter trend line, distant from price by 35-40%, carries less immediate weight, while the white counter trend line touched by price demonstrates stronger participation. Green highlights a long-term weekly demand zone from historical levels, and the white zone on daily timeframe marks a prior gap down with resistance reaction.
Parallel dotted white lines outline a hidden channel, repeatedly respected and rejected by price, underscoring its structural significance. These elements combine multi-timeframe context to showcase how markets organize around dynamic references rather than static predictions.
Motto is to showcase how one can create setup from any or all of the above ingredients, its all about perspective and how you approach and backtest in markets - experience is importnat - field experience in trading is scrolling Trading view and keep backtesting .
Disclaimer: This is purely educational content on price action, zones, and patterns. Not SEBI-registered advice. Charts use historical data >3 months old; NO forecasts, NO buy/sell recommendations, or guarantees of results. DYOR and consult professionals.
Parallelchannels

Decoding Weekly Structure: Support, Resistance & Channel DynamicSummary -
This multi-window TradingView chart showcases a weekly time frame on the left, featuring a white counter line, a dotted hidden resistance line, and a monthly support/resistance zone highlighted in white on the right. Additionally, a pink parallel channel marks head and resistance zones, offering a visual guide to price structure without forecasting future movement. Each element helps identify historical areas where price has shown significant reactions.
Terms and Language explained -
Counter Line (White): A horizontal line used to mark a specific price level, often for tracking key reference points or psychological levels.
Hidden Resistance (Dotted Line): A resistance line that is not immediately obvious but is derived from less visible price action or volume analysis. It helps identify potential areas where price may struggle to move higher.
Monthly Support/Resistance Zone: A broader area on the chart where price has historically found support (demand) or resistance (supply) over the monthly time frame. These zones are often marked for their significance in longer-term analysis
Parallel Channel: A set of parallel lines drawn to connect consecutive highs and lows, forming a channel that helps visualize the current price trend and boundaries.
Disclaimer
The information presented in this chart is for educational purposes only. No part of this post constitutes financial advice, a recommendation, or a forecast of future price movement. Always conduct your own research and consult a qualified financial advisor before making any trading decisions.

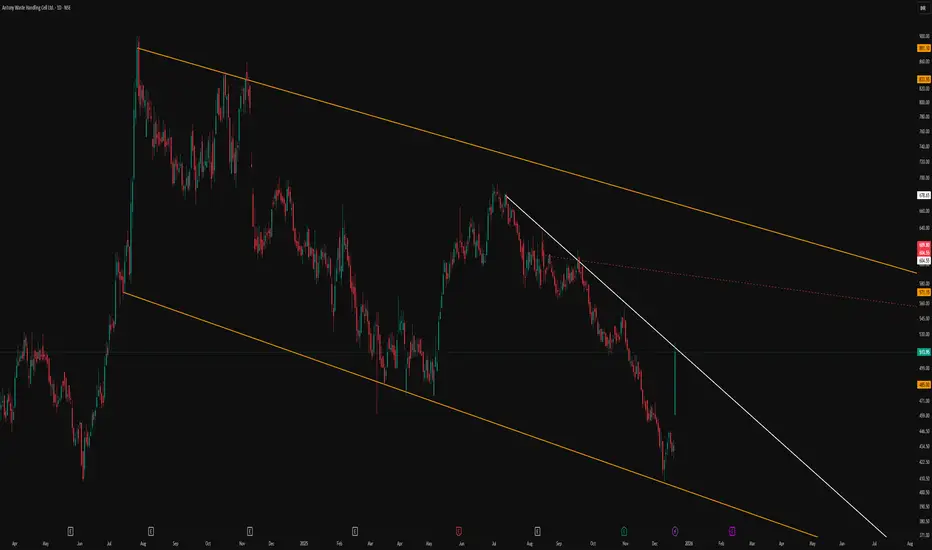
Classic Descending Channel With Clear Structural LevelsThe primary feature of this chart is the broad descending parallel channel marked by the orange lines, which frames the entire corrective phase in a neat, orderly manner. Price has repeatedly respected both the upper and lower boundaries, reinforcing the relevance of this channel as a dominant structure.
A trend‑changing resistance line is drawn in white, connecting swing highs and visually separating the prevailing downtrend from any potential shift in behavior. This line serves as a clear reference for how price has reacted to supply zones within the channel, without implying any future breakout or directional bias.
The red dotted line acts as an internal, hidden line derived from prior price interaction, helping to map out the internal rhythm of the move. Overall, the chart is intended purely as a structural illustration of how price respects channels and internal reference lines, without any forecast or trade signal.
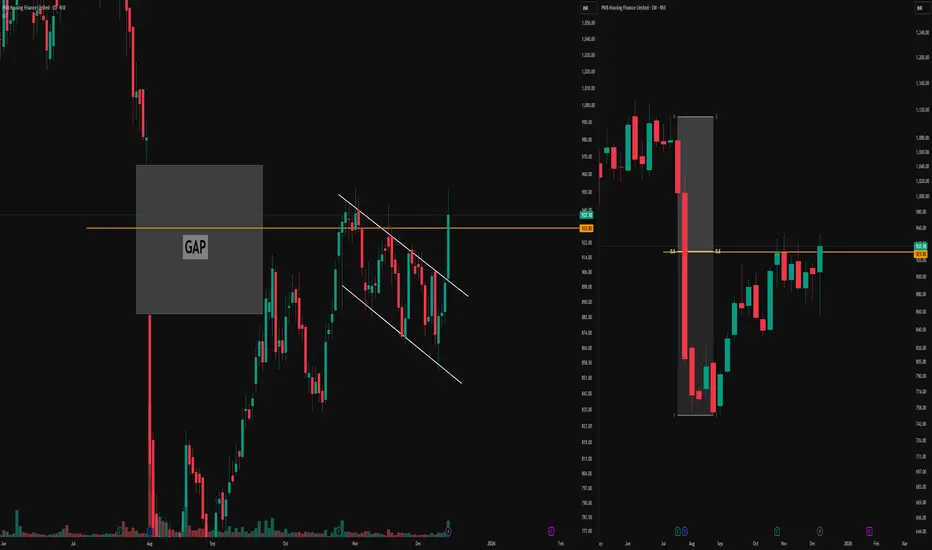
Parallel Channel, Stubborn Gap & 0.5 Equilibrium RejectionDaily Timeframe Details
The left chart on the daily timeframe displays a parallel channel structure forming after an initial one-sided move.
A significant gap emerged within this leg, which price has approached multiple times—first entering the gap area from below but rejecting sharply to form a higher low, then pushing toward a higher high without fully filling it.
This illustrates how gaps often resist easy fills from either direction, acting as persistent reference zones that demand confluence for interaction.
Weekly Timeframe Context
The right chart provides the weekly timeframe for the same instrument, highlighting repeated rejections at the 0.5 equilibrium level.
These weekly rejections align precisely with the daily gap interactions and channel boundaries, demonstrating how higher-timeframe equilibrium can underpin lower-timeframe price behavior without implying direction.
Such multi-timeframe alignment offers educational insight into structural references in market analysis.
This post serves purely educational and observational purposes and does not constitute buy, sell, or investment advice. Always conduct your own research.
Seeing vs Believing: Multi-Pattern Structure vs Single-Line BOOn the left, the weekly chart is mapped as a full A+ type setup, where multiple structural elements work together instead of relying on a single, convenient line.
-A red counter trendline marks a series of lower-high rejection points, visually defining the “least liquidity” supply line that price has repeatedly respected.
-A dotted parallel channel outlines a broader multi-pattern context.
-A dashed hidden line adds another layer of structure, hinting at less obvious inflection zones that are not visible at first glance but often align with prior reactions.
-Finally, an orange line represents a higher time frame resistance level, bringing in a top-down perspective so that the current weekly price action is seen in relation to a dominant, bigger-picture barrier.
On the right, by contrast, the chart is reduced to a single white line drawn in a way that “forces” the candles to appear as if they are breaking out.
This is a great example of chart psychology in action: instead of objectively mapping all relevant patterns, many traders draw what they want to see—one clean breakout line—ignoring hidden structures, multi-timeframe confluence, and complex pattern overlap.
The intention of this post is purely observational and educational, not forecasting.
It aims to show how a professional, multi-pattern approach (CT lines, channels, hidden lines, and higher timeframe levels) can radically change the way a chart is interpreted compared to the simplistic, single-line breakout mindset that dominates retail thinking.
Disclaimer: This post is for educational and illustrative purposes only and does not constitute investment, trading, or financial advice. Always do your own research and consult a registered financial professional before making any trading decisions.

Tight Bullish Coil Above 50% EQ Means what ? Points to be Noted :
-Clear monthly swing low and swing high marked, defining the impulsive leg and its equilibrium zone. ( S1 and S2 )
-Price is consolidating in the upper half of this leg, holding above the 0.5 equilibrium level, showing sustained strength in the higher value area. ( also know as EQ )
-A clean ascending trendline (green) is guiding price from the swing low, with candles respecting it as dynamic support during the pause.
-Within this broader bullish structure, price has formed a tight parallel channel consolidation, indicating controlled pullback rather than distribution. ( white lines marked )
-Nearest major supply aligns with the all-time high, and the highlighted supply box marks the key decision zone where breakout or rejection is most likely.( orange box )
This post is for educational purposes only and is not investment, trading, or financial advice. Always do your own research, assess your risk tolerance, and consult a qualified financial advisor before making any trading decisions.

How Counter Trendlines and Parallel Channels Reveal Price StructThe CT (Counter Trendline) as the prime technical feature. The red CT line distinctly marks recurring lower high rejections, shaping significant supply pockets and creating low-liquidity price zones at every inflection point.
Each touch validates the CT’s relevance, highlighting how price is repeatedly capped at these lower highs before reversing downward.
Overlaying this, a hidden parallel channel (dotted white lines) frames the swing movement. The channel not only encapsulates price but also serves as a running test of trend strength: each upper boundary touch confirms resistance, while bottoms act as support.
Notably, more hits at the upper parallel line than the base typically signal rising underlying bullish energy, especially when accompanied by the green trendline’s upward momentum.
No breakout, no prediction—just objective structure. The parallel channel and trendlines, when mapped carefully, elevate clarity on price balancers, guidance zones, and the ongoing duel between support and rejection.
Observe how these formations reveal crowd psychology and liquidity placement without forcing a directional view.
NiftyPvtBankThe private bank index, currently around 28,427, has been steadily rising since June 2024.
The stocks accumulated by big players last year are now witnessing strong follow-up buying in 2025.
The trend clearly points toward a potential move to the 29,800–31,100 zone.
Bulls need to defend the 27,300 level — any mild retracement toward this area could offer a good opportunity to add near the stop-loss.

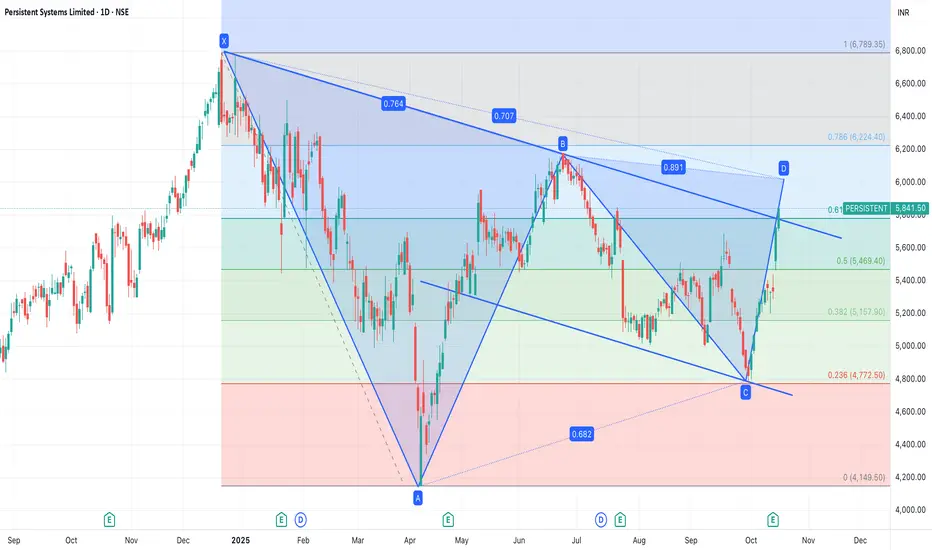
Persistent Systems Breakout parallel channelPersistant system has given a breakout and now I think it is ready to break its 52 week high. It will cross 6800-7000 is possible.
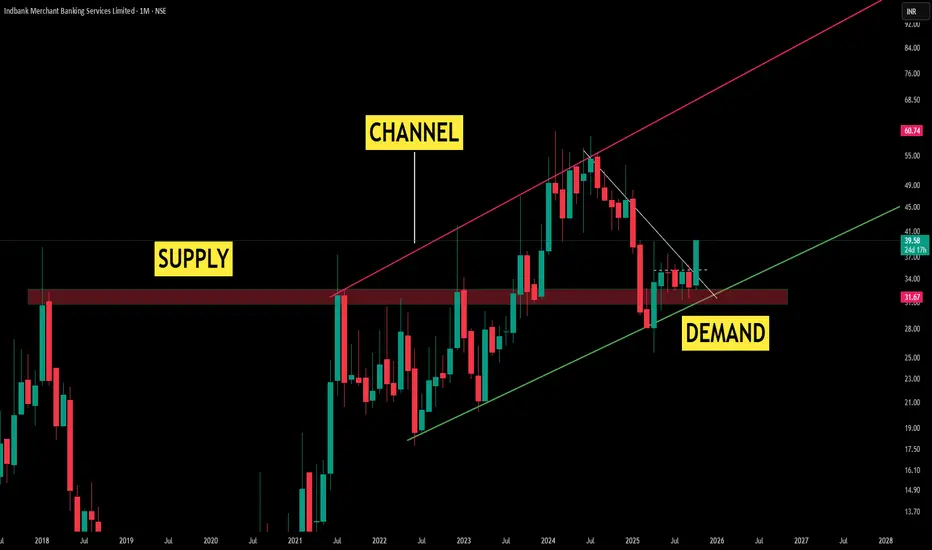
Monthly Market Regime: Supply-to-Demand Shift Framed by ParallelTheme 1: Regime Shift
A prior supply pocket has matured into a demand base as monthly closes repeatedly sustained above the zone
Theme 2: Channel Governance
A clean, supportive parallel channel has developed; price has been guided by its rails, offering objective context for expansion and contraction phases on the higher timeframe
Theme 3: Higher Highs, Higher Lows
Successive higher highs align with the channel’s upper boundary acting as dynamic headwinds, while higher lows respect the supportive green line, preserving trend health.
Theme 4: Counter Trendline (CT)
The white CT outlines the corrective path within the advance, visually separating pullback structure from primary momentum
Disclaimer: Technical analysis provides probability-based insights. Always implement proper risk management and consider multiple timeframe confirmations before executing trades.
NiftyITNifty IT | CMP: 33,702
The index made its all-time high (ATH) in December 2024 and has since been in a structural decline. After hitting a low in April 2025, it has been moving within a parallel channel, testing the upper boundary in June 2025.
Support Zone 1 (31,230–30,575):
This level has repeatedly acted as both supply and demand. It provided resistance in Nov 2022 and Feb 2023, later turning into strong support in Oct 2023, June 2024, and Apr 2025 . A retest of this zone cannot be ruled out, but if it fails to hold, the price may drift lower towards the next critical zone.
Support Zone 2 (26,399–25,499):
This is the most significant demand area, created largely during the consolidation phase between Jan–May 2021, and reinforced in Jun/Jul 2022, Sept 2022, and Apr 2023 . Post this accumulation, the index witnessed a sharp rally to its last ATH.
These two zones together formed a broad rectangular base between Jun 2021 – Aug 2023 , which provided strong momentum to the bulls.
The period from Mar 2020 – Jan 2022 was exceptional for the bulls, driving prices far ahead of valuations. While this resulted in the ATH, the subsequent correction was inevitable as disparity levels stretched excessively. The ongoing correction is essentially a healthy cooling-off phase before the next sustainable move.
That said, this entire consolidation and corrective cycle may still take another 1–2 years to fully play out.

DKPast 6 year it has consolidated very well.
Earlier in Jun '22, Dec '22 and Apr '24 it tried to cross the level of 33 however failed to do so.
Today's move looks like a clear Breakout and now it may try to test the upper edge of the channel.
Risk is very deep at 22, Therefore any shakeout later may be good idea to add more.
Hold for 2 year

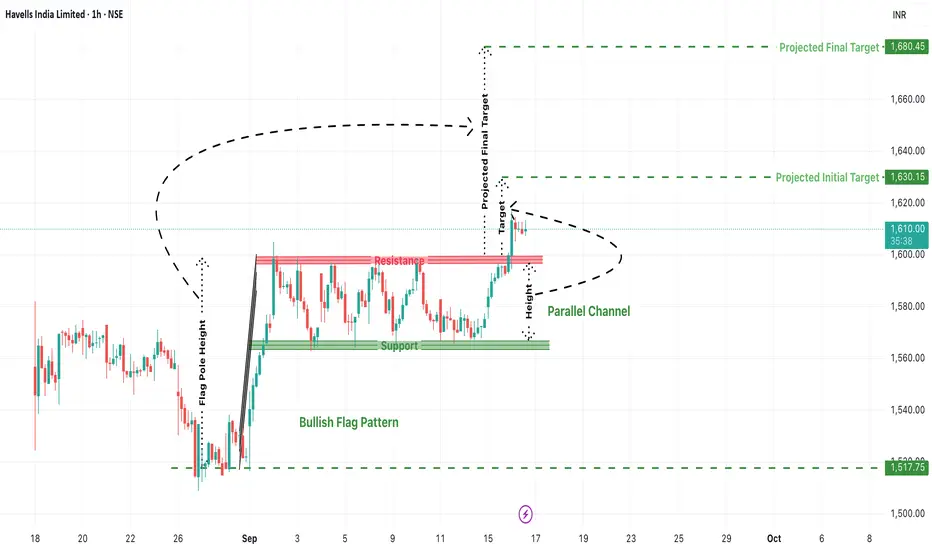
Havells Bullish Flag Breakout: Can We See a Rally to 1680+?Havells India Ltd. is currently showing a classic bullish technical setup—a Bullish Flag Pattern—that could lead to a potential breakout and strong upside movement in the short term. Traders who favor breakout-based strategies should pay close attention to this chart, especially considering the structured parallel channel and previous rally that preceded it.
1. Bullish Flag Pattern: Anatomy of the Setup
A bull flag is a continuation pattern that occurs after a sharp price rise (flagpole), followed by a period of consolidation within a narrow parallel channel (the flag). This structure typically suggests that the bullish trend will resume once the price breaks out of the flag range.
In Havells:
Flag Pole: The stock surged sharply from the 1517 zone to near 1610, forming a vertical rise.
Flag/Channel: Price moved sideways within a narrow support at ~1570 and resistance at ~1610, creating a clean parallel channel.
This shows price compression after a strong move, typically a sign of healthy consolidation before another leg up.
2. Breakout Levels and Price Action Confirmation
As per the current chart:
Havells has broken above the resistance zone around 1610, signaling a potential breakout.
The breakout candle is attempting to close above the red resistance band, and follow-up candles will be crucial to confirm strength.
A retest of this breakout zone could offer ideal long entries.
3. Projected Targets from the Pattern
Using the flagpole height, we can project upside targets from the breakout point:
Initial Target: ₹1630.15
A conservative target based on minor resistance and pole extension.
Final Projected Target: ₹1680.45
This marks the full measured move and could be achieved if the rally sustains momentum.
4. Ideal Trading Plan (For Traders)
Entry:
After confirmed breakout above ₹1610
Or on retest near ₹1600–1610 zone with bullish price action.
Stop Loss:
Below the flag support zone at around ₹1570
Aggressive traders can keep it below ₹1585.
Targets:
T1: ₹1630
T2: ₹1680+
Risk-Reward Ratio:
Minimum 1:2 depending on entry price.
5. Risk Scenarios to Watch For
False Breakouts: If the breakout doesn’t sustain and price falls back into the channel, it may trap early longs.
Macro Events: Broader market volatility (Nifty moves or global cues) can impact momentum.
Volume: Lack of volume on breakout candles can reduce conviction—always monitor volume to confirm strength.
Conclusion: Havells Looks Set for a Fresh Rally
This is a textbook bullish flag breakout in formation, with clear upside potential. If the momentum sustains, Havells could very well reach 1680+ in the coming sessions. However, traders must practice disciplined risk management, wait for confirmation, and avoid chasing without a proper plan.
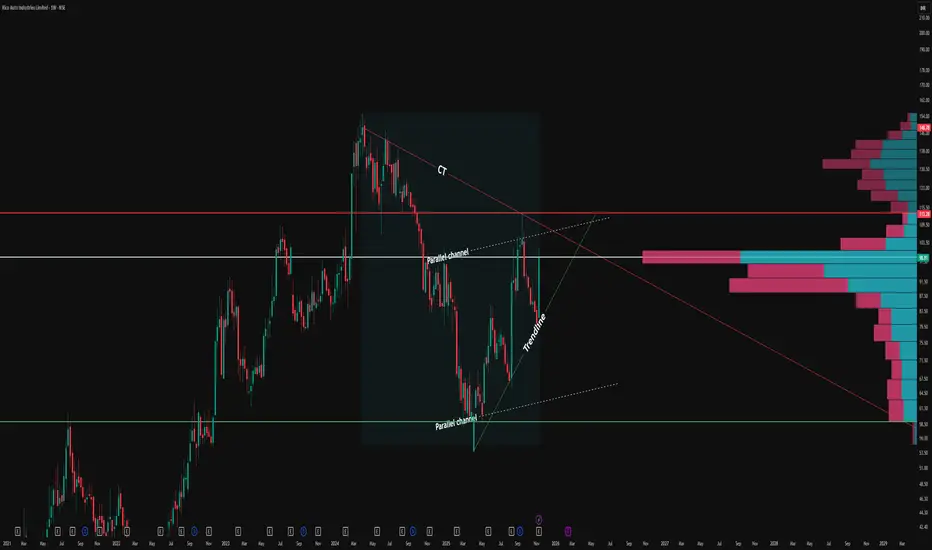
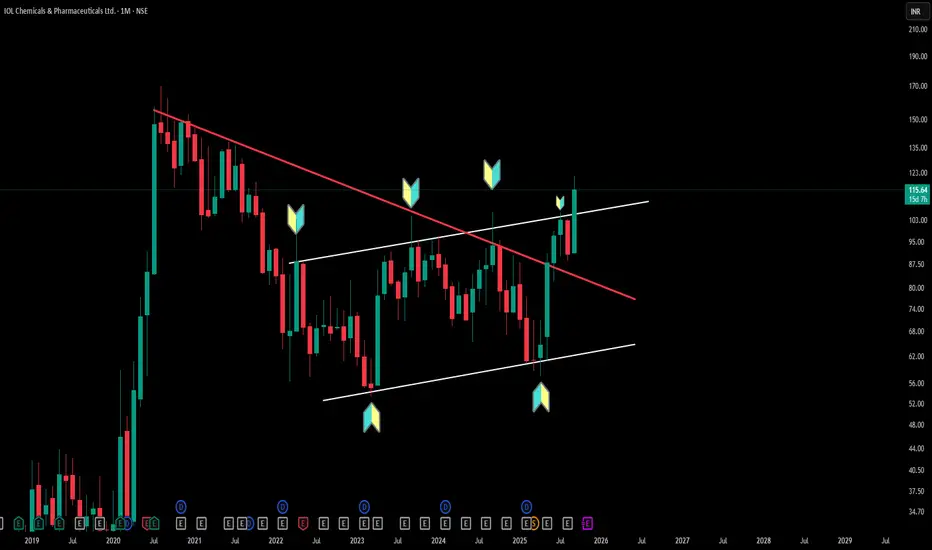
Multi-Pattern Insights: Triangle & Channel Structures (Timeframe: Monthly)
IOLCP's monthly chart perfectly demonstrates how triangle patterns (converging trendlines creating compression) can coexist with parallel channel patterns (equidistant support/resistance lines). Triangle formations indicate price consolidation with diminishing volatility, while parallel channels show consistent bounce zones between defined boundaries.
This multi-timeframe view reveals how experienced chartists identify multiple technical structures within a single timeframe—enhancing pattern recognition skills. Understanding these foundational concepts helps distinguish between different consolidation types and their structural characteristics.
Disclaimer: This analysis is for educational purposes only and does not constitute investment advice. Always conduct your own research before making any trading decisions.
OlectraThis is bullish parallel channel formation breakout on the upper edge. Though weekly/monthly closing above the supply area 1530-1460 is very important here. However the recent move above 1350-1270 gave good strength to the bulls.
Consider it with time frame of 1.5 yr-2 yrs and stop loss 1280
2000 looks promising in next 6 months

UNHUNH has been forming parallel channel since 2016. Also it has a bigger Parallel channel on large time frame as well. which means it is making large time up move after consolidation.

GODFRYPHLPthough it took complete 25 year but parallel channel completion truly gives satisfaction.
This journey has been really great when I added at 1200 in 2019.
Though I don't have any tgt left but money has given 350% absolute return

CocaColaDid the big hand selling the coca-cola stock at this point of time.
Though it's very difficult to identify the next move however this is just a try to find the distribution in price

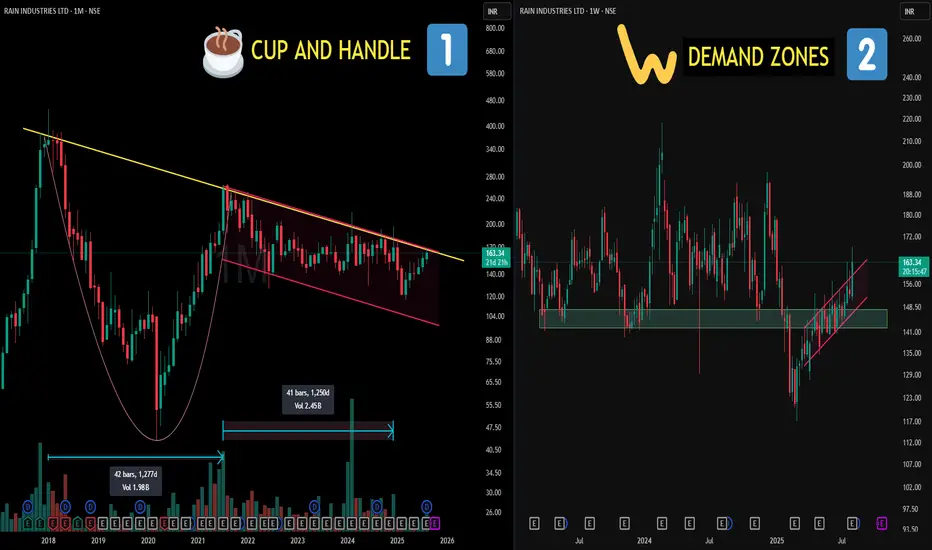
2500 Days of Structure? CUP & HANDLE Decoded!📌Left Side (Chart 1: Monthly TF)
🧠 Cup and Handle Pattern:
A bullish continuation pattern that resembles the shape of a tea cup on longer timeframes. The “cup” shows a gradual rounded bottom (accumulation phase), followed by a smaller downward or sideways "handle" (last shakeout), often before strength resumes. It reflects long-term accumulation and investor confidence.
📈 Cup Duration in this case : 1277 days (approx. 3.5 years)
🧠Parallel Channel (Handle):
A price structure where two trendlines contain price movement within a defined up or down slope. Often marks controlled consolidation or correction — neither side is dominating, until one breaks.
📈 Handle Formation in this case : 1250 days (approx. 3.4 years)
📌 Right Side (Chart 2: Weekly TF)
🧠 This is the zoom lens on the handle zone:
📍A key Demand Zone was breached temporarily… but reclaimed with conviction.
📍 Strong re-acceptance and consolidation followed, showing organized price behavior.
📍 The upper trendline of the parallel channel is where price recently pushed through — again, no forecasting — just a structural breakout from a well-defined zone.
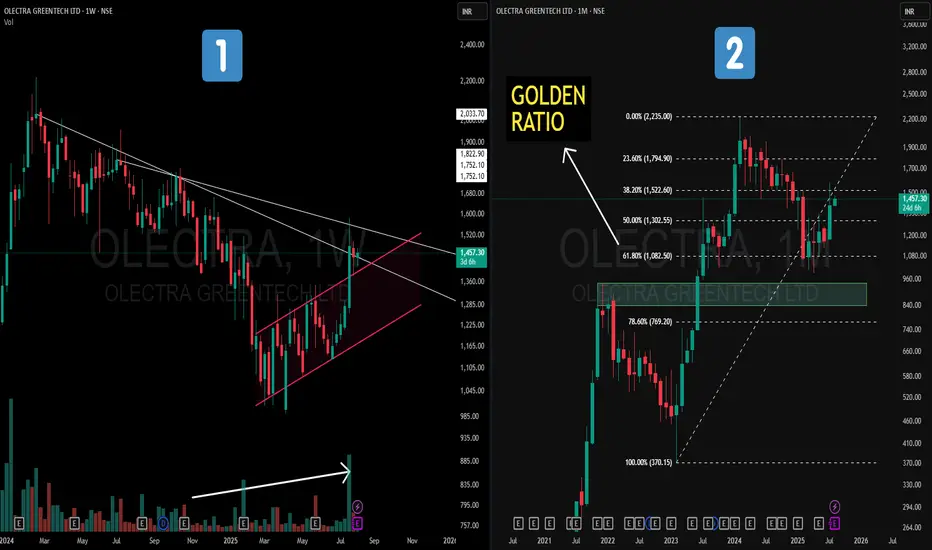
Olectra Greentech – Golden Ratio on MTF + Hidden channel on WTF📝 Description
📌On the Weekly Chart (Left) – Price action has formed a strong counter-trend (CT) breakout from a prolonged downtrend. Hidden within the structure is a parallel channel (highlighted in pink), with volume gradually increasing in the recent rally — a positive sign of accumulation.
📌On the Monthly Chart (Right) – A Fibonacci retracement drawn from the Feb 2023 low to the Feb 2024 high (a one-year strong uptrend) shows price taking support exactly at the 61.8% Golden Ratio. This reaction from a key retracement zone is aligned with historical technical behavior.
This is not a forecast, but rather a technical observation of structure, retracement behavior, and volume dynamics.
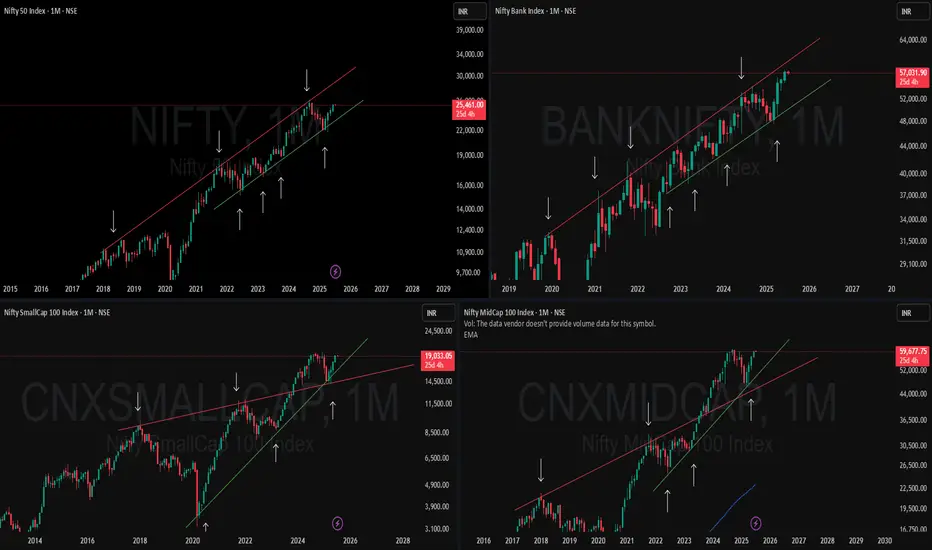
How These 2 Lines Caught Every Major Move in All 4 Indices! 📈 Keep It Simple, Keep It Powerful
When price action starts making sense, you’ll realize how far a single Support and Resistance line can take you.
🟥🟩 NIFTY & BANKNIFTY – Two clear examples of parallel channel trends, marching higher with clean Higher Highs and Higher Lows.
🟩🟥 MIDCAP & SMALLCAP – Not just catching up, but breaking out of Multi-Timeframe contraction patterns with strength — a sign of broader market participation.
They're now retesting and reclaiming previous highs after a much-needed breather.
💡What this chart tells us:
-Trendlines aren't just lines—they’re psychological guides to institutional and retail behavior.
-All four indices are moving in structured, rhythmic patterns.
-Simplicity works best. The markets speak clearly when you know what to listen for.
#SAIL#SAIL has corrected about 40% from recent swing high and currently trading near 61.8% retracement zone + weekly 200 ema and parallel channel support confluence zone. On weekly tf, it is probably trying to make a double bottom.
Historidally, when it gave a breakdown below weekly 200 ema and unable to sustain above it, it continued to underperform for almost 8-10 years but now it is probably trying to take support around it.
Also, RSI is making HLs off late, which is probably a good sign.
In terms of R:R, this is currently a good bet on long side.
As usual, DYOR and this isn't a Buy or Sell reco - but just an educational purpose post

Rallis - 1. After reaching the pink channel top during the year 2010, it started moving sideways with very little inclination only to touch the other side of the parallel channel.
2. While going sideways,it formed the blue parallel channel. Whenever it touched the blue parallel channel bottom, it climbed higher to its top. Now it touched the bottom of the pink parallel channel + blue parallel channel+ support line of 254+ fib 0.618 retracement.
3. All the above led the strong foundation for its bullish rally and already gave 50% in 3 months.
4. Trade setup:
a. After reaching the blue channel top, it it comes to 254, its good to enter as a aggressive entry.
b. As a conservative entry, entry should be done only after the successful strong breakout above the blue channel and 362 resistance and it should sustain above it for 3 months.
c. Once the above is done, target will be minimum 5x in very long term.
Note: This is for educational purpose and not a stock recommendation.
