Gold holds steady as investors eye Fed decisionGold prices were little changed on Wednesday as market participants awaited the U.S. interest rate verdict, while the spotlight was also on President Donald Trump's trade policies amid fresh tariff threats.
💡Key Market Influences:
Asian Bank Holiday (Lunar New Year): Liquidity will be significantly lower today, which may lead to a tighter price range in the Asian .
FOMC Data Release Tonight: The market will closely watch the statements from Fed Chairman Powell, as they could have a major impact on USD (DXY) and set the long-term direction for gold.
📊 Key Observations:
1. Support & Resistance Levels:
o Immediate Resistance:
$2,771–2,772 (Marked OB Zone): This is a supply zone or order block (OB) identified on the 1-hour chart, acting as a critical resistance level.
All-Time High Zone: The price is approaching a significant
resistance area near the $2,790 level, the all-time high.
o Support Levels:
$2,737 Level (Marked POI Level): This is an important demand zone
(Point of Interest or POI) where buying pressure previously occurred.
$2,710 Zone: Another significant support level where price saw a reversal,
reinforced by the proximity of the 200 EMA.
2. Order Block on 1-Hour (OB on 1H):
The $2,771–2,772 area is identified as a bearish order block. If the price fails to break
above this level, it could signal a rejection and potential downside movement.
o Demand Zone Near $2,737:
A key bullish order block where price bounced upward after
a CHoCH (Change of Character) confirmed bullish momentum.
3. Trend Analysis:
o Bullish Channel Formation:
Price is trading in an ascending channel, indicating a bullish trend.
Price is currently in the middle of the channel, suggesting more room for upside if
it can break the resistance zone.
o Higher Lows Formation:
Clear signs of higher lows confirm the bullish structure on this timeframe.
4. Exponential Moving Average (EMA): 200 EMA:
Positioned around $2,737, providing dynamic support.
The price bounced off this level, indicating strong bullish sentiment
as long as it stays above the EMA.
5. Change of Character (CHoCH):
o Bullish CHoCH:
The breakout above the previous structure low near $2,737
signals a shift from bearish to bullish momentum.
6. Volume Insights:
o Noticeable spikes in volume near the $2,737 support level,
suggesting increased buyer activity in this area.
Trading Insights:
1. Bullish Scenario:
o A clear breakout above $2,771–2,772 OB could lead to a continuation
toward the $2,790 all-time high.
o Maintain long positions as long as price stays above the 200 EMA
and the $2,737 support zone.
2. Bearish Scenario:
o Rejection at $2,771–2,772 may lead to a retracement toward
the $2,737 support level or the $2,710 zone.
o Watch for a break below $2,737, which could invalidate the bullish trend.
Key Levels to Watch:
• Resistance: $2,771–2,772 and $2,790
• Support: $2,737 and $2,710
• Critical EMA Level: 200 EMA at $2,737
⚠️ Next Steps:
• Monitor price action closely around the $2,771–2,772
OB zone for signs of a breakout or rejection.
• Use the ascending channel boundaries to plan entry and exit points.
• Keep an eye on volume spikes for confirmation of trend strength.
👉 Always follow TP/SL to protect your capital and maximize profits!
Stay tuned for updates once the confirmations are in place!
Please support me with your likes and comments to motivate me to share more
analysis with you and share your opinion about the possible trend of this chart
with me !
📢 Best Regards , Silver Wolf Traders Community
Disclaimer: This is for educational purposes only. Always trade responsibly and
manage your risk effectively
Parellelchannel

KOTHARI PETROCHEM MAKING A FLAG AND POLE.KOTHARI PETROCHEM is making a Flag and Pole formation. Wait for breakout to enter.

JAYNECOIND - Ready for the next swingJAYNECOIND - Has been trading in the channel for the last 6+ months, the stock has taken support at the bottom of the channel yet again and is showing clear signs of going for its next swing. I see an upside of up to 27%
I checked the fundamentals and they look decent.

Bullish Run in Tata Communications Ltd. An Investor's Delighthowdy Traders,
Much of the power of bullish investors is found in Tata Communications.
If seen inside the chart, higher high and lower low is shown in parallel channels.
1429 level was a strong resistance level but now it is a support.
If the market sustains above the 1429 level then a bullish market can be seen and 1480 is the target.


MARUTI BREAKOUTMARUTI gave breakout on 15 min time frame parallel channel
trade as per price action,

Parallel channel - United Breweries4 hour time frame
Good opportunity, add to your watchlist and take advantage.

Parallel channel - Broke the resistance.I have posted this on 3 Oct in weekly time frame. Now it's time to enter in daily time frame, it broke the resistance and consolidated for few days and formed a bull candle.
I've already entered the trade yesterday.
There is all time high between 1100 to 1200, take risk according to your risk appetite.
*Market is always superior*

PAGEIND - Channel patternChannel pattern - good opportunity, but wait for the confirmation and take advantage.
Add to your watchlist.

Banknifty AnalysisBanknifty has been trading in Falling Channel from the last 109 bars on Daily time frame,in the last few days we saw bullish momentum in price and closing on friday gave more strength to bulls. Further view according to price action is, if the index manages to give breakout above this falling channel then we can see Banknifty to touch 39000-41000. On the downside price might face resistance near the upper line of the channel and if possible reversal happens from there then 35000-34000 can hold the downsides.

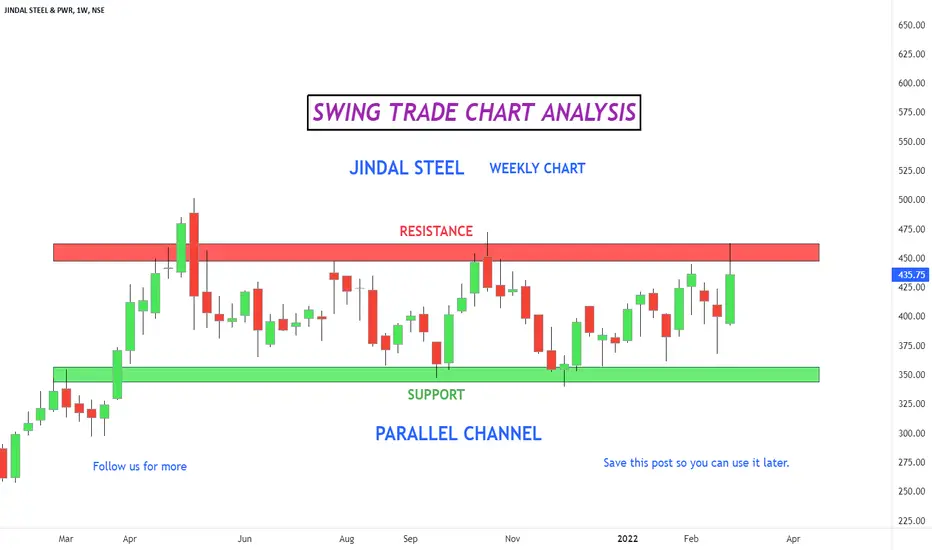
Jindal Steel : Parallel channel (Time frame - 1 Week )Chart of - Jindal Steel
Stock is trading in a range by forming a parallel channel .
You can enter in this stock after proper breakout.
Leave us a comment or like to keep our content for free and alive.
Have a great day everyone!
Disclaimer: All charts are purely for educational and information purpose only. I am not a SEBI registered Investment advisor. Please Trade and invest based on your knowledge and risk profile.
Can we see the new ATH in NIFTY?No doubt that market will be highly volatile ahead of Budget
Summary
1) As of now you can see that Nifty is trading in one particular (white) channel in which it had given a breakout in past and made an ATH of 18604.45
Channel width is 1,566 points.
2) In the chart there are 3 EMA's 10 is red, 20 is green, 50 is blue.
3) There is also a Red channel which has a width of 430 points which given a breakdown and achieved the target easily in 3 trading sessions.
4) Biggest technical support of Nifty is the channel line in which it is trading and Physcological support, for now, is 17K closing basis.
5) On a daily timeframe nifty is weak. Reason- 10 EMA given a negative divergence and crossed 20 and 50 Ema.
On the other side, Bannifty is very strong and has seen very good buying volumes in all banking stocks.
6) Nifty IT is oversold and expecting some recovery in it and Banknifty is so strong that it can also pull nifty up.
7) This view will fail if nifty gives 2 consecutive below the channel. Till that time Nifty is buy on dips and ready to make a new ATH.
Note: Please don't create postions according to this view. This is just aview trade on levels.

CDSL Parallel Channel Trading StrategyAs you can see CDSL has been in a parallel channel for a very long time, as its near the lower channel support, we can expect a good momentum if it takes a support here and moves up after creating a base down here.

Triple top in TECHM5 days of parallel channel gets disrupted. And also made a triple top. We can see a good move once the consolidation zone breaks down. (or) if the price breaks above the resistance zone. We can look upside.
NOTE: Educational purpose only NSE:TECHM NSE:TECHM

3 Month Breakout in RKECParellel channel breakout in RKEC with heavy volume
RSI - is near about 80 (so be a little cautious)
Targets are marked on the basis of fib retracement only
Sl is marked on the basis of pure support
