REFEX 1 Week Time Frame 📌 Current Key Price (Approx)
Live share price around ₹239 – ₹250 on NSE/BSE.
📊 Weekly Technical Levels (Support / Resistance)
🔹 Weekly Support
S3: ~₹205 – ₹217 zone (lower weekly structural support)
S2: ~₹221 – ₹229 range (important near-term weekly support)
S1: ~₹224 – ₹230 (immediate weekly support)
🔸 Weekly Pivot
Pivot Zone: ~₹228 – ₹239 mid-range level — acts as a decision point between bullish and bearish bias in the weekly timeframe.
🔸 Weekly Resistance
R1: ~₹232 – ₹239 (first weekly resistance)
R2: ~₹241 – ₹246 (next hurdle)
R3: ~₹245 – ₹250+ (stronger weekly barrier)
📈 Weekly Chart Bias Interpretation
✔️ Above pivot (~₹228–₹239)
→ Slightly bullish to neutral weekly structure with room to test R2/R3.
❌ Below pivot / failing R1 (~₹232)
→ Bearish pressure could push toward S1/S2 levels.
📌 Weekly indicators (from broader technical sites) suggest current bias is neutral to bearish on weekly timeframe rather than strongly bullish.
🧠 Quick Weekly Snapshot
Support cluster: ~₹217 – ₹229
Key pivot area: ~₹228 – ₹239
Resistance cluster: ~₹241 – ₹250+
Trades tend to respect weekly pivots and S/R levels for reversal or breakout cues. Monitor weekly close above/below pivot zones for the next directional bias. Always combine with volume and momentum indicators for confirmation.
Patterns

GPIL 1 Day Time Frame 📊 Current Price Snapshot (India)
• GPIL current live price: ~₹250–₹265 range in latest sessions (previous close ~₹250.97 to ~₹262.6 in intraday updates) — this can vary minute-by-minute during market hours.
• 52-week range: ₹145.75 (low) / ₹290.00 (high).
🔎 Daily Pivot Support & Resistance Levels (1-day time frame)
📍 These levels are typically computed from the prior day’s high, low & close and are key short-term reference points:
Classic Pivot (Key Levels)
• R3: ~₹267.07
• R2: ~₹259.48
• R1: ~₹253.97
➡️ Pivot Point (PP): ~₹246.38
• S1: ~₹240.87
• S2: ~₹233.28
• S3: ~₹227.77
✔ Interpretation:
Price above Pivot (~₹246–248) → short-term bullish bias.
Price bounces off S1/S2 → potential support zones if weakness continues.
Break above R2/R3 → stronger continuation of upward momentum.
📈 Alternate Pivot Reference (Daily Standard / Fib Levels)
Another pivot provider suggests similar short-term zones (approx):
• S3 ~₹242.60
• S2 ~₹250.21
• S1 ~₹254.60
• Pivot (CPR mid): ~₹254.60
• R1 ~₹262.21
• R2 ~₹266.60
• R3 ~₹274.21
📌 Moving Averages & Indicators (for context)
• 20/50/100/200 day EMAs are all clustered around mid-to-upper ₹240s–₹250s region — indicating neutral to mixed momentum on daily time frames.
• RSI ~47–48 suggests neutral momentum (neither strongly overbought nor oversold).
📍 What This Means for Today’s Trading
Bullish near-term scenario (price holds above pivot):
✔ If GPIL stays above ₹246–₹250, look for upside toward:
• R1 ~₹254–₹255
• R2 ~₹259–₹262
• R3 ~₹266–₹270+
Bearish near-term scenario (break below support):
✔ If price slips below ₹241–₹237 area:
• S2 ~₹233
• S3 ~₹227+
These levels can act as short-term support zones for pullbacks.

SBICARD 1 Month Time Frame 📌 Latest Price Context:
• Stock is trading around the mid ₹750-₹760 zone.
• It has recently tested 52-week lows near ₹725 and remains below key moving averages — a bearish technical structure in the very short term.
📊 1-Month Timeframe Key Levels (Support & Resistance)
🔻 Support Levels (Buy Zones)
S1: ~₹745–₹747 — immediate support zone for dips.
S2: ~₹735–₹738 — stronger support beneath the first fold.
S3: ~₹725–₹729 — major support near 52-week low; breaking below risks extra downside.
➡ A breakdown below ₹725 on monthly closes would be bearish.
📈 Resistance Levels (Targets / Sell Zones)
R1: ~₹762–₹763 — near the pivot/resistance in current 1-month profile.
R2: ~₹769–₹770 — resistance zone at recent short term swing highs.
R3: ~₹778–₹780+ — higher resistance – breakout above helps bullish recovery.
➡ Sustained closes above ~₹770–₹780 can shift short-term bias to neutral/bullish.
🔍 Trading Bias Guidance
📉 Bearish to Neutral if price stays below ₹762–₹770
📈 Bullish structure if breaks and holds above ₹770–₹780

MUTHOOTFIN 1 Week Time Frame 📊 📍 Current Weekly Price Context
• Current price (recent trade close) is around ₹3,704.20.
🔹 KEY WEEKLY LEVELS (Support & Resistance)
📈 Weekly Resistance Levels — possible upside barriers where selling pressure could appear:
R1: ~₹3,805–₹3,810 — first major resistance zone.
R2: ~₹3,830–₹3,880 — next higher resistance.
R3: ~₹3,900+ — extended resistance from recent highs.
📉 Weekly Support Levels — zones that can act as buyers on dips:
S1: ~₹3,740–₹3,750 — first support.
S2: ~₹3,690–₹3,700 — secondary support.
S3: ~₹3,650–₹3,670 — deeper buyer interest area.
📌 Weekly Pivot (Mid-Point): ~₹3,770–₹3,775 — key pivot that often acts as dynamic support/resistance on weekly TFs.
📅 HOW TO USE THESE WEEKLY LEVELS
Bullish Scenario:
A weekly close above ₹3,805–₹3,810 increases the probability of an extension toward the higher resistance zones around ₹3,830–₹3,880+.
Neutral / Range:
Price oscillation between ₹3,740–₹3,830 suggests consolidation on the weekly chart — until breakout or breakdown volume confirms direction.
Bearish Scenario:
A sustained break below ₹3,740 could expose deeper supports around ₹3,690–₹3,670 on the weekly view.
📌 Note: These are purely technical reference levels from common weekly pivot/resistance frameworks on Indian stock charts — not investment advice. Always combine with volume, trend indicators (e.g., RSI/MACD) and risk management for your strategy.

GMDC 1 Day Time Frame from NSE data:
📊 Daily Pivot & Key Levels (1D Timeframe)
📌 Daily Pivot Point (PP): ₹606.73 – This is the central bias level. Above this suggests short-term bullish control; below may signal weakness.
💥 Resistance Levels (Upside)
R1: ₹627.46 – first major resistance above the pivot
R2: ₹640.38 – medium-term barrier
R3: ₹661.11 – stronger supply zone / higher target
🛡️ Support Levels (Downside)
S1: ₹593.81 – immediate daily support
S2: ₹573.08 – deeper pullback level
S3: ₹560.16 – stronger lower support area
✔ How to use these levels (Daily view):
📈 Bullish conditions:
If price sustains above Pivot (₹606.73) → bias turns bullish
Stronger breakout confirmation if price closes above R1/R2 with volume
📉 Bearish conditions:
If price breaks below S1 (₹593.81) → watch for next supports (S2/S3)
Failure at resistance zones can lead to pullbacks
💡 Summary Daily Chart Levels (1D)
Level Price (Approx)
R3 661
R2 640
R1 627
Pivot 606
S1 594
S2 573
S3 560
(Levels rounded for clarity)

HAVELLS 1 Day Time Frame 📌 Current Market Snapshot (NSE)
• Current Price: ~₹1,345–₹1,352 range (intra‑day) — varies by source/data feeder 👆
📈 Daily Pivot & Key Levels (Daily Timeframe)
📊 Pivot Point Levels
Level Price (Approx)
🧮 Pivot (Daily) ₹1,270–₹1,275
🔼 Resistance 1 (R1) ₹1,287–₹1,291
🔼 Resistance 2 (R2) ₹1,301–₹1,305
🔼 Resistance 3 (R3) ₹1,316–₹1,318
🔽 Support 1 (S1) ₹1,259–₹1,265
🔽 Support 2 (S2) ₹1,243–₹1,245
🔽 Support 3 (S3) ₹1,230–₹1,232
(Classic pivot daily levels)
📊 Alternative Daily Support / Resistance Levels (Trendlyne / Research360)
✔ Pivot: ~ ₹1,324–₹1,325
✔ Support Levels:
• S1: ~ ₹1,294–₹1,294
• S2: ~ ₹1,276–₹1,276
• S3: ~ ₹1,245–₹1,246
✔ Resistance Levels:
• R1: ~ ₹1,342–₹1,343
• R2: ~ ₹1,373–₹1,373
• R3: ~ ₹1,391–₹1,391**
🔍 Short‑Term Daily Reference (Intraday Pivot)
From intraday pivot analysis (updated today):
• Central Pivot (CPR): ~ ₹1,319–₹1,320
• Daily R1: ~ ₹1,333–₹1,334
• Daily R2: ~ ₹1,349–₹1,350
• Daily R3: ~ ₹1,363–₹1,363
• Daily S1: ~ ₹1,290–₹1,291
• Daily S2: ~ ₹1,289–₹1,289
• Daily S3: ~ ₹1,303–₹1,303
(based on multiple pivot calculation methods including Standard & Camarilla)
📌 How to Use These Levels Today
Bullish scenario:
✅ Holding above Pivot / CPR (~₹1,270–₹1,324) → bias to R1 → R2 → R3 zones.
Bearish scenario:
❌ Break below S1/S2 (~₹1,259 / ₹1,243) → weakness toward S3.
Short traders often watch CPR for pullbacks and reversals within the day.

IIFL 1 Day Time Frame 📊 Daily Pivot & Key Levels (1‑Day Timeframe)
📍 Daily Pivot:
• ₹520.28 (reference level for bias)
📈 Resistance Levels:
• R1: ₹532.57 — first upside hurdle
• R2: ₹543.28 — next barrier above
• R3: ₹555.57 — extended resistance zone
📉 Support Levels:
• S1: ₹509.57 — immediate support
• S2: ₹497.28 — next support zone
• S3: ₹486.57 — deeper support below
📌 How to Use These Levels Today
📈 Bullish view:
Break above ₹532.5 – ₹543.3 can open room toward ₹555+ for the day.
📉 Bearish view:
If price drops below ₹509.5, sellers could push toward ₹497 and then ₹486.5.
🟡 Pivot reaction:
Holding above the pivot ₹520.28 suggests bias toward upside today.
Falling below pivot suggests weakness intraday.
🔍 Note on Current Price Trend
Some data (delayed) shows moving averages and indicators near oversold, but pivot levels remain useful for intraday decisions.

DIXON 1 Day Time Frame 📍 Live Price Snapshot
🔹 Approx Current Price: ~₹11,566 (INR) (up strong recently)
🔹 52-Week Range: ~₹9,835 – ₹18,471
📊 Daily Pivot & Support/Resistance Levels (1D Timeframe)
These are commonly used by traders to judge intraday/daily trend bias, entry/exit zones, and key price reactions:
Level Price (Approx) Type
R3 ₹11,551 – ₹11,600 Major Resistance
R2 ₹11,375 – ₹11,380 Resistance Zone
R1 ₹11,203 Near-Term Resistance
Pivot ~₹11,027 Daily Center / Bias Level
S1 ₹10,855 Support
S2 ₹10,679 Support Zone
S3 ₹10,507 Strong Support
👉 Price above Pivot & R1–R3: Bullish bias
👉 Price below Pivot & heading toward S1–S3: Bearish/neutral pressure
These are classic pivot levels updated for today’s trading range.
📈 Short-Term Technical Structure
Bullish / Positive signs:
Price recently moved above short EMAs (e.g., 5-, 9-day), showing short-term strength.
RSI around mid-range suggests room to run upside without overbought stress.
Bearish / Caution flags:
Longer moving averages (50/100/200) still overhead as resistance — trending bias remains cautious.
Technicals from some chart views still show a weak structure on daily if price fails below pivot.
📌 How to Use These Levels Today
✔ Bullish bias only if price sustains above pivot (~₹11,027)
✔ Near-term breakout zone: Clear move above R2 (~₹11,375) / R3 (~₹11,550)
✔ Support watches: Monitor S1 (~₹10,855) and S2 (~₹10,680) for pullbacks
✔ Break below S3 (~₹10,507) — could signal deeper intraday bearish pressure
🧠 Quick Context
Shares recently rebounded and are above short-term EMAs, indicating some short-term strength.
Overall broader market influences (mid-cap pressure / sector flow) still matter for this stock’s direction.
Price near multimonth lows, so risk and volatility remain elevated.

OIL 1 Day Time Frame 📊 Current Approx Price (as per today data): ₹488.90 – ₹514.4 range (varies by platform/time) — OIL has recently traded around this area near daily pivot/major levels.
📈 Daily Pivot & Key Levels (Classic method)
Level Price (₹) Role
R3 (3rd Resistance) 507.45 Strong upside hurdle
R2 499.40 Secondary resistance
R1 491.35 Near-term resistance
Daily Pivot 483.30 Trend bias line
S1 (1st Support) 475.25 Immediate support
S2 467.20 Next downside cushion
S3 459.15 Major support zone
👉 Interpretation (1-day frame):
Price above pivot (~483-484) = bullish bias on the daily.
Near-term resistance cluster: ₹491–₹499–₹507 — watch breakout closes above these for continuation.
Downside support cluster: ₹475 → ₹467 → ₹459 — breakdown below these suggests short-term correction.
📊 Short Summary (Daily Momentum & Indicators)
Technical bias:
• RSI near bullish/neutral zone — showing positive momentum without being extremely overbought.
• MACD / ADX generally leaning bullish indicating trend strength at the moment.
Overall daily structure favors bullish to sideways — supports holding and resistance being tested.
🧠 How to use these levels (Daily)
📍 Bullish setup:
• If price stays above pivot ~483 and holds above R1 (~491) → next target R2 ~499 → R3 ~507.
📍 Bearish setup:
• If price falls below pivot ~483 and breaks S1 (~475) → move down to S2 (467) & potentially S3 (459).
📍 Key breakouts:
• Clear daily close above 507 → strong bull confirmation.
• Close below 459 → negates short-term bull view.

KAYNES 1 Week View 📌 Current Price Context
• Latest traded price around ₹3,640–₹3,720 on NSE (live varies by exchange and time) — showing recent rebound after volatility.
📈 Weekly Pivot & Support/Resistance Levels (1-Week Timeframe)
📍 Weekly Pivot Reference
• Weekly Pivot Point (central level): ~₹3,702 (midpoint guiding sentiment)
🔼 Weekly Resistance Levels (Upside)
• R1: ~₹3,734 – ₹3,745
• R2: ~₹3,760 – ₹3,770
• R3: ~₹3,790 – ₹3,880
🔽 Weekly Support Levels (Downside)
• S1: ~₹3,675 – ₹3,678
• S2: ~₹3,640 – ₹3,635
• S3: ~₹3,280 – ₹3,280+ (broader deeper support zone)
📊 How Traders Interpret These Weekly Levels
Bullish Signals (Weekly Close Above)
✅ A weekly close above R1 (~₹3,740+) supports continuation of near-term recovery.
➡ Next upside targets become R2 (~₹3,760–₹3,770) and then R3 (~₹3,790–₹3,880) as next resistance layers.
Bearish Signals (Weekly Break Below)
⚠ Break and weekly close below S1 (~₹3,675) increases risk of deeper weakness, with S2 (~₹3,635) and S3 (~₹3,280) as key downside floors.
Neutral/Range Scenario
↔ If price holds between S1–R1 (~₹3,675–₹3,745), expect sideways/consolidation before a clear breakout direction takes shape.
📌 Key Notes on Trend & Structure
• Price is below longer historical mid/long-term averages, reflecting a wider downtrend from prior highs, but short-term technicals show stabilization and bounce risk.
• Recent volatility (big swings) suggests support/resistance zones matter more than trend at the moment — breakouts through these weekly levels tend to signal next directional move.
🧠 Practical Weekly Trade Levels
Level Type Approx Zone
Weekly Pivot ~₹3,702
Resistance R1 ~₹3,734–₹3,745
Resistance R2 ~₹3,760–₹3,770
Resistance R3 ~₹3,790–₹3,880
Support S1 ~₹3,675–₹3,678
Support S2 ~₹3,635–₹3,640
Support S3 ~₹3,280+
🧾 Quick Takeaway
Bullish weekly bias if price closes above ₹3,740–₹3,760 with momentum.
Bearish pressure remains if weekly closes below ₹3,675–₹3,640.
Range trade likely between those pivot bands until directional breakout occurs.

BSE 1 Day Time Frame 📌 Current Price & Daily Range (Live Context)
Estimated current market price: ~₹2,850–₹2,880 (indicative from multiple sources citing latest live price movement).
Today’s daily high/low range: Approx ₹2,793–₹2,929 (observed current session variation).
⚠️ Exact live price can differ by minutes — check your trading platform for exact tick.
📈 1‑Day Pivot & Levels (Daily timeframe)
Classic Pivot Zone:
Pivot Point: ~₹2,647–₹2,663 (key balance level)
Immediate Resistance (Upside Targets):
R1: ~₹2,765–₹2,775
R2: ~₹2,828–₹2,830
R3: ~₹2,940 or higher (extended resistance)
Key Support (Downside Levels):
S1: ~₹2,584–₹2,625
S2: ~₹2,466–₹2,575
S3: ~₹2,403–₹2,537 — major downside pivot safety zone.
👉 Price above pivot generally signals bullish intraday bias; below pivot suggests weakness.
📊 Trend & Momentum (Daily)
Indicators & moving averages:
Price is trading above 20/50/100/200‑day EMAs, indicating a bullish trend on the daily chart.
RSI near neutral‑to‑positive zone (~50), showing room for further continuation before overbought.
This suggests bullish bias on daily timeframe, but resistance zones near ₹2,828–₹2,940 are key to break for sustained upside.
🧠 How to interpret the daily levels today
Bullish scenarios (1‑Day):
✔ Above ₹2,828–₹2,830 — expands move toward ₹2,940+.
✔ Sustained above pivot ~₹2,650+ — retains short‑term bullish structure.
Neutral / consolidative:
➡ Between ₹2,650 – ₹2,828 — range balance, sideways action likely.
Bearish scenarios (1‑Day):
✘ Break below ₹2,584 — could pull toward ₹2,466 / ₹2,403 supports.

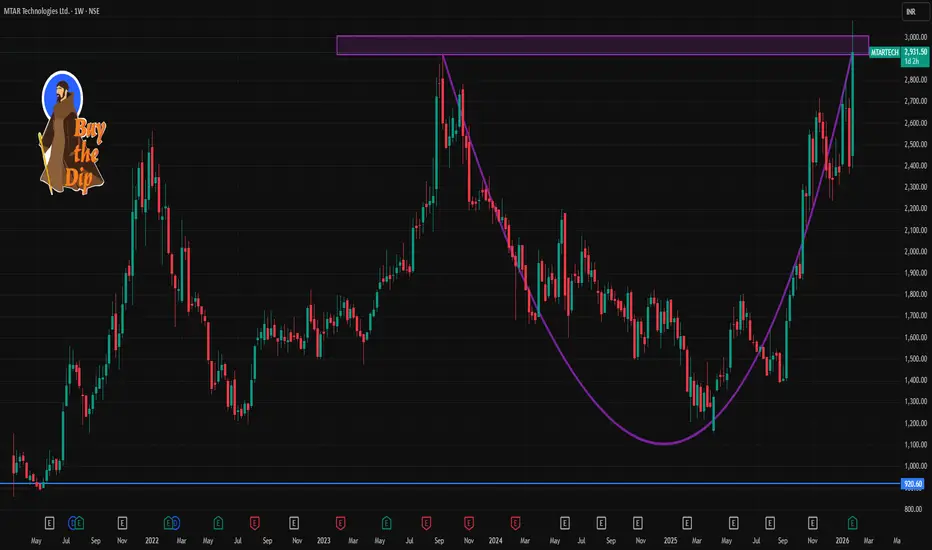
MTARTECH 1 Week Time Frame 📊 Current Price Snapshot
MTAR Technologies closed around ₹2,931–₹2,932 recently.
📈 Weekly Pivot & Support/Resistance Levels
(Important zones likely to act as reference over ~1 week)
🔹 Pivot Levels
These are calculated based on recent price activity and help gauge short-term bias:
Central Pivot ≈ ₹2,909–₹2,954 (key balance level)
🔹 Resistance Levels
Potential upside barriers where price may slow/reverse:
₹2,995–₹3,031 near short-term upper range
₹3,100–₹3,178 next resistance cluster
Above ₹3,200 breakout target (longer weekly/extension)
🔻 Support Levels
Important zones to watch if price pulls back:
₹2,741–₹2,762 area (S1) — near immediate short-term support
₹2,562–₹2,600 range (S2) — strong secondary support
₹2,461–₹2,500 (S3/S4) — deeper pullback zone
These resistances/supports are based on pivot point calculations & Fibonacci extensions covering multiple pivot methods.
📊 Technical Indicators (Short-Term Context)
Moving averages (20, 50, 100, 200 DMA) are largely bullish in daily/weekly analysis, supporting upward momentum.
RSI is near bullish territory but approaching overbought on shorter frames — indicating possible consolidation ahead.
Some technical tools show short-term buy signals; others show neutral — indicating range movement with upside bias.
📌 How to Use These Levels
Bullish Scenario:
➡ Price sustaining above the pivot (~₹2,890-₹2,950) suggests continuation toward ₹3,000 → ₹3,100+ resistance levels.
Bearish/Retracement Scenario:
➡ Failure below pivot or key support near ₹2,740 could trigger pullbacks toward ₹2,600 → ₹2,500 support zones.
This setup works well for 3–7 day trading or planning entry/exit zones.
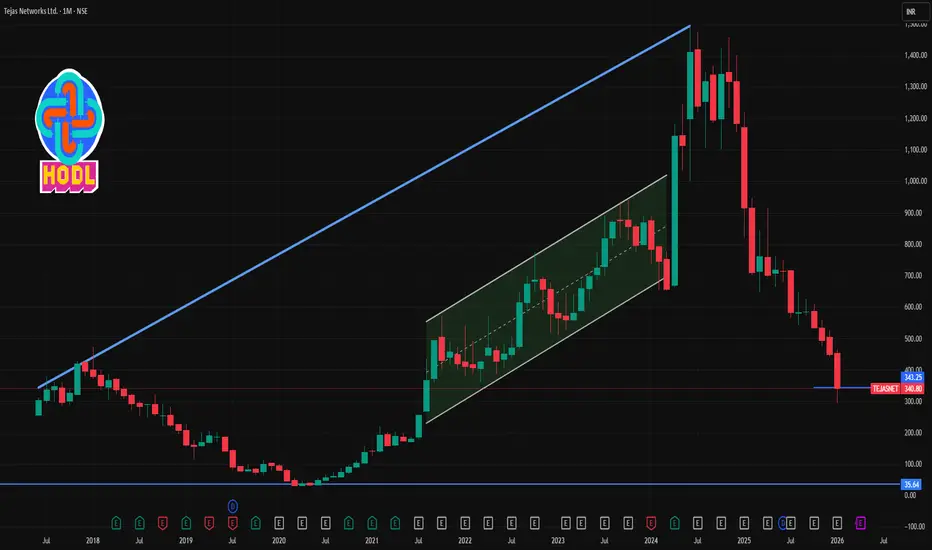
TEJASNET 1 Month Time Frame 📊 Current Price Snapshot (Approx)
Last traded price ~ ₹330-₹345 on NSE/BSE during late Jan 2026, after recent volatility and sell-offs.
📉 1-Month Timeframe — Key Levels
🔻 Support Levels (Downside)
These are levels where the stock could find buyers or pause losses on a 1-month chart:
Support Zone Significance
₹320 – ₹325 Immediate support; recent intraday floor (current price region)
₹301 – ₹315 Secondary support zone from pivot breakdowns
₹285 – ₹300 Deeper support if broader bearish momentum continues
📈 Resistance Levels (Upside)
Resistance Zone Importance
₹355 – ₹360 1st resistance from short-term moving average relevance
₹370 – ₹375 Next resistance cluster near recent intraday reactions
₹390 – ₹395 Higher resistance if bounce gains strength
🧠 Technical Indicator Context (1-Month)
📉 Trend Bias: Bearish overall, price trading significantly below major moving averages (20-day, 50-day, etc.).
📊 RSI: Near oversold but not confirmed bottom — suggests bearish momentum but potential for short-term rebounds.
📉 MACD & STOCH: Bearish signals persist, indicating weak price action on the 1-month chart.
🗂 Summary — 1-Month View
⚠️ Bearish Bias: The stock is in a short-term downtrend, trading below key moving averages and suffering weak momentum.
🛑 Support in Focus: ₹320-₹315 first; further deeper zone near ₹285-₹300 if bears intensify.
📈 Resistance Roadblock: ₹355-₹360 key for initial bounce; stronger rally needs break above ₹370+.
📉 Bearish Technicals: RSI not strongly indicating reversal yet; MACD remains bearish.
HINDZINC 1 Month Time Frame 📍 Current Price Snapshot (latest close / recent trade)
HINDZINC is trading around ~₹628–₹630 on NSE/BSE — after some volatility in recent sessions. Its 52‑week high is ~₹733 and 52‑week low ~₹378.15, showing wide longer‑term movement.
🛠 1‑Month Technical Levels (Support & Resistance)
These are the key zones traders watch for a 1‑month period based on pivot analysis and recent price action:
🔼 Resistance Levels (Upside Targets)
1. ₹705 – ₹715: Immediate resistance zone around recent highs and pivot R1/R2 cluster.
2. ₹735 – ₹750: Next major supply/resistance area — crossing this would signal stronger upside continuation.
3. ₹760 – ₹780+: Extended breakout zone if sentiment turns sharply bullish (higher targets from pivot extensions).
📌 Overall, ₹705–₹715 is the near‑term hurdle the stock needs to clear for a bullish run.
🔽 Support Levels (Downside Price Floors)
1. ₹690 – ₹700: First strong support near recent consolidation lows/pivot S1.
2. ₹670 – ₹680: Secondary support — a deeper pullback zone.
3. ₹650 – ₹660: Key base area — breakdown below this can signal more downside pressure.
4. ₹620 – ₹630: Major structural support if broad market or metals weakness intensifies.
📌 The ₹670–₹700 band acts as the core support area this month.
⚠️ Quick Summary
✔ Above ₹705–₹715 = bullish continuation likely.
✔ Between ₹670–₹700 = consolidation zone.
✔ Below ₹650 = risk of deeper retracement.

STARHEALTH 1 Week Time Frame 📊 Weekly Price Range (1‑Week History)
High (last week): ~₹469.8
Low (last week): ~₹442.45
(Source: Marketscreener weekly price extremes)
📌 Key Weekly Support Levels
Support zones you may watch on the weekly timeframe:
1. Support 1: ~₹440–₹442 (recent weekly low)
2. Support 2: ~₹430 area (round‑number psychological / pivot cluster)
3. Support 3: ~₹408–₹415 range (broader structural support from pivot supports seen on shorter pivots)
Weakness below ₹430 could open the lower band towards ₹405–₹410.
📌 Key Weekly Resistance Levels
Potential weekly resistance zones to monitor:
1. Resistance 1: ~₹470–₹472 (recent weekly highs & EMA cluster)
2. Resistance 2: ~₹480–₹485 (psychological and medium MA area)
3. Resistance 3: ~₹495+ (upper pivot / longer‑term range top)
A weekly close above ₹480–₹485 would indicate stronger upside pressure.
📈 Technical Indicator Context (Weekly)
RSI and weekly momentum indicators on some platforms suggest neutral‑to‑slightly bullish conditions rather than extreme overbought levels.
Weekly pivot and moving average positions (when available) confirm ₹462–₹470 as an important zone for bullish continuation.

JLHL 1 Day Time Frame 📌 Current Live Price (1‑Day)
Last traded price: ~₹1,305–₹1,322 range today on NSE/BSE.
Day’s range: ~₹1,301–₹1,359.
📊 Intraday Technical Levels (1‑Day Time Frame)
🔹 Pivot & Reference
No concrete official pivot published for today across many free data sites, but general intraday pivot technique (based on brokers’ short‑term screens) focuses around mid‑range prices near ₹1,310–₹1,320 as neutral area.
🔼 Resistance Levels (Upside)
These are zones where the price may face selling pressure on the same trading day:
1️. ₹1,350–₹1,360 — initial resistance zone (recent intraday high area).
2️. ₹1,375–₹1,390 — secondary resistance if price clears the initial zone.
🔽 Support Levels (Downside)
These are zones where buyers may step in intraday:
1️. ₹1,290–₹1,300 — nearest support band (recent intraday low).
2️. ₹1,270–₹1,280 — next lower support cluster (near the 52‑week low region).
🧠 Intraday Trading Interpretation
Bullish bias intraday if:
Price breaks above ₹1,350–₹1,360 with volume → could test higher around ₹1,375–₹1,390.
Bearish bias intraday if:
Price loses ₹1,290 support → risk of slide toward ₹1,270+ zone.
Range‑bound scenario:
Price oscillates between ₹1,290–₹1,350 if participation stays muted.

CONCOR 1 Day Time Frame 📊 CONCOR — 1‑Day Time Frame Key Levels (Indicative)
Current Price (recent session)
• ~₹478–₹480 (down intraday) — trading near session lows.
🔁 Pivot & Classic Levels (from standard technical calculation)
These are typical pivot/SR levels used by traders for one‑day setups:
Pivot Point: ~₹520
➡️ The central reference level where bias may shift.
If price trades above this level intraday → bullish bias; below → bearish bias.
Resistance Levels:
• R1: ~₹524
• R2: ~₹527
• R3: ~₹531
➡️ Levels where selling pressure may emerge if price rallies.
Support Levels:
• S1: ~₹516
• S2: ~₹513
• S3: ~₹509
➡️ Key intraday levels where buyers may step in on pullbacks.
📉 Today’s Range & Observations
Day’s High: ~₹497–₹498
Day’s Low: ~₹477–₹478
➡️ CONCOR is trading nearer its session low, showing short‑term selling pressure.
52‑Week Context:
• 52‑week low ~₹472–₹478
• 52‑week high ~₹652 (prior broader trend)
📌 How Traders Use These Levels (1 Day Time Frame)
Bullish Scenarios (intraday):
✔ If price breaks above Pivot (~₹520) with volume → potential move toward R1 ~₹524 and beyond.
✔ Strength above R1/R2 indicates buyers stepping in.
Bearish Scenarios (intraday):
✔ Price staying below pivot and failing at R1/R2 → continuation lower.
✔ Breakdown below S1 (~₹516) and S2/S3 amplifies downside pressure.

HINDZINC 1 Day Time Frame 📌 Current Price (intraday basis):
• ~ ₹667–₹670.8 (range seen today) with highs near ~₹694 and lows near ~₹652.65 earlier in the session.
📈 Intraday Pivot Levels (Daily)
These are calculated from recent price action and are widely used by traders to gauge intraday support and resistance:
📊 Pivot & Levels (Standard Daily)
• Pivot Point (PP): ~₹705.45
• Resistance
• R1: ~₹713.35
• R2: ~₹725.70
• Support
• S1: ~₹685.20
• S2: ~₹672.85
• S3: ~₹664.95
📍 Central Pivot Range (CPR)
• Top CPR: ~₹695.32
• Middle CPR: ~₹693.10
• Bottom CPR: ~₹690.88**
(Note: Pivot and CPR may shift slightly as market updates.)
📍 Summary – 1D Intraday Levels
Level Price (₹) Role
R2 ~725.70 Major upside resistance
R1 ~713.35 Near‑term resistance
Pivot ~705.45 Key directional trigger
CPR Top/Mid/Bottom ~695–690.9 Important intraday range
S1 ~685.20 Near‑term support
S2 ~672.85 Secondary support
S3 ~664.95 Lower support zone

DIXON 1 Day Time Frame 📉 Intraday Price Action (Today’s Range)
Day’s Range: ~₹10,274 – ₹10,790
This indicates where the stock has been trading so far today.
📊 Key Intraday Levels for 1‑Day Time Frame
🟢 Support Levels
S1: ~₹10,545 – ₹10,550
S2: ~₹10,359 – ₹10,360
S3: ~₹10,016 – ₹10,020
🔴 Resistance Levels
R1: ~₹11,070 – ₹11,075
R2: ~₹11,410 – ₹11,420
R3: ~₹11,600 – ₹11,605
These pivot‑derived support/resistance levels are typical for intraday reference (classic pivot methodology).
🧠 How to Use These Levels (Intraday)
Bullish bias: A sustained break above R1 ~₹11,070 with volume can open moves toward R2 ~₹11,410.
Bearish bias: If price loses S1 ~₹10,545, next support guards are S2 ~₹10,360 and S3 ~₹10,016.

IOC 1 Month Time Frame 📌 CURRENT PRICE (as of 22 Jan 2026)
IOC share price: ~₹159.9 per share (NSE/BSE).
📊 1‑Month Technical Levels (Current & Accurate)
Resistance (Upside Levels)
These are levels where price may find selling pressure in the near term:
R1 – Immediate Resistance: ~₹160.6–₹162.5
R2 – Mid Resistance: ~₹162.5–₹163.9
R3 – Higher Resistance: ~₹164–₹165.2
A broader longer‑range resistance zone near ₹170–₹171+ remains significant if the market strengthens.
Why these matter:
Resistance levels show where the stock has historically paused or reversed on recent charts — useful for targets or exits.
Support (Downside Levels)
These are key near‑term supporting price zones:
S1 – Immediate Support: ~₹156.8–₹159.4
S2 – Secondary Support: ~₹154.7–₹157.9
S3 – Deeper Support: ~₹152.9–₹155.0
Note: If price breaks below ~₹155, it could signal further weakness in the short term.
🧠 How to Use These Levels
Swing traders: Use support zones for entry zones and resistance levels as targets.
Breakouts: A clear close above ₹164–₹165 could open room toward the ₹170+ zone.
Breakdown: A close below ₹155 could escalate selling into deeper support.

HINDCOPPER 1 Month Time Frame 📊 Current Reference Price
The stock is trading around ₹540 – ₹560 on the NSE today.
🧠 1‑Month Timeframe Key Levels
📈 Resistance (Upside Barriers)
These are levels where the stock might face selling pressure or pauses if it continues higher:
1. ₹570 – ₹575 — Immediate near‑term resistance zone (recent highs).
2. ₹580 – ₹585 — Next resistance cluster above current price — psychological plus pivot area.
3. ₹595 – ₹600+ — Extended upside target if price breaks above the near zone.
Interpretation: A daily/weekly close above ~₹575–₹580 can confirm strength on the 1‑month chart and open the move toward ~₹600+.
📉 Support (Downside Floors)
These are levels where buyers may step in if price corrects:
1. ₹522 – ₹525 — Near pivot support on medium timeframe.
2. ₹500 – ₹510 — Secondary support zone that has seen demand historically on pullbacks.
3. ₹480 – ₹490 — Deeper short‑term support — a key level if price weakens further.
Interpretation: Holds above ~₹520–₹525 are bullish for the 1‑month swing; breaks below that raise risk of deeper pullback toward ₹500 or lower.
✍️ 1‑Month Trading Perspective (Short Summary)
📌 Bullish Scenario
Sustained daily closes above ~₹575–₹580 → watch ₹590–₹600+ as next short‑term targets.
📌 Neutral / Range Scenario
Price consolidates between ₹525 and ₹575 — likely choppy movement before next directional breakout.
📌 Bearish / Correction Scenario
Close below ~₹522–₹525 → deeper support zones around ₹500–₹490 may get tested.
⚠️ Important Notes
✅ These are technical reference levels, not buy/sell recommendations.
✅ Price action can change quickly with market news, global copper trends, or broader index moves (e.g., Nifty/commodity dynamics).

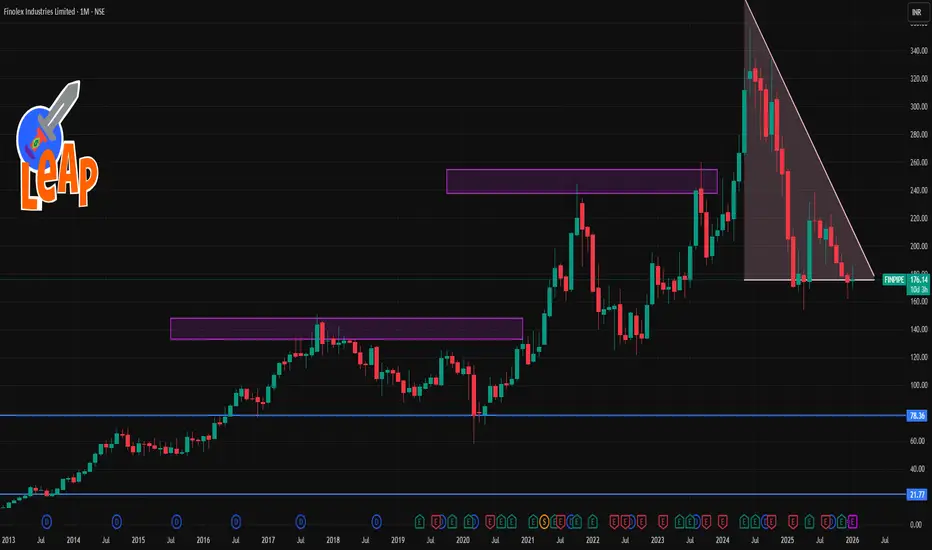
FINPIPE 1 Month Time Frame📊 Current Context
The share has been moderately positive over the past month (~+5–8% gains) in recent price data.
Recent share price (late Jan 2026) is near ₹175–177 levels.
📈 Key Levels (1‑Month Timeframe)
🔹 Resistance Levels
These are levels where the price may face selling pressure:
1. ~₹177–179 — Immediate resistance seen on short‑term pivot structure.
2. ~₹185–189 — Next meaningful resistance zone based on recent moving average clusters (20–50 day EMAs/SMAs).
3. ~₹194–198 — Higher resistance around 50–100 day average / upper consolidation of the last month/quarter.
Break above ₹185–189 with volume could signal a stronger short‑term uptrend continuation.
🔻 Support Levels
Important price floors where the price may find buyers:
1. ~₹173–175 — Near short‑term support and recent intraday pivot levels.
2. ~₹169–170 — Lower support seen from short swing lows over the past month.
3. ~₹164–165 — Deeper support from prior month low levels before recent recovery. (Estimated from recent historical lows.)
A close below ~₹169 on daily charts could indicate weakening short‑term structure.
🗺️ Trading Mindset (not financial advice)
Bullish view: A sustained move above ₹185–189 with increased volumes may target higher resistance near ₹195+.
Bearish view: A close under ₹170–169 could restart short‑term weakness toward lower support levels.
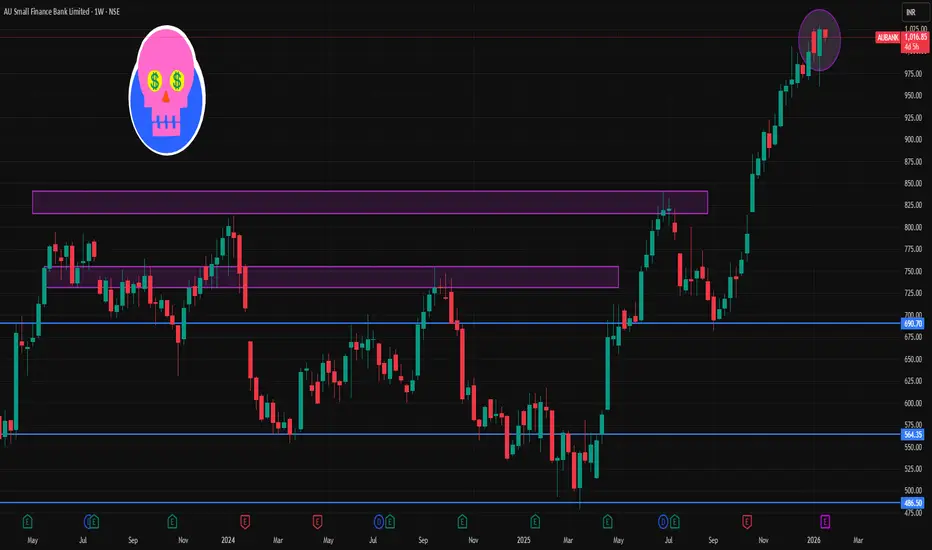
AUBANK 1 Week Time Frame 📌 1‑Week (Current) Key Levels
📍 Current Price Context
The stock has been trading around ₹1,020–₹1,030 area recently on NSE technical feeds.
🧱 Resistance Levels (Upside Targets)
1. Immediate Resistance (R1): ~₹1,050.35 – first barrier on the upside.
2. Major Resistance (R2): ~₹1,075.30 – next meaningful supply zone.
3. Higher Resistance (R3): ~₹1,120.65 – extended bullish breakout territory.
🛡️ Support Levels (Downside Defenses)
1. Immediate Support (S1): ~₹980.05 – crucial for weekly structure.
2. Major Support (S2): ~₹934.70 – deeper correction zone if S1 breaks.
3. Lower Support (S3): ~₹909.75 – extended bearish support for the week.
📊 Weekly Trading Range Projection
Bearish range: ~₹909–₹980
Bullish range: ~₹1,050–₹1,120 +
Price needs to hold above ₹980 weekly close to maintain bullish bias for the week.
📈 Trend & Indicators (Weekly)
Moving averages and oscillators on short‑term charts show neutral to mildly bullish momentum around ₹1,020–₹1,030.
EMA & SMA structures on daily charts support trend continuation if above key moving averages.
🔎 How to Use These Levels This Week
📌 Bullish setup:
Break and sustain above ~₹1,050 → potential run to ~₹1,075 → ₹1,120.
📌 Bearish setup:
Close below ~₹980 support → target ~₹935 → ₹910 on a deeper correction.
📌 Neutral / Swing range:
Between ₹980 and ₹1,050 → sideways action and range trades.