BALRAMPUR trading at support zoneThe strong hammer kind of candle hints stock is trying to bounce from strong support.
The stock may test the upper trendline resistance or may give breakout.
This would qualify risk reward kind of swing entry with small SL..!!!
Pennant

Graphite India - Triangle PatternGraphite India looks good above 645 to buy and hold for the long time.
Targets are 715-815-940.
Buy and accumulate for long time, buy on every dips.
Company doing good work and giving better profit.

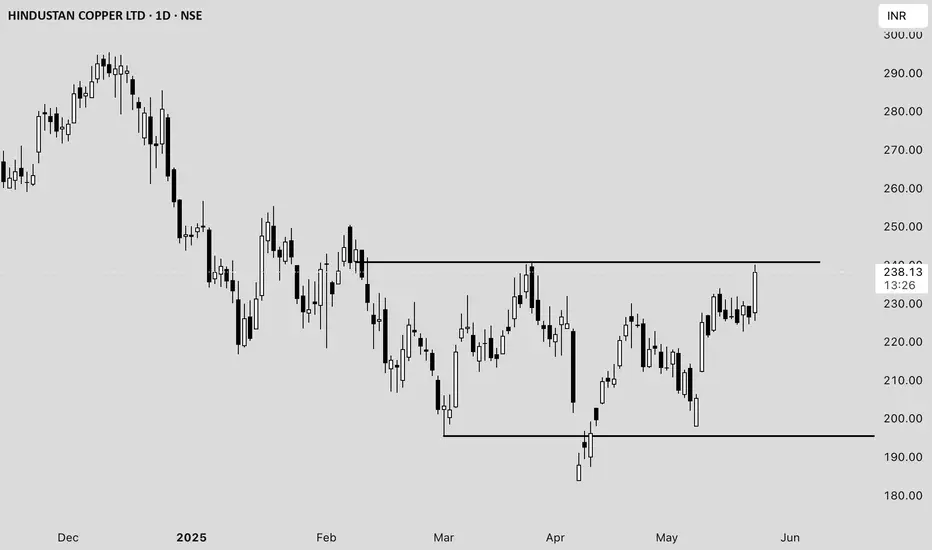
Hindustan Copper Ltd. (HINDCOPPER) Price Analysis **Date:*#### **Current Price and Intraday Movement**
- **Latest Price:** ₹237.98 (+5.09% / +₹11.52)
- **Day’s Range:** ₹225.50 – ₹240.10
- **Open:** ₹227.60
- **Previous Close:** ₹226.46
- **Volume:** 1.63 crore shares (well above average daily volume of 55.89 lakh)
#### **Technical Overview**
- **52-Week Range:** ₹183.82 – ₹381.90
- **50-Day Average:** ₹216.99
- **200-Day Average:** ₹260.58
- **Market Cap:** ₹23,013 crore
- **P/E Ratio:** 57.48
- **EPS:** ₹4.14
#### **Recent Performance and Trends**
- **Short-Term Trend:** The stock surged over 5% today, outperforming its sector and showing strong buying interest .
- **Volume Spike:** Today’s volume is nearly triple the average, indicating heightened trader participation .
- **Technical Position:** The stock is trading above its 50-day moving average but remains below the 200-day average, suggesting a recovery from recent lows but still under medium-term resistance .
- **Support/Resistance:** Immediate resistance is near ₹240–₹249 (upper circuit), with support at ₹225 and ₹216 (50-DMA) .
#### **Fundamental Snapshot**
- **Valuation:** High P/E ratio (57.48) signals expensive valuation relative to earnings .
- **Profitability:** EPS at ₹4.14; profit margins have been under pressure.
- **Industry Position:** Hindustan Copper is India’s primary copper producer, with exposure to global copper price trends and domestic infrastructure demand.
#### **Outlook**
- **Short-Term:** Strong momentum and volume could drive further upside if it breaks above ₹240, but overbought conditions may trigger profit booking near resistance.
- **Medium-Term:** Needs to sustain above the 200-DMA (~₹260) for a confirmed trend reversal.
- **Risks:** High valuation and recent volatility; global commodity price swings can impact earnings.
---
**Summary:**
Hindustan Copper is showing robust short-term momentum with strong volume and price gains, but faces resistance near ₹240–₹249. The stock remains fundamentally expensive, and investors should watch for sustained moves above the 200-DMA for a longer-term bullish signal .
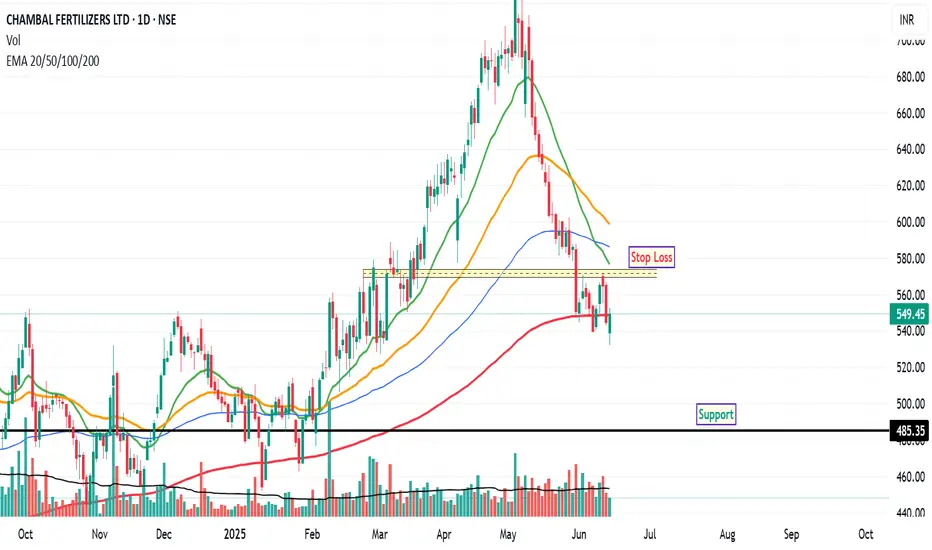
Chambal Fertilizers: Exhibits Short-Term WeaknessChambal Fertilizers has recently displayed signs of short-term weakness on its daily chart. The price action indicates a struggle to maintain a position above the 200-day EMA, a widely recognized long-term trend indicator. Despite multiple attempts to close above this crucial level, the stock has been unable to sustain any significant upward momentum, suggesting a prevailing bearish sentiment among market participants.
From a momentum perspective, both the RSI and MACD indicators are currently positioned in what is typically considered the oversold territory. This could imply that the stock has experienced a period of significant selling pressure.
Should the current trend persist, the stock may potentially retest the ₹485 level, which could act as a significant support zone. Conversely, a potential shift in market dynamics could occur if the stock manages to close and sustain above its 200-day EMA for a minimum of two consecutive trading sessions. In such a scenario, traders might consider a revised risk management strategy, with potential stop-loss levels in the range of ₹569 to ₹573 , based on recent price action and potential resistance.
Disclaimer: The information provided in this stock analysis is for informational and educational purposes only and should not be construed as financial advice. Always seek the advice of a qualified financial advisor or conduct your own thorough research before making any investment decisions.
Cartrade Pyramid Set up1. Trend - Bullish
2. Double Bottom reversal from retracement
3. High High & Higher low formation continues
4. Strength - strong

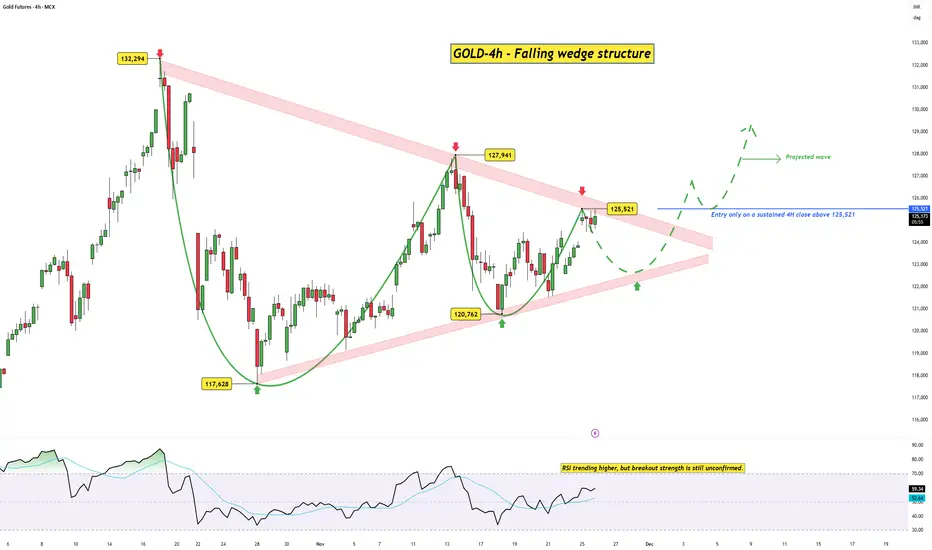
GOLD – 4H | Falling Wedge Structure Near BreakoutGold has been compressing inside a converging falling wedge , a pattern that typically signals waning bearish pressure and an upcoming bullish break. The structure has been developing for several weeks, with each swing clearly showing a loss of momentum from sellers and a stronger defense from buyers at progressively higher lows.
The wedge is now approaching its apex, and price is pressing against the upper boundary. While this setup carries a bullish tilt, confirmation is still critical before acting.
Why this structure matters
This is a Converging Falling Wedge (Bullish) pattern, defined by:
Sellers losing momentum on each downswing
Buyers defending higher lows , tightening the structure
Compression building toward the apex , creating stored energy
Breakouts typically hitting the upper rail first
Confirmation occurring only on a close above the last swing high
In this case, the last swing high sits at 125,521 , aligning perfectly with the wedge’s upper rail.
Only a sustained 4H close above 125,521 would confirm that the market has absorbed overhead supply and is ready to transition into a higher timeframe move.
RSI Check
RSI is trending higher but hasn’t yet signaled full breakout momentum. A push above the 60–65 zone would strengthen the bullish case and support continuation after the breakout.
Trade Plan
Trigger :
Entry only on a sustained 4H close above 125,521 .
This keeps you aligned with pattern confirmation and avoids premature entries inside compression.
Upside path:
A breakout could initially retest the wedge boundary before starting the projected upward leg toward higher resistance zones.
Summary
Gold is displaying a well-defined falling wedge with clear signs of seller exhaustion and buyer strength. The structure leans bullish, but the move needs to be validated through a confirmed break above 125,521 . Until then, the wedge remains a compression zone — not a breakout.
Disclaimer: This analysis is for educational purposes only and does not constitute investment advice. Please do your own research (DYOR) before making any trading decisions.
Bat is real bat hahahaBINANCE:BATUSD
whale want to draw real bat picture 😅
all information in chart image.
please do your own research before taking any trade.
i am not financial advisor
risk is real stay practical
please feel free to ask any questions

#INDUSTOWER – Bullish Pennant on Monthly Chart#IndusTower | CMP: 402.20
A strong vertical rally built the pole , and price is now compressing inside a tight bullish pennant right below a multi-year resistance zone. Consolidation is nearly complete — big move loading .
🛡 Supports: 339–335 / 313–309 (Major Zone)
🚧 Resistances: 430 / 460 / 500 (ATH)
Dips toward 335 can be considered.
🎯 Pennant Breakout Targets (Pole Projection):
• 560
• 730+ (~ 78% from CMP)
A breakout above 500 could trigger the next explosive leg up.
🚀 High-probability bullish continuation setup. 🔥
#IndusTower #BullishPennant #PriceAction #ChartPattern #SwingTrading #LongTerm
📌 #Disclaimer: This analysis is shared for educational purposes only. It is not a buy/sell recommendation. Please do your own research before making any trading decisions.

INDIANB Price ActionAs of July 24, 2025, Indian Bank (INDIANB) is trading around ₹639, showing strong momentum after recovering from recent declines. The stock is close to its 52-week high of approximately ₹658, indicating a robust upward trend in the public sector banking space.
The bank has demonstrated consistent financial growth, with a 14% year-on-year increase in both deposits and advances, currently standing above ₹63,000 crore and ₹53,000 crore respectively. Total business volume grew to over ₹1.16 lakh crore. Net profit for the last financial year increased by 11% to around ₹1,124 crore.
Asset quality has improved, with gross non-performing assets (NPA) reducing to 3.09% and net NPA to 1.25%. The provision coverage ratio is strong at 78%, reflecting prudent risk management. Net interest margin (NIM) is stable at approximately 3.6%, supporting healthy core profitability. The cost-to-income ratio is near 48%, indicating moderate operational efficiency.
Return on assets (ROA) and return on equity (ROE) stand around 1.55% and 12.6% respectively, highlighting solid returns relative to asset base and shareholder equity. Capital adequacy ratios remain comfortable under Basel III norms.
Technically, Indian Bank’s stock is trading above major moving averages (5, 20, 50, 100, 200 days), confirming positive price momentum. Year-to-date, the stock has delivered over 21% returns, outperforming many peers in the public sector banking segment.
Overall, Indian Bank presents a strong growth and stability profile with improving asset quality, stable margins, and expanding business volumes, making it an attractive candidate in the public banking sector for medium to long-term investors.

Flagpole & Breakout – Bullish Continuation Setup🔎 Overview
The Flagpole & Breakout setup is a bullish continuation pattern that forms during strong uptrends.
It represents a temporary pause in momentum where prices consolidate after a sharp upward move (flagpole) — before continuing higher.
This pattern highlights a healthy market structure: strong impulse → controlled pullback → renewed breakout.
____________________________________________________________
📔 Concept
• The pattern starts with a sharp upward surge (Flagpole) driven by strong buying momentum.
• After this, price enters a consolidation phase that resembles a small symmetrical triangle or a downward-sloping flag.
• Buyers and sellers reach temporary equilibrium before the next impulsive leg.
• A breakout above the upper trendline confirms the continuation of the prior uptrend. ____________________________________________________________
📌 How to Use
✅ Validation → When price closes above the upper trendline, confirming bullish continuation.
❌ Devalidation → If price breaks below the lower support line, pattern fails.
____________________________________________________________
📊 Chart Explanation
• Flagpole → Represents the strong initial buying momentum driving prices higher.
• Pennant / Flag → The consolidation phase where the market takes a breather before the next move.
• Upward Move → Indicates powerful buyer strength leading into the pattern.
• Consolidation Zone → A tight price range where buyers and sellers balance before breakout.
• Breakout → A bullish signal confirming the continuation of the prior trend.
• Key Insight → The stronger the flagpole and the tighter the consolidation, the higher the breakout reliability.
____________________________________________________________
👀 Observation
The flag pattern reflects market psychology — after a surge, traders take profits, causing short-term consolidation.
Once sellers are absorbed, a breakout occurs, attracting new momentum buyers and triggering trend continuation.
High volume during the breakout adds confirmation and strength to the setup.
____________________________________________________________
💡 Conclusion
Flag and Pennant formations are among the most reliable continuation patterns in technical analysis.
Recognizing them early allows traders to join the trend with defined risk and reward setups .
____________________________________________________________
⚠️ Disclaimer
📘 For educational purposes only.
🙅 Not SEBI registered.
❌ Not a buy/sell recommendation.
🧠 Purely a learning resource.
📊 Not Financial Advice.

Quess Corp - Monthly - Make or BreakWill Quess Corp able to give multifold return in next 6-8 month ? ?
CMP : ~234
SL M Close : 225
Up Side ?
expert's please share your thoughts :)

TFCILTD Price Action## TFCILTD – Price Analysis (August 2025)
### Price & Market Metrics
- **Current share price:** ₹297.75 (as of August 13, 2025; latest close).
- **Market capitalization:** Approx. ₹2,757crore.
- **52-week range:** ₹122.32 (low) – ₹303.50 (high); new high reached in early August.
- **All-time low:** ₹4.45 (Sep 2001).
- **All-time high:** ₹303.50 (July–August 2025).
- **Day’s range (Aug 13):** ₹282.60–₹303.50.
- **Volume:** 3,955,421 shares traded on Aug 13.
- **Beta:** 1.24, showing moderate volatility.
### Returns & Volatility
- 1-week gain: Around 8.25%.
- 1-month gain: Approximately 4%.
- 1-year return: Roughly 67%.
- Daily moves of 5-6%; volatility is moderate to high recently.
### Valuation
- **Price/Earnings (P/E) ratio:** 31.10–31.47 (much higher than sector average of ~11.4).
- **Price/Book (P/B) ratio:** 2.69–3.14.
- **Book Value Per Share:** ₹94.80–₹110.54.
- **Dividend yield:** About 1.01%; ex-dividend date August 14, 2025.
- **EPS (TTM):** ₹9.46–11.77.
- **Intrinsic value estimate (GF Value):** ₹152.95—current price trades at a 95% premium over this fair value estimate.
### Financial & Business Highlights
- Revenue (TTM): ₹1.58billion.
- Net profit (TTM): ₹1.09billion.
- Net profit margin: Approximately 69%.
- Debt/Equity Ratio: ~70.9% (moderate leverage).
- Gross margin: 99% (financial lending business).
### Technical & Sentiment Overview
- Stock made a new all-time high in early August.
- Trend is bullish, supported by heavy volumes.
- Dividend payout scheduled for September 20, 2025.
- Overall business cited as "average growth, high valuation" in recent analysis.
***
## Summary
TFCILTD is trading near record highs at ₹297.75, well above its estimated fair value and sector norms. The stock’s valuation metrics—particularly its P/E and P/B ratios—are elevated, reflecting strong price momentum and investor enthusiasm. Financial performance shows very high profit margins and reasonable growth, but the premium to intrinsic value signals potential overvaluation risks. Volatility and recent price swings are moderately high. Investors should weigh current optimism and momentum against valuation concerns and sector returns.

Cupid Price ActionCupid Limited’s stock is trading around ₹158 as of early August 2025, having recently hit new record highs above ₹162. The share price surged over 45% in the past month and is up more than 100% year-to-date, significantly outperforming both its FMCG peers and the broader market. Volatility is high: daily moves of 5–6% are common, and intraday swings have reached as much as 8%. The stock is trading well above all major moving averages, reflecting strong buying momentum.
Long-term performance is outstanding: over 1,300% returns in three years and more than 2,100% across ten years. That said, short-term technical signals show that Cupid is “overbought” (very high RSI) and potentially due for a corrective pullback, though robust momentum could drive further gains. The high PE ratio near 104 and price/book around 21 indicate a rich valuation versus historic averages and sector norms.
Market capitalization is about ₹4,240 crore. Despite being expensive on most valuation models, the company is seen as fundamentally strong: steady operational performance, minimal debt, and no significant pledged shares. The company’s next earnings announcement is due August 8, and recent market behavior suggests results can drive significant further volatility.
Compared to other FMCG names, Cupid’s returns are exceptionally strong while most large and mid-cap sector players (like HUL, Dabur, and Colgate) have posted declines over the past year. Liquidity has increased with heavy volume spikes during rallies, supporting the uptrend.
In summary, Cupid is a high-momentum, high-volatility small-cap outperformer exhibiting extraordinary multi-year returns. The stock trades at elevated valuations and, while short-term corrections may occur, its leadership in the sector and technical strength continue to attract aggressive buyers.

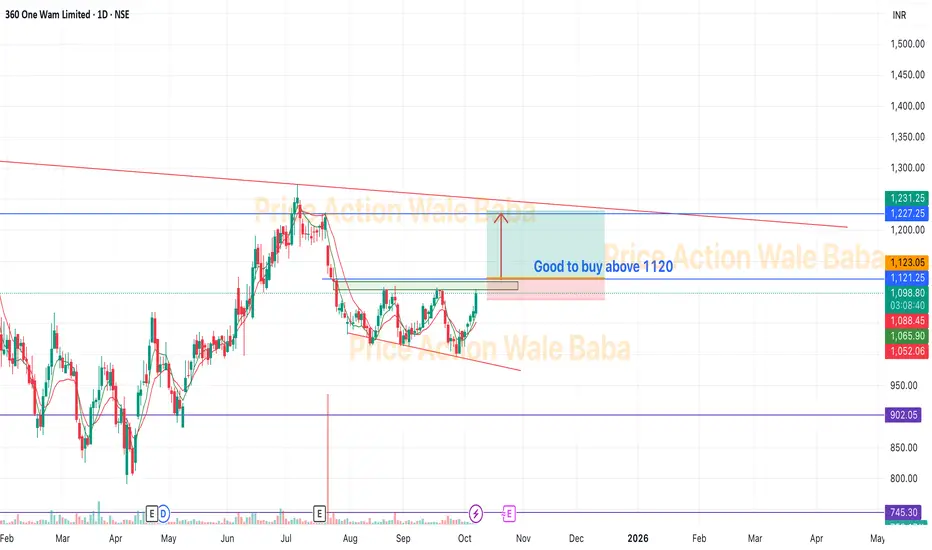
360ONE360ONE is near resistance.
It has breakout above 1120. So it will be good if you accumulate above 1120 then target will be 1200 in week after breakout.
Good to sell on 1200 as we can see some reversal to re-test breakout and make support on 1100-1120.
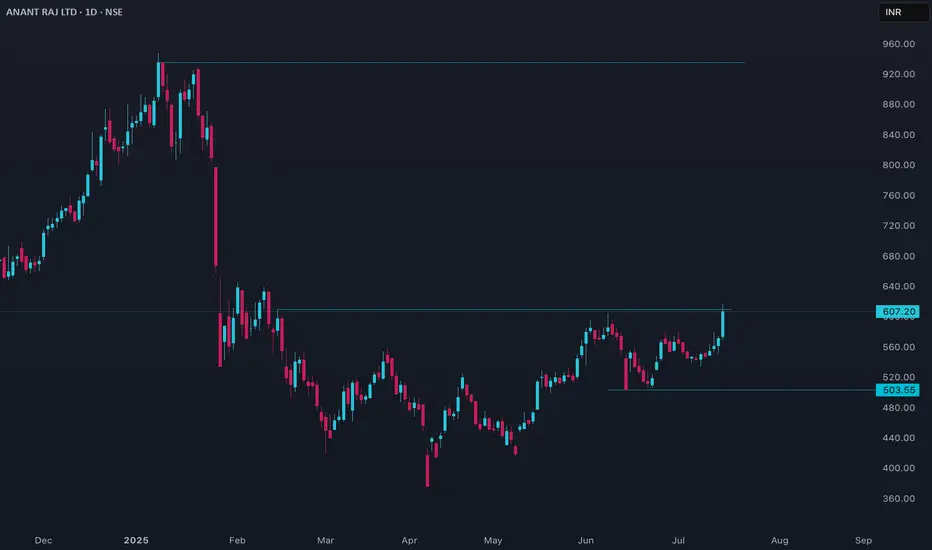
ANANTRAJ Price Action
## Current Price & Performance
- Last close was ₹607.20.
- Over the past week, the stock is up more than 10%, showing strong short-term momentum.
- Over the past year, it has gained nearly 25%, but suffered a sharp 32% drawdown over six months.
- The 52-week price ranged from ₹376.15 to ₹947.90, reflecting high volatility.
## Valuation and Metrics
- ANANTRAJ trades at a high valuation, with price-to-earnings and price-to-book ratios above typical industry averages.
- Its market capitalization puts it among the stronger players in the real estate sector.
- Key valuation multiples such as PE and EV/EBITDA are elevated, indicating investors are paying a premium for expected growth.
- The stock’s PEG ratio suggests its growth is reasonably in line with its price.
## Analyst Sentiment and Targets
- Most analysts rate the stock as a strong buy, highlighting strong upside potential with target prices higher than the current market price.
- The consensus one-year price targets suggest potential returns ranging between 24% and 49% from current levels.
## Technical & Fundamental Observations
- Compared to sector peers, its PE is lower than certain high-flyers but remains above the overall industry average, making it expensive by historical standards.
- Return on equity has hovered around 8.5% recently, with efficient operating and employee costs supporting margins.
- A modest dividend has recently been declared.
- A slight increase in promoter holding indicates management confidence.
## Risk Factors
- Substantial volatility in recent months may raise concerns for risk-averse investors.
- Both intrinsic value models and relative measures suggest the shares may be overvalued by over 20% at current prices.
- While momentum and sentiment are positive, valuation risk remains a key factor for new investors.
## Conclusion
ANANTRAJ is benefiting from strong momentum and positive sentiment, with analysts forecasting further upside. However, current valuation levels are high, and investors should carefully weigh the potential for price appreciation against the risk of overvaluation and ongoing volatility. Consider both the fundamental strengths and the elevated price multiples before making an investment decision.
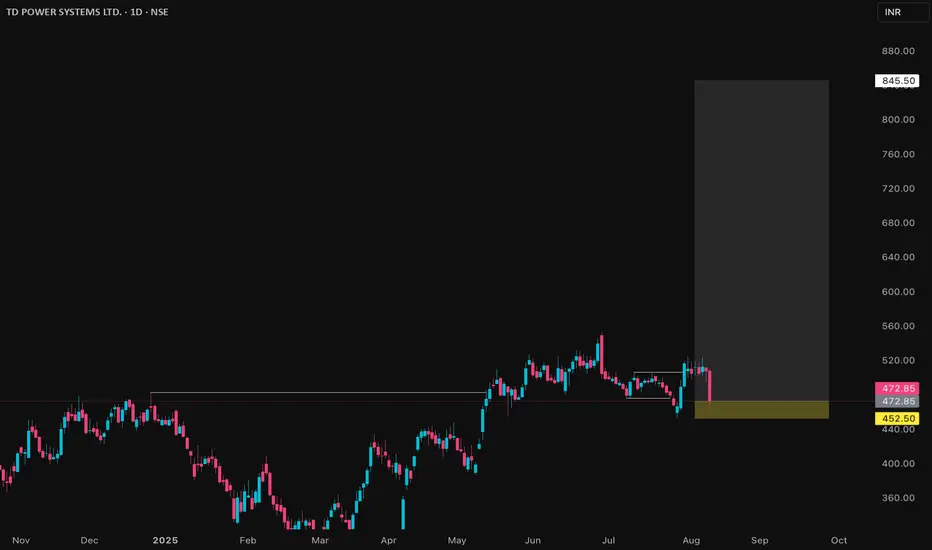
TDPOWERSYS Price Action## TDPOWERSYS Price Details (as of August 8, 2025)
### Market Metrics
- Current share price is ₹472.85.
- Market capitalization is ₹7,385crore.
- The 52-week price range is ₹293 to ₹552.75.
- Its all-time low was ₹14 in March 2020; all-time high is ₹552.75 in June 2025.
### Returns & Volatility
- 1-month return: -1.48%.
- 1-year return: about 18%-20%.
- 3-year return: over 300%.
- 5-year return: over 1,900%.
- Weekly volatility is 6%, which is above average.
- Beta is 2.04, indicating higher risk and volatility versus the overall market.
### Valuation
- Price/Earnings Ratio: 42.31, higher than sector average.
- Price/Book Ratio: 8.58, above sector average.
- Dividend yield is 0.25%.
### Company Fundamentals
- Trailing 12-month revenue: ₹13.77billion.
- Net Profit Margin: 13.75%.
- EPS: ₹12.12.
- Gross margin: 34.13%.
- Debt to equity: 1.4%, showing low leverage.
### Valuation Analysis
- Estimated intrinsic value is ₹258.02.
- Current price is about 45% over this value, meaning the stock is overvalued.
### Qualitative Notes
- Strong profitability and cash flow, but price reflects high growth expectations.
- High volatility, especially in the short term.
- Dividend policy: small but regular.
- Recent technical signals showed buy recommendations, but the stock has been correcting lately.
**Overall:** The stock is highly priced relative to its value and historical norms, with impressive growth but also increased volatility and a potential for continued price correction.
MEDANTA Price ActionMedanta (Global Health Ltd) is currently trading in the ₹1,300–₹1,335 range, having shown a notable run-up over the past six months, but with increased volatility in recent weeks. The stock reached a recent high near ₹1,393 and a low around ₹935 during the past year.
Fundamentally, Medanta continues to deliver robust revenue growth: annual revenues for FY25 rose to ₹3,692 crore, up approximately 13% from the previous year. Operating profitability remains strong, with margins in the 23% range and net profits exceeding ₹480 crore for the latest fiscal year. However, the most recent quarter saw a profitability dip due to a non-recurring expense, reflecting some variability in the bottom line.
On valuation, Medanta trades at a high price-to-earnings (P/E) ratio of more than 73 and a price-to-book (P/B) above 11, both of which are elevated compared to sector averages. This premium reflects market optimism about its growth prospects but also limits the scope for immediate, significant upside. The company has a modest dividend yield and consistently generates healthy cash flows, contributing to financial strength.
The outlook from analysts remains moderately positive: one-year price targets are clustered around ₹1,300–₹1,500, with the company expected to benefit from long-term sector growth and its strong operating metrics. Near-term, the share price may consolidate after recent gains, with moves likely guided by the next round of earnings and overall market sentiment. Medanta’s key strengths are scale, profitability, and discipline, but its premium valuation requires steady execution and increasing returns to justify further appreciation.

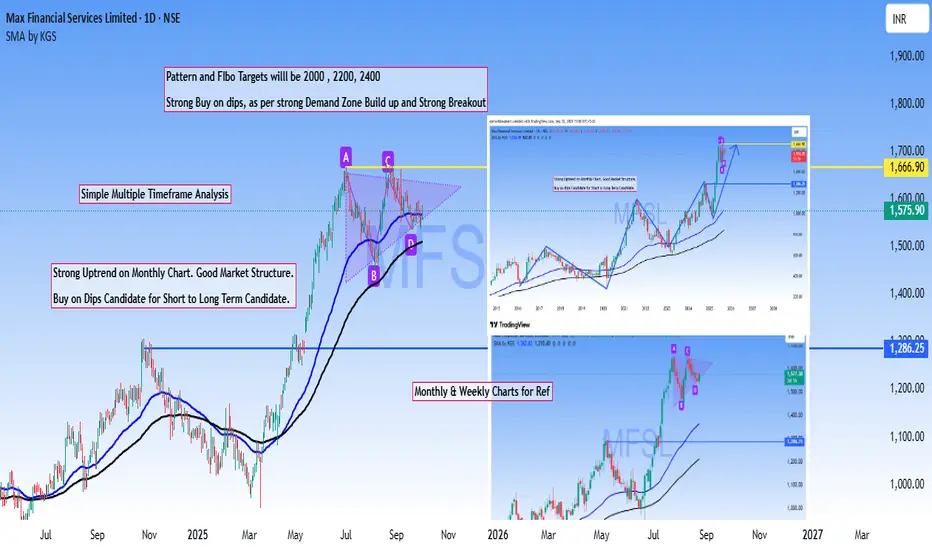
MFSL Multi time frame AnalysisMulti-timeframe confluence analysis offers traders a robust edge through straightforward yet highly effective methodology.
Based on that MFSL is a strong Buy on dips stock based on powerful breakout of previous ATH and the current market structure.
Targets are derived from #Pattern #breakout and #Fibonacci levels.
Bullish Pennant in formation.
Disclaimer: Above analysis shared for educational purpose only.
NEWGEN – Demand/Supply Zones and VCP Pennant Formation This chart analyzes NEWGEN’s price action around significant demand and supply zones, with a focus on the ongoing pennant/VCP (Volatility Contraction Pattern) base near support. Key moving averages provide context for recent trend shifts, while the technical summary and quarterly performance box support deeper analysis. Watch for breakout moves above the pennant resistance or further demand zone reactions as these will determine the next directional bias.

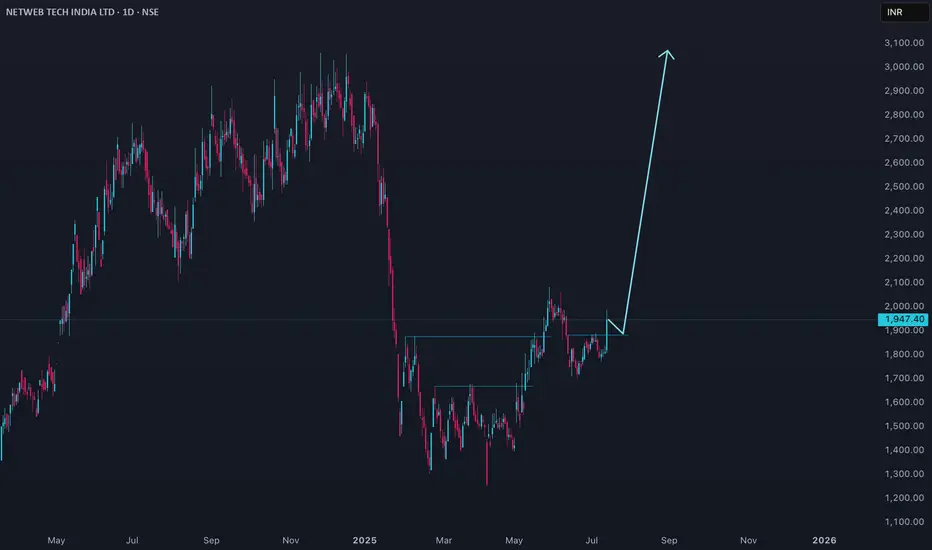
NETWEB Price actionNetweb Technologies (NETWEB) is trading at ₹1,947.40 as of July 11, 2025. The stock has shown a strong short-term recovery, up about 7.4% in the last session and nearly 6.8% over the past week, but it remains down by over 25% in the past six months. The 52-week high is ₹3,060 and the low is ₹1,251.55.
Valuation-wise, NETWEB is trading at a high price-to-earnings ratio (around 90–96) and a price-to-book ratio near 20, indicating a premium valuation. The company’s market capitalization is approximately ₹11,000 crore. Promoter holding has slightly decreased in the recent quarter.
For the near term, technical targets suggest resistance around ₹2,000–2,040 and support in the ₹1,750–1,850 range. Analyst forecasts for the next year place price targets between ₹1,824 and ₹2,805.
Fundamentally, the company is considered overvalued at current levels, despite strong recent profit growth. The stock’s premium valuation and recent volatility suggest caution for new investors, with further upside dependent on continued earnings momentum and broader market sentiment.
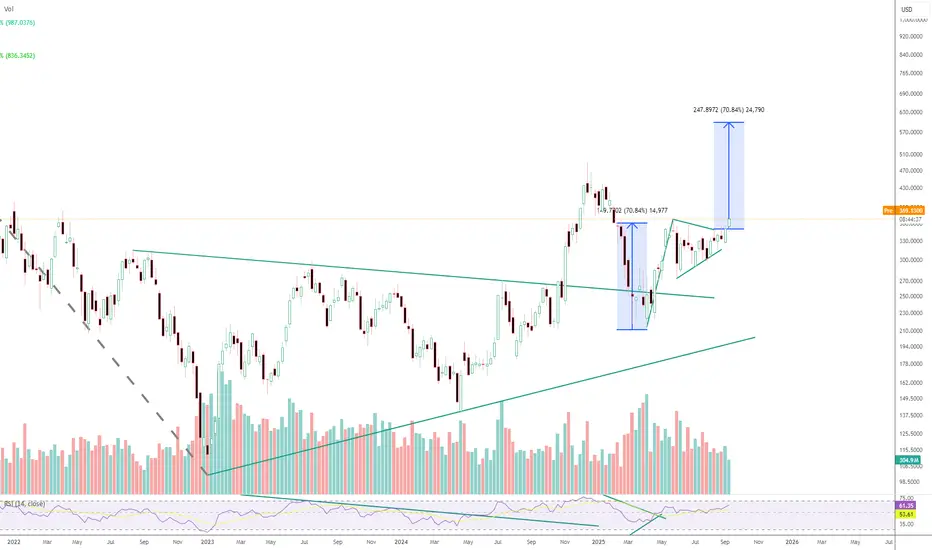
Tesla - Flag & Pennant Pattern BreakoutTesla breaking out of a Flag & Pennant Pattern that may take it to new all time highs
PRAENG Price Action
### Market & Price Metrics
- **Current share price:** ₹17.81 as of August 8, 2025.
- **Market capitalization:** ₹125crore.
- **52-week range:** ₹12.85 (low) to ₹22.80 (high).
- **Recent movement:** Price has declined by about 2.7% in early August, reflecting ongoing downward trend.
### Returns & Volatility
- **1-month change:** Negative, with price down from approximately ₹19.9 in early July.
- **1-year trend:** Down over 49% from August 2024.
- **Price swings:** High volatility, often 3-5% daily moves.
### Valuation
- **PE Ratio:** Not meaningful due to consistent losses (latest EPS: -₹4.29 for FY 2025).
- **Book Value Per Share:** Estimated near ₹38 but reflecting asset sales.
- **Dividend yield:** Nil – no payouts in recent years.
### Company Fundamentals
- **Revenue (FY 2025):** ₹57.5crore, little change over previous year; long-term growth remains muted.
- **Net Profit Margin:** Deeply negative, with net loss of about ₹30crore for FY 2025.
- **EPS:** Negative, improved (less loss) from previous FY (-₹4.29 vs -₹5.57).
- **Net Worth:** ₹486crore.
- **Total Assets:** ₹839crore.
- **Debt/Leverage:** Total outside liabilities ₹352.8crore; interest coverage very weak.
### Cash Flow & Profitability
- **Operating cash flow:** Positive at ₹19.2crore for FY 2025.
- **Free cash flow:** Volatile — positive some years, negative in others.
- **Return on Equity (ROE):** Negative.
- **Return on Assets:** Negative, driven by losses.
### Business & Qualitative Notes
- **Growth:** Minimal and below industry norm; 5-year annual revenue growth less than 3%.
- **Market share:** Continues to decline.
- **Profitability:** Negative margins and earnings; unable to achieve sustainable profitability.
- **Dividend:** No payout record; losses preclude distributions.
- **Shareholding:** Promoters hold about 36.8%, retail and others 63.2%.
### Technical & Sentiment
- **Trend:** Bearish in recent months; repeated breakdowns at support levels.
- **Analyst view:** Sentiment remains negative — company lacks near-term growth catalysts; high risk.
***
**Summary:** PRAENG is a deeply distressed small-cap real estate company, trading near multi-year lows after sustained losses, high volatility, and deteriorating fundamentals. No dividends, weak sales trends, and negative returns underscore significant investment risk at current prices.

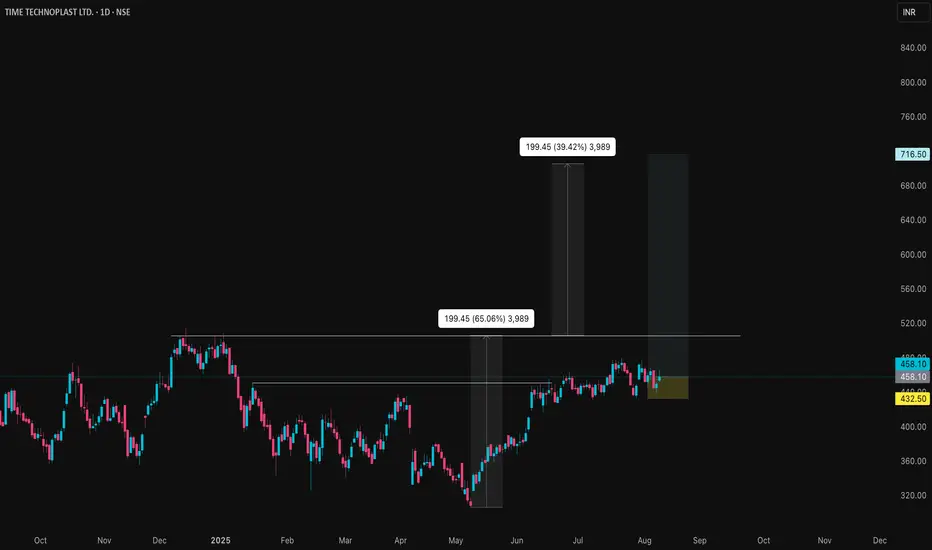
TIMETECHNO Price ction
### Market Metrics
- **Current share price:** ₹458.10.
- **Market capitalization:** ₹10,396crore.
- **52-week price range:** ₹306.60 (low) to ₹513.55 (high).
- **All-time low:** ₹17.55 (Feb 19, 2009).
- **All-time high:** ₹513.55 (Dec 13, 2024).
### Returns & Volatility
- **1-week change:** Down 1.98%.
- **1-month change:** Up 4.83%.
- **1-year return:** Up 43.18%.
- **Recent volatility:** Daily moves between ₹451.70 and ₹466.10 common.
- **Beta:** Not specified, but price swings indicate moderate volatility for sector.
### Valuation
- **Price/Earnings Ratio:** 26.79, above sector average.
- **Price/Book Ratio:** 3.88, also higher than sector average.
- **Dividend yield:** 0.55%.
### Company Fundamentals
- **Revenue (Trailing 12 months):** Approximately ₹54,570million.
- **Net profit margin:** 7.1%, improved over last year.
- **EPS (Trailing 12 months):** ₹17.10 (16.29% YoY growth).
- **Book value per share:** ₹118.21.
- **Return on Equity:** 13.3%.
### Growth & Profitability
- **Annual earnings growth:** 25% (past year), average 25.4% over 5 years.
- **Net profit for Q1 2025:** ₹10,952lakhs, up 18.6% YoY.
- **Free cash flow remains positive; margin improvement noted over 5 years.**
- **Return on assets:** 9.04%.
### Valuation Analysis
- **High PE and PB ratios indicate the stock is priced above sector averages.**
- **Recent buy recommendations from analysts; fair value status varies by source.**
### Qualitative Notes
- **Strong earnings and steady sales growth, but trading above intrinsic metrics.**
- **Growth momentum has slowed versus earlier years, though above industry norm.**
- **Stable dividend payout policy, but yield remains modest.**
- **Technical signals ranged from neutral to bullish in July and August 2025.**
**Summary:** The stock is trading at a high valuation given its growth history and sector performance. Investors should consider recent price corrections, volatility, and elevated PE/PB ratios before entering at current levels. The company maintains strong growth and profitability but is subject to valuation risk if sector trends reverse.