HFCL BY KRS CHARTS17th September 2025 / 9:21 AM
Why HFCL?
1. First of all, its second time it's in my radar, previously we had more than 40% Return on this one and still long-term Target has been still loading 225 Rs.
2. 1M TF is making Higher High with current price level previously it breaks from flag pattern and gave upside move.
3. As we cand see in chart i have mentioned FVG range for 1M tf which was expected fall to be fill that FVG and it did.
4. Further, along with FVG filling 1W & 1D tfs is showing bullish divergence within range.
5. Volume is above avg with Morning Star Candle Breakout showing more bullish signs.
SL & Target is mentioned ‼️
** Attached Previous View on HFCL also go check it out**
Pennystocks

IOCL - Investment Doubler - MultiTimeframe Analysis
**📊 Indian Oil Corporation (IOC) - Technical Analysis**
#Multiple timeframe analysis showing IOC at a critical juncture around ₹136-163 levels.
Key Observations:
- On an Yearly Chart, Prev Yearly candle attempt failed to do Breakout.
- On Half-yearly chart breakout confirmed and the stock retraced and bouncing back to Key Levels.
- On an Yearly chart the Previous leg which attempted to break Previous ATH has strong #Momentum - The Stock Bounce back on Major Demand Zone, signs of retracement complete.
- Current price: 163.67
- Multiple "Buy on Dips" opportunities identified across timeframes
- 2017 highs acting as reference resistance levels
- Target levels marked: Tgt 1 196.80, Tgt 2 220, Tgt 3 250, Tgt 4 280
- Conservative stop-loss suggested on candle closing basis (short-term)
Trading Strategy:
- Swing trading approach recommended
- #Investment Doubler potential noted on long-term chart
- Expecting 2017 yearly breakout on extended timeframe
DISCLAIMER:
This is for educational and informational purposes only. This is NOT investment advice. Trading and investing in stocks involves substantial risk of loss. Always conduct your own research and consult with a certified financial advisor before making any investment decisions. Past performance does not guarantee future results. The author/analyst is not responsible for any losses incurred from trading decisions based on this analysis.
#TradingView #IOC #IndianOilCorporation #StockMarket #TechnicalAnalysis #SwingTrading #NSE #IndianStocks #BuyOnDips #ChartAnalysis #BreakoutTrading #StockTrading #MarketAnalysis #Nifty #BSE #EquityTrading #ShareMarket #InvestingIndia #TradingSetup #PriceAction #SupportResistance #TrendAnalysis #DayTrading #PositionalTrading #StockTips #MarketOutlook #TechnicalChart #CandlestickPattern #BullishSetup #FinancialMarkets
💡 Remember: Trade at your own risk. Risk management is key to successful trading!

SRF LTD - Short term Investment#SRF Limited - Technical Analysis
Current Price: 2,927.30
Quick Overview
Strategy: Short to Long Term Investment
Pattern: Multi-year consolidation breakout (Jan'21-Feb'25) with successful retest
#Technical Setup
✅ Long Consolidation Breakout & Retest - 4-year base broken
✅ Buy on Dips - Current correction = opportunity
✅ Sorted EMAs - All moving averages bullish
✅ Higher Highs - Clean uptrend structure
#Key Levels
Support:
- 2,838 (Immediate)
- 2,720 (Strong)
- 2,400 (Major - Weekly SL)
Targets:
- T1: 3,163
- T2: 3,472
- T3: 4,049
Entry Zones:
- Primary: 2,850 - 2,950 (Current)
- Secondary: 2,720 - 2,800 (on dips)
Risk-Reward: 1:2.3 (to final target)
#Strategy - Build positions in tranches during dips. Hold for short term for optimal returns. Book partial at ₹3,163, hold core for higher targets.
Disclaimer: For educational purposes only. Not investment advice. Markets are subject to risks. Consult a SEBI-registered advisor before investing. Past performance doesn't guarantee future results.
#SRFLimited #LongTermInvesting #BreakoutTrading #TechnicalAnalysis #NSE #ChemicalStocks #PatiencePaysPremium #IndianStockMarket #PositionalTrading

Strong PSU Bank - Indian Bank - Strong BuyIndian Bank - Swing to Short-Term Investment Report
Current Price: 653.10
TECHNICAL SETUP OVERVIEW
Analysis Type: Monthly Chart | Investment Horizon: Short to Medium Term (6-18 months)
Key Observation: After a historic breakout from multi-year resistance, Indian Bank has established itself as a solid structure for accumulation with exceptional return potential.
BREAKOUT TIMELINE & PATTERN
Historical Resistance Battle (2018): Successfully tested 5 consecutive months.
Major Breakout (January 2024) Clean breakout above 2018 resistance level, Significance 6-year base breakout - high probability setup - Follow-through Strong momentum confirmed.
Bull flag Pattern formation, Price Range: 632-736. Building energy for next leg up
Structural Advantages:
1. Clean Breakout Pattern
- No false breaks or whipsaws
- Volume confirms genuine buying
2. Multiple Timeframe Confluence
- Monthly, weekly, daily all aligned bullish
- No conflicting signals
- High probability continuation
3. Measured Move Projections
- Targets based on historical patterns
- Flag pole height projects to 1,050+
- Conservative targets: 813-973
4. Fundamental Support
- PSU bank re-rating theme intact
- Improving asset quality
- Growing dividends (35% YoY growth)
- Strong Q4 profit growth (+31.56%)
Disclaimer: For educational purposes only. Manage risk appropriately and do your own research.
🎯 Trade Smart. Trade Safe. Accumulate Quality.

Cholafin Long - Investment Ideas & AnalysisTechnical Analysis : Cholamandalam Investment and Finance Co. Ltd.
Current Price: 1,610.30
Multi-Timeframe Technical Analysis
Weekly Timeframe Pattern
The stock has formed a **Cup and Handle** pattern on the weekly chart, which is traditionally considered a bullish continuation pattern. This pattern suggests potential accumulation and a possible breakout scenario.
Daily Timeframe Analysis
On the daily chart, a * *Bullish Pennant* * formation has developed, indicating consolidation after a strong upward move. This pattern typically suggests continuation of the prior trend once a breakout occurs.
Key Technical Levels
Fibonacci Retracement Levels:
- 0 Level: ₹1,491.20
- 0.5 Level: ₹1,567.70 (approximate support zone)
- 0.618 Level: ₹1,595.45 (golden ratio support)
- 1 Level: ₹1,644.20
- 1.272 Level: ₹1,685.80
- 1.414 Level: ₹1,707.55
Current Price Action:
The stock is trading near ₹1,610.30, positioned between the 0.618 and 1.0 Fibonacci levels, suggesting a mid-range consolidation zone.
Upside Targets
If the bullish patterns play out and the stock breaks above recent resistance:
- **Primary Target:** Based on the Fibonacci extension, the measured move suggests potential toward ₹1,685-₹1,708 range
- **Pattern Target:** The Cup and Handle height projection aligns with Fibonacci extension levels
Support Analysis
- **Immediate Support:** ₹1,595-₹1,600 zone (0.618 Fibonacci level)
- **Strong Support:** ₹1,567 region (0.5 Fibonacci level)
- **Major Support:** ₹1,491 (pattern base/0 level)
With Nifty made a Bounce back and if the rally continues, adds advantage for the stock to break previous resistance." This highlights the **correlation with broader market sentiment** (Nifty index), suggesting the stock's performance may be influenced by overall market conditions.
Swing Trading Perspective
For short-term traders, the Cup and Handle height provides a **measured move target**. However, confirmation of breakout above resistance with volume would be essential before entry.
**Disclaimer:** This is a technical analysis based on chart patterns and historical price action. This is not financial advice. Traders should conduct their own research, consider risk management strategies, and consult with financial advisors before making trading decisions. Past performance does not guarantee future results.

Canarabank - Short Term BuySImple Technical Analysis.
Multiple PSU stocks are forming Flag&Pole pattern.
Canarabank - Hovering around Prev ATH.
Pattern BO will lead to 139.
Prev High Breakout will lead the Stock to 139/143/152/169.
Target Levels Based on Pattern target and Fibonocci Levels

Kirloskar Oil Engines - Swing TradeKirloskar Oil Engines Limited - Technical Analysis Report
Current Market Price: 1,005.70
MARKET BIAS: BULLISH RECOVERY IN PROGRESS
Kirloskar Oil Engines is currently trading at 1,005.70, showing signs of bottoming out after a significant correction from its all-time highs of ₹1,450+. The stock is now forming a potential reversal pattern.
KEY TECHNICAL OBSERVATIONS:
1. Major Support Zone - HOLDING STRONG ✅
The stock has found solid support in the 900-950 zone, which coincides with:
- Multiple moving average convergence (EMA 20/50/100/200)
- Previous resistance-turned-support from mid-2025
- Psychological round number support at 900
The price has bounced decisively from this zone, suggesting accumulation by institutional investors.
2. Consolidation Rectangle Pattern (Daily/Weekly)
A clear *rectangular consolidation box* :
- Upper Range: 1,016 - 1,050
- Lower Range: 900 - 950
This sideways movement indicates Distribution completion and potential energy buildup for the next directional move.
All major EMAs are converging in the 890-910 zone, creating a strong support cluster.
TARGET ANALYSIS:
Immediate Resistance Targets:
Target 1: 1,180 - 1,200 (First Major Resistance)
- Previous consolidation high from December 2025
- 61.8% Fibonacci retracement of the recent decline
Target 2: 1,334 (Secondary Target)
- Major swing high marked on weekly chart
- Psychological resistance zone
Target 3: 1,450 (Extended Target)
- Previous all-time high zone
- Final resistance before new highs
Critical Support Levels:
- 1,000: Immediate psychological support
- 900-920: MAJOR SUPPORT (EMA cluster + pattern base)
BULLISH BREAKOUT (Higher Probability - 65%)**
CONCLUSION:
Kirloskar Oil Engines is at a Critical juncture with strong technical setup favoring a Bullish breakout. The stock has:
- ✅ Successfully held major support zones
- ✅ Maintained position above all key moving averages
- ✅ Formed higher lows indicating accumulation
- ✅ Built a strong base for the next upward move
Disclaimer: This analysis is for educational purposes only. Please consult with your financial advisor before making investment decisions. Past performance does not guarantee future results.

Deepak Fertilizer - Technical AnalysisDEEPAK FERTILISERS & PETROCHEMICALS CORPORATION LTD.
CMP:1,453.32
CHART OBSERVATIONS
Strong Historical Momentum: Stock showed powerful uptrend with 4 months of continuous momentum building base for next upside.
EMA Confirmation: Multiple EMAs sorted bullishly in both Monthly and Weekly timeframes
Higher Lows Pattern: Price forming higher lows indicating retracement / accumulation.
Trendline Support: Blue descending trendline acting as dynamic support.
Current Structure
Consolidation Phase: Stock consolidating in a defined range after significant rally
Breakout Setup: Price testing resistance of descending trendline - potential breakout candidate
KEY TECHNICAL LEVELS
Resistance Zones (Upside Targets)
- Target 1: 1,778.60
- Target 2: 2,020.60
- Target 3: 2,328.45
- Target 4: 2,668.30
Support Zone
- Accumulation Zone: 1,400 - 1,200 (highlighted in blue rectangle)
TRADING STRATEGY
Conservative Approach:
- Accumulate in parts within the blue zone (1,200 - 1,400)
- Conservative entry can be taken when trendline breaks or price action confirms
Aggressive Approach:
- Entry when 5% upmove is seen in stock price from current levels
- Breakout above descending trendline with volume confirmation
Risk Management
- Stop Loss: Close below 1,132 on weekly closing basis
- Position Sizing: Allocate 2-3% of portfolio per position
- Pyramiding: Add positions on dips within accumulation zone
Target Achievement Timeline
- T1 (1,778): Short to Medium term (3-6 months)
- T2-T4: Medium to Long term (6-18 months)
CONCLUSION
Deepak Fertilisers is displaying a healthy technical setup with strong foundational support from EMA structure across multiple timeframes. The current consolidation offers an attractive risk-reward opportunity for accumulation. Patient investors can build positions in parts, while momentum traders should wait for trendline breakout confirmation.
The stock has demonstrated robust momentum historically and appears to be building base for next leg of upside movement.
DISCLAIMER:
This analysis is for educational and informational purposes only and should not be construed as investment advice or a recommendation to buy, sell, or hold any securities.
- Past performance is not indicative of future results - Stock markets are subject to risks including loss of principal - The author is not a SEBI registered analyst/advisor
- This is a personal view based on technical analysis only - Investors are advised to consult with certified financial advisors before making investment decisions - The author does not guarantee accuracy of data or projections - Trading/Investing in securities is subject to market risks
#DEEPAKFERT #TechnicalAnalysis #StockMarket #NSE #FertilizerStocks #SwingTrading #PositionalTrading

L&T Multiyear BreakoutLarsen & Toubro Limited - Multi-Timeframe Breakout Analysis
Current Price:4,004.40
CRITICAL SETUP ALERT
L&T is at a pivotal moment with breakouts confirmed on weekly and monthly timeframes. The stock is now in a crucial period that will determine the validity of this range breakout.
KEY TECHNICAL OBSERVATIONS
Weekly Chart Analysis:
- Nearly 1.9 Years of Consolidation (2023-2025) between 3,200-3,800
- Clean breakout above 3,800 resistance with strong momentum
- All major EMAs (20/50/100/200) aligned bullishly
- Long accumulation phase suggests institutional participation
Monthly Chart Analysis :
- Breakout confirmed above 4,250 resistance box
- Strong bullish candle with healthy volume expansion
- EMAs: 20 | 50 |100 I 200 - all rising
Current Status:
✅ Breakout happened on weekly/monthly charts
⏳ Awaiting confirmation via follow-up candle close
📈 Price holding above breakout zone shows strength
🎯 PRICE TARGETS
Based on the range breakout and Fibonacci projections:
- Target 1: 4,451.25 (Immediate resistance)
- Target 2: 4,809.60 (Major psychological level)
- Target 3: 5,424.35 (Extended target - 35% upside)
- Target 4: 5,750+ (Bullish scenario)
📌 CRITICAL LEVELS
Support Zones:
- S1: 3,740 (Breakout retest level)
- S2: 3,611 (20 EMA on weekly)
- S3: 3,419 (Consolidation top - breakdown level)
WHAT MAKES THIS SETUP SPECIAL?
1. Time Factor: 1.9 years of consolidation = strong base building
2. Multi-Timeframe Alignment: Breakout on both weekly AND monthly charts
3. Volume Confirmation: Significant expansion during breakout
4. Long-Term Trend: Steep uptrend from 2020 lows still intact
For Conservative Traders:
- Wait for successful retest of 3,740-₹3,800 zone
- Confirm with strong bounce and volume
- Enter on confirmation with tighter stops
For Long-Term Investors:
- Accumulate on any dip to 3,700-3,800
- Strong fundamental backing (Infrastructure leader)
- Multi-year breakout suggests sustained momentum
- Target: 5,500-6,000 (12-18 months)
- ❌ Failure Signal: Close below 3,740 = False breakout, back to range
What to Watch:
1. Monthly candle close (crucial for pattern confirmation)
2. Volume sustenance above breakout level
3. No bearish engulfing on weekly/monthly timeframe
4. Hold above previous consolidation high (3,800)
DISCLAIMER:
This analysis is for educational purposes only and NOT financial advice.
- Technical patterns may fail; past performance doesn't guarantee future results - Breakouts can be false; always use stop losses - Conduct your own research and consult a financial advisor - The author may or may not hold positions in L&T - Trading/investing involves substantial risk of capital loss - You are solely responsible for your investment decisions
**Trade responsibly with proper risk management.**
#LarsenToubro #LT #Breakout #TechnicalAnalysis #NSE #Infrastructure #RangeBreakout #MultiTimeframe #BlueChip #IndianStocks

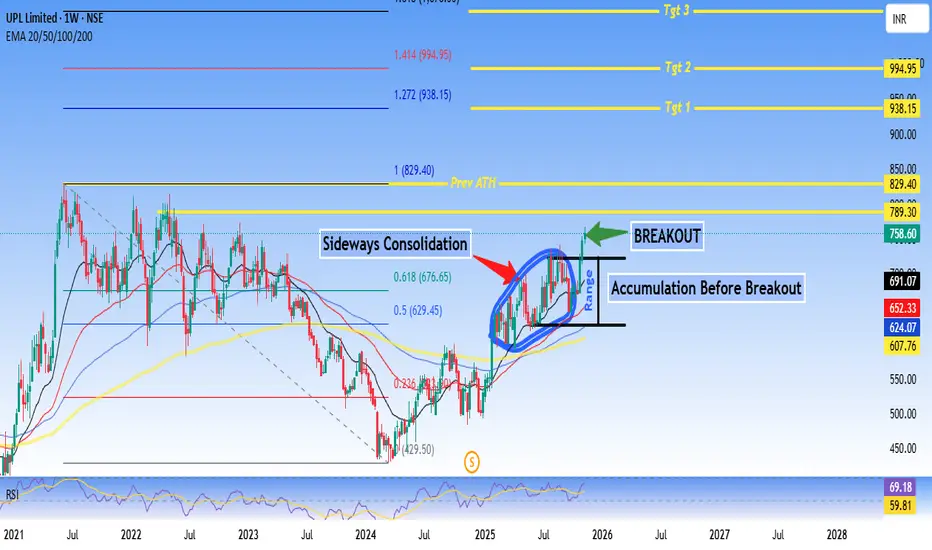
UPL Limited approaching Prev ATH - Technical AnalysisUPL Limited - #Breakout Setup After #Accumulation Phase
Current Price: 691.07
Good For Swing to Short-term Trading.
Technical Summary:
UPL is showing a classic accumulation-to-breakout pattern after an extended sideways #consolidation phase. The stock has broken out from a well-defined range with strong volume confirmation and is now positioned for potential upside momentum.
Key Technical Highlights:
✅ Breakout Confirmed: Price breaking above 768 resistance zone with volume expansion
✅ Accumulation Phase Complete: Extended consolidation (2024-2025) suggesting smart money accumulation
✅ EMA Alignment: 20/50/100/200 EMAs converging and starting to fan out bullishly
✅ RSI Strength: At 69.18, showing momentum without being overbought
✅ Fibonacci Levels: Currently between 0.236-0.5 retracement, plenty of upside room
Price Targets:
- Target 1: 938.15 (+35% from current levels)
- Target 2: 994.95 (+44%)
- Target 3: 1,050+ (Extended target)
Support Levels:
- Immediate: 676 (0.618 Fib)
- Strong: 629 (0.5 Fib + breakout level)
- Critical: 607 (20 EMA)
Risk-Reward: Favorable at current levels with defined support zones and multiple upside targets.
Disclaimer:
This analysis is for educational and informational purposes only and should NOT be considered as financial advice or a recommendation to buy/sell any security.
- Technical analysis is based on historical price patterns and may not predict future performance - Past performance is not indicative of future results - Trading and investing involve substantial risk of loss - Always conduct your own research and due diligence - The author may or may not hold positions in the discussed security - Price targets are projections based on technical levels and not guaranteed outcomes - Market conditions can change rapidly, invalidating technical setups - Use appropriate position sizing and risk management strategies
** Trade at your own risk. You are solely responsible for your trading/investment decisions.**
#UPL #TechnicalAnalysis #Breakout #Accumulation #StockMarket #NSE #SwingTrading #ChemicalSector #FibonacciRetracement #RSI
Torrent Power - Short Term Investment IdeasTorrent Power Limited - Technical Analysis Report
Current Market Price: 1,328.40
Opportunity: The Stock is Trading at 40% discount to intrinsic value, presenting a potential value investment in the #Integrated #powersector.
Technical Setup: Stock testing critical 20 #EMA support on monthly timeframe after forming #HiddenDivergence #pattern. Recent decline suggests caution but oversold conditions emerging.
Technical Snapshot
Trend: Monthly chart shows trend continuation pattern with classic divergence forming between February and October 2025 lows. Currently attempting support at 20 EMA (1,329).
RSI: Monthly RSI at 33.26 (oversold territory) with RSI 3 breakout indicating significant selling pressure but potential bounce setup.
Support Levels: 1328, 1200, 1055
Resistance Levels: 1539, 1743 (recent high)
Business Overview (Fundamentals)
Torrent Power operates across three segments: thermal power generation and LNG trading, transmission and distribution (largest revenue contributor), and renewable energy through wind and solar projects.
Trading Strategy
Aggressive Buyers: Accumulate at current levels with stop loss below 1,280. Risk-reward favorable given 40% discount.
Conservative Buyers: Wait for weekly close above 1,350 confirming support hold before entry.
Target:1,539 (short-term), 1,743+ (medium-term)

AdityaBirlaCapital - Investment IdeasAditya Birla Capital Ltd - Technical Analysis
Simple Technical Analysis Summary
Aditya Birla Capital is breaking out from a multi-year resistance zone with a classic and perfect rounding bottom pattern playing out on the monthly timeframe.
Fibonacci targets have been activated!
Key Technical Observations
1. Multi-Year Rounding Bottom Pattern
The stock has completed a textbook rounding bottom formation spanning multiple years. This is one of the most reliable bullish reversal patterns in technical analysis, indicating a fundamental shift from bearish to bullish sentiment.
2. Breakout from Multi-Year Resistance
After years of consolidation and base building, the stock has successfully broken out from a significant resistance zone around ₹255. This breakout signals the potential beginning of a new uptrend cycle.
3. Monthly Timeframe Confirmation
The pattern is forming and confirming on the monthly timeframe, which carries significantly more weight than shorter timeframes. Monthly breakouts tend to lead to sustained moves.
4. Fibonacci Extension Framework
Multiple Fibonacci extension levels have been identified and activated, providing a clear roadmap for potential price targets based on the measured move from the rounding bottom pattern.
#Fibonacci Extension Target Levels
Based on the rounding bottom pattern measurement and Fibonacci extensions:
- Target 1: 314.20 (1.272 Fibonacci Extension)
- Target 2: 345.10 (1.414 Fibonacci Extension)
- Target 3: 389.90 (1.618 Fibonacci Extension)
- Extended Target: 472.00 (2.0 Fibonacci Extension)
Key Support Levels
- Immediate Support: 255.00 (Breakout level / Previous resistance turned support)
- Secondary Support: 171.86 (0.618 Fibonacci retracement)
- Critical Support: 146.17 (0.5 Fibonacci retracement)
- Base Support: 42.35 (Rounding bottom base)
- Pattern suggests long-term bullish structure - Risk-reward favorable for position building on dips
Risk Management:
- Maintain stoploss below 255 on monthly closing basis
- For aggressive traders: 240 (allowing some wiggle room)
- For conservative traders: 235 (below breakout zone)
Invalidation Level:
- Monthly close below 240 would weaken the bullish structure
- Break below 220 would invalidate the immediate bullish setup
DISCLOSURE & RISK WARNING:
This analysis is provided for educational and informational purposes only and should not be construed as financial advice, investment recommendation, or an offer to buy or sell securities. Past performance is not indicative of future results.

Long Term Buy #GMRCurrent market Price: ₹153.35
Key Technical Analysis Points
"Major Breakout Achievement"
The stock has successfully broken out of a 16-year resistance level around ₹101.73, which had been a significant barrier since the 2009 highs.
Previous ATH : ₹111.17
- Target 1: ₹125.86
- Target 2: ₹153.35
Key support : ₹101.73 (former resistance, now support)
**Long-term Pattern**: The chart shows a classic long-term consolidation pattern from 2009-2023, followed by a strong breakout and retracement that successfully held above the breakout level.
Conservative Trader can Initiate buy above ₹101.73 Breakout.
The stock experienced significant highs around 2009-2010, followed by a prolonged bear market and consolidation phase lasting over a decade. The recent breakout suggests a potential new bull cycle for the airport infrastructure company.

Hindpetro Long - Investment IdeaHindustan Petroleum (HINDPETRO) - Monthly Chart Analysis
Current Price: 441.75
Major #Breakout in Progress
**Timeframe:** Monthly (Long-term View)
Key Technical Event:
🚀 Historic Breakout - Stock has broken above 2017 all-time high after 8 years of consolidation
- Breakout Level: 325.55
- Retest Zone: 410-420 - Currently retesting breakout
Hindpetro is Brewing for fresh new highs above ₹441
Target Projections based on #Patterns and #Fibonocci levels.
Interim Targets:
- Support holding at ₹416
- Immediate resistance: ₹480-500 zone
Short Term Targets:
- Tgt 1: 530
- Tgt 2: 657
Extended Targets: 593-629
Technical Significance:
- **8-year base breakout** = High probability of sustained uptrend
- Monthly trend reversal confirmed
- Trading well above long-term moving average
- Volume-supported breakout suggests institutional accumulation
Risk Management:
- Stop Loss: Below 410 on monthly closing basis
- Key Support: 325 (previous resistance now support)
Outlook:
After breaking a major multi-year resistance, HINDPETRO is consolidating gains and positioning for the next leg up. Patient accumulation recommended on dips toward ₹410-420.
This is for educational purposes only.* Do your Own analysis before taking Trade.

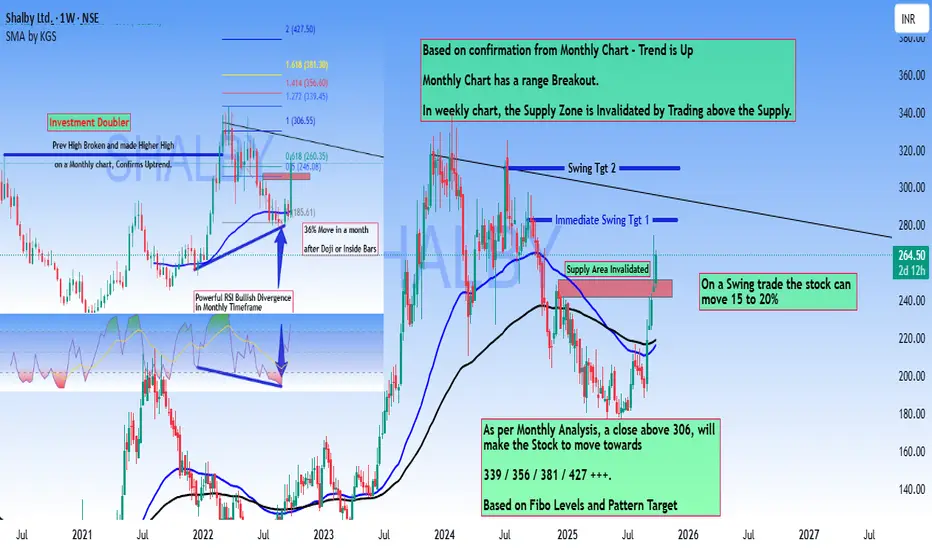
ShalbyLtd - Investment Doubler - High Conviction Trade Setup#Shalby Ltd - #Technical Analysis Report
Current Price: 264.50
Key Technical Signals
Bullish Confirmation from Multiple Timeframes:
- Monthly chart shows a confirmed range breakout with uptrend validation
- Previous high broken on monthly chart, establishing higher highs
- Powerful RSI Bullish Divergence observed in monthly timeframe
Weekly Chart Analysis:
- Supply zone has been invalidated by price trading above 246-250 Levels
- Stock is now in an active swing trade setup
- Expected Immediate 10 to 15% Move Swing Setup.
Investment Status:
The stock presents a compelling "Investment Double" opportunity, with the previous high broken and a higher high confirmed on the monthly chart. The pattern suggests significant upside potential after a period of consolidation.
Price Targets
Short-term Swing Trade: Potential move of 15-20% from current levels
Medium to Long-term Targets:
- ₹306 (Critical breakout level)
- ₹339
- ₹356
- ₹381
- ₹427++++
A decisive close above ₹306 will trigger momentum toward higher Fibonacci-based targets.
Risk Consideration
Expect a consolidation period of approximately one month following Doji or inside bar formations before the next major move materializes.
Conclusion
Shalby Ltd presents a strong technical setup with multiple timeframe confirmation. The invalidation of the supply zone and monthly breakout suggest the stock is positioned for a sustained upward movement. Traders should monitor the ₹306 level closely for breakout confirmation.
Disclaimer: Charts shared only for Educational purpose only. Its not a trade recommendation. Do your own analysis to survive in Trading for a longer run.
JSWENERGY Quarterly Breakout#jswenergy Strong Breakout and Sustaining strongly on Quarterly Chart.
Good to Hold for Swing, Short and Long-term #Investment.
Strong on Technical's.
Charts never Disappoint me !

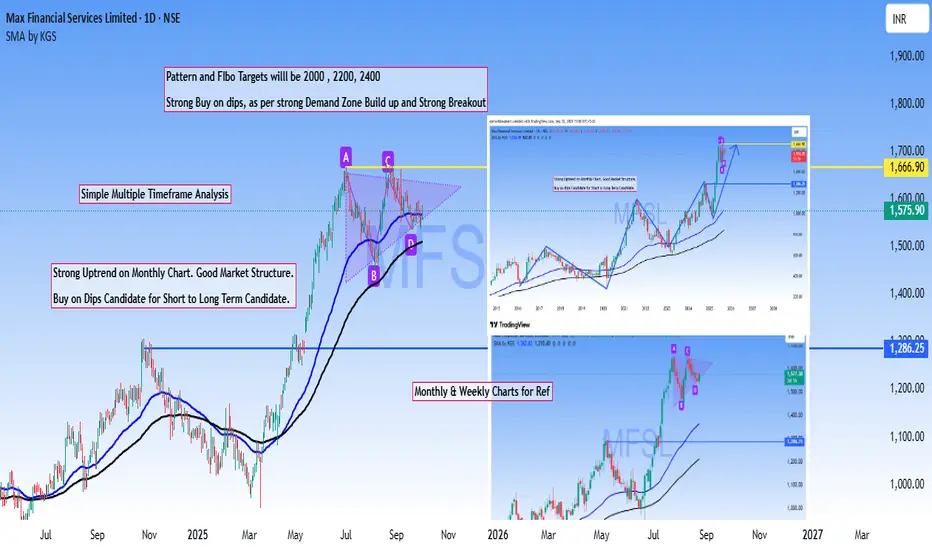
MFSL Multi time frame AnalysisMulti-timeframe confluence analysis offers traders a robust edge through straightforward yet highly effective methodology.
Based on that MFSL is a strong Buy on dips stock based on powerful breakout of previous ATH and the current market structure.
Targets are derived from #Pattern #breakout and #Fibonacci levels.
Bullish Pennant in formation.
Disclaimer: Above analysis shared for educational purpose only.
Investment Stock Analysis - BHEL Strong BuyTechnical Aanalysis
After making HH in July 24. Stock came to Prev Breakout Levels to Retest
and currently in Accumulation before making fresh Higher High.
1) Inverted Head & SHoulder in formation. Pattern will be active when Strong closing above 261. Inactive if Closes below 179.
2) Currently within falling wedge resistance. Confirmative entry will be above candle closing above 264.
3) Multiple and Confirmed Patterns on Weekly and Monthly Charts
4) Hidden Divergence formed in a weekly Tf, confirm Trend Conformation towards prev high and Fresh Higher High.
4) Strong candidate to hold for Better returns on Short to Long term Investment.
Disclaimer: Views shared are for Educational purpose only. Initiate your own analysis before taking any trades.

GMDC ltd Strong Buy - Short term#GMDCLTD - Clean Technical #Breakout Stock.
#18 years Breakout done earlier and retest also done.
#Strong #Buyondips stock.
Targets in Charts

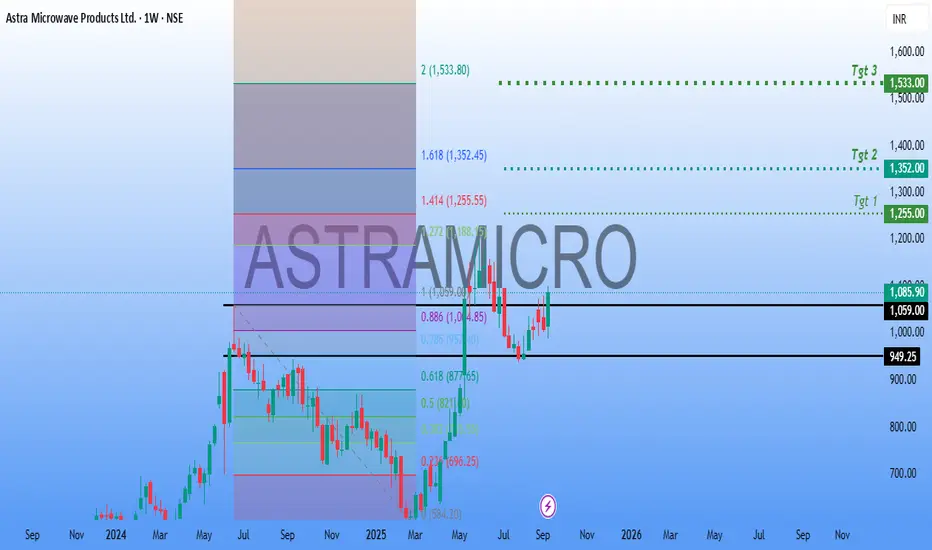
ASTRAMICROAnother #Defense #Stock in focus.
#ASTRAMICRO has a strong Technical Structure. Made a neat #breakout and consolidating at the Breakout levels.
Neat #Buyondips stock for #Short to #Longterm #Investment.
Targets in Chart.
Hitech Pipes Long
📊 Hi-Tech Pipes Ltd (NSE: HITECH) – Weekly Technical Analysis
The stock has witnessed a prolonged downtrend from its highs and recently formed a strong bullish reversal candle, signaling a potential short-term trend reversal. Key indicators are also turning positive, supporting the possibility of an upward move.
🔎 Technical Observations
Price Action:
After a steep fall from ~₹140 levels, the stock took support near ₹88–90.
A strong green weekly candle has appeared with good momentum, suggesting renewed buying interest.
RSI has bounced from oversold territory, indicating strength.
MACD has shown a bullish crossover, with the histogram turning green, confirming momentum shift.
The recent bullish candle was backed by higher-than-average volume, a sign of accumulation.
📌 Trading Plan
Entry Zone: ₹95 – ₹102
Stop-Loss: ₹88 (weekly close basis)
Target 1: ₹110 – ₹115
Target 2: ₹125 – ₹130
Target 3: ₹140 – ₹145
⚠️ Key Notes
Sustaining above ₹115 with strong volume will be crucial for further upside.
Since the broader trend is still weak, treat this as a pullback rally until the stock closes above ₹130+.
Booking partial profits at each target level is advised to protect gains.
📢 Conclusion
Hi-Tech Pipes Ltd is showing early signs of a reversal after a long decline. The combination of price action, momentum indicators, and support zone bounce makes it an attractive short-term opportunity. However, strict stop-loss management is necessary given the prior downtrend.

Cochinship AnalysisCochin Shipyard Limited (COCHINSHIP) Bullish Bet
The chart presented indicates the formation of an Inverse Head and Shoulders pattern, which is considered a bullish reversal pattern.
Left Shoulder: Formed around early August 2025.
Head: Formed during mid-August 2025 at a lower price level.
Right Shoulder: Formed towards late August 2025.
Neckline: Around the ₹1,750–1,765 range.
This suggests a potential trend reversal from bearish to bullish.
Current Price (CMP): ~₹1,745.70
Neckline Resistance: ~₹1,765
Breakout Target (based on pattern projection): ₹1844 / 1918 / 1992 / 2097+++
Support Levels:
Immediate Support: ₹1,700
Strong Support: ₹1,650
1. Trendline Break: The long-term downward trendline appears to be broken, indicating reduced selling pressure.
2. Volume Confirmation (not visible in chart): Ideally, a breakout above neckline with strong volumes will confirm the bullish reversal.
3. Potential Upside: If price sustains above neckline (~₹1,765), the stock may aim for ₹2,000–2,220 in the short to medium term.

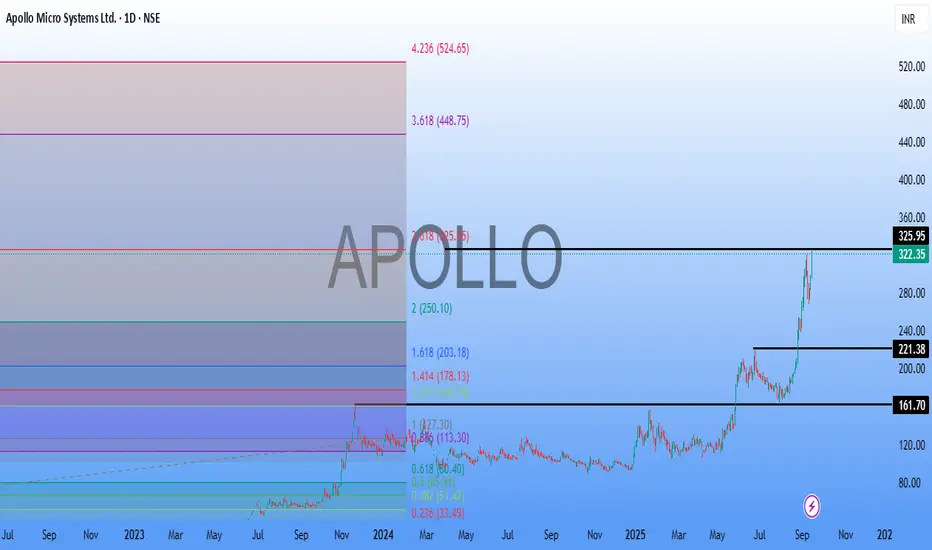
ApolloMicro SystemsApollo Micro Systems (AMS) is an Indian defense and aerospace electronics company poised for growth due to strong order books and expansion plans.
Apart from the Fundamentals, from Technical Point of view based on previous high breakout, stock has reached the Fibo Extension of 325.95. and its the Major Resistance.
Its a buy on dip candidate for a short to long term Investment stock,
with next target of 448.75 / 524.65.