Downward Channel on NIFTY501. Downward channel on NIFTY50 weekly chart may lead to 21400-21500 range in short term.
2. Pivot S1 indicate 21100 levels
3. The gap-up on 4th Dec 2023 corresponds to support levels but that is too far to discuss now, though we will keep track on it.
4. Trend line from lower fractal lows, 3rd June 2024 (Lok sabha election result day) low is breached on week starting 13th Jan 2025.
Pivot Points

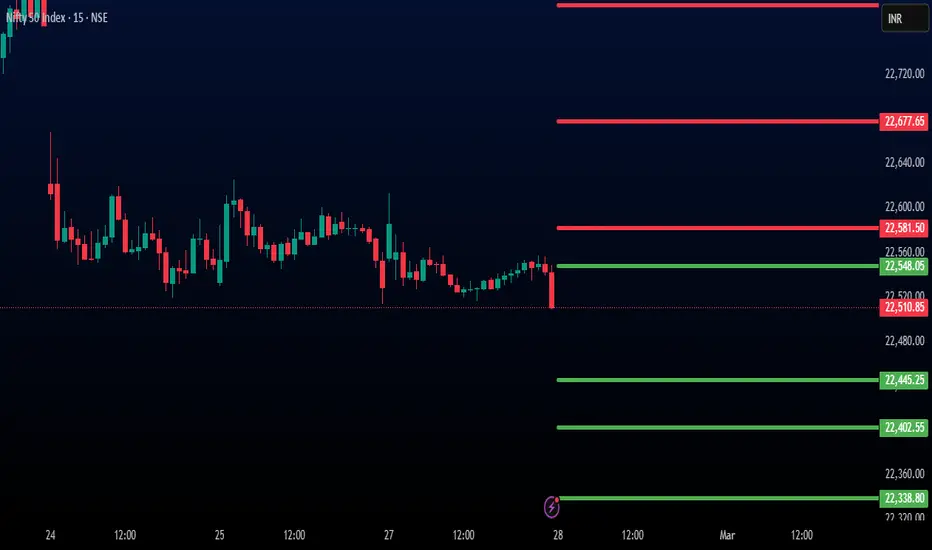
28-02 Nifty key levelsDear traders, here are the key levels for nifty 28-02 (15m), most important support and resistance for intraday based on previous day movement and market trend.
28-02 XAUUSD SHORTDear traders, Here are the key levels for XAUUSD intraday 28-02-25 (30m). The yellow zone represents the last two days support area; it can be an act resistance zone, and expect a short time reversal for intraday based on previous day market movement and market trend.
Entry: 2900.00
Target: 2885.00
Stop loss: 2910.00
Risk Reward Ratio 1:2

27-02 XAUUSD LONGDear traders, here are the important pivot support zone of XAUUSD (15m), candles taking support at the pivot S1 level it represents short time intraday buy direction,based on previous day movement and market trend.
Note: Intraday view only
Entry : 2896.00
Target :2906.00
Stop loss:2886.00
RRR 1:1

26-02 Nifty key levelsDear traders, here are the key levels for nifty 26-02-2025, most important support and resistance for intraday based on previous day movement and market trend.
Note: Intraday view only

ETH USD 24-02 BUY DIRECTIONDear traders, Here are the important pivot support zones of ETH USD (15m): Candle taking support at the S3 pivot level, it represents short-term intraday buy direction based on previous day movement and market trend.
Risk Reward Ratio 1:1

XAUUSD 24-02 LongDear traders, here are the important pivot support zone of XAUUSD (15m), candles taking support at the pivot level it represents short time intraday buy direction,based on previous day movement and market trend.
Note: Intraday view only
Entry : 2941.93
Target :2951.93
Stop loss:2931.93
RRR 1:1

ETHUSD Buy directionDear traders, Here are the important pivot support zones of ETHUSD (15m): Candle taking support at the S2 pivot level, it represents short-term intraday buy direction based on previous day movement and market trend.

Nifty MidCap Index short term targets
The Nifty MidCap Select Index is currently trading at 11,198.90, down 1.69% for the session ,despite the short-term downtrend, the index recently rebounded from a key support zone (10490 – 10390) if this level holds next week then their is chances of up side .
Important Resistance Levels
Immediate Resistance1 : 11,600 – A breakout above this level may indicate further bullish momentum towards 11,800 – 11,830.
Resistance2 : 11,800 – 11,830 – A significant supply zone where sellers may step in.
Major Resistance1: 12,100 – 12,170
Important Support Levels
Support1 : 11,068.60 – 11,015.55 – The key support zone holding the index.
Major Support1: 10,390 – 10,493.55 – A strong demand zone where buyers may re-enter.
Extended Support: 10,060.20 – 9,995.05 – A strong demand zone Extension where buyers may re-enter.

ETHUSD Long side Dear traders, follow the upward direction. The reason is that the candle tries to break pivot R1 level continuously so we can expect ETH-USD moving buy side direction upto R2 level.
Risk Reward Ratio 1:1

XAUUSD Key levelsDear traders, here are the important pivot support zone of XAUUSD (15m), based on previous day movement and market trend, candles taking support at S1 pivot level it represents short time intraday buy direction.
Note: Intraday view only
Entry : 2931.46
Target :2941.46
Stop loss:2921.46
RRR 1:1

Weekly Wrap idea Got Confirm. Tradeplan #Nifty50 18th Feb2025First Step of a successful trader is to build a Trade plan & review what he has done. (education purpose for all )
*Trend is rangbound, Short term Bullish.
*Trade plan: Buy on dip.
*for Critical levels see the video
Jai Hind.
Disclaimer :
This video is only for educational purposes. Please consult your financial advisor before you take any trade.

Manhindara & Mahindra strong down zoneNSE:M&M
mahindra & Mahindra break trendline
Disclaimer: This analysis is for educational purposes only.
Please assess your own risk tolerance and conslut with a financial advisor before trading.

XAUUSD technical analysis with Targets 2025 XAU/USD chart analysis with Targets
(1-week timeframe) shows a strong bullish trend with key levels of support, resistance, and breakout zones. Here’s a breakdown:
Current Market Status (as per chart)
Current Price: ~$2,882
Major Support - 1: $2,805 - $2,750
Major Support - 2: $1,805 - $1,759 (old levels)
Short-Term Target: $3,255 - $3,303
Long-Term : Above $3,500 AND +
Key Observations & Trading Insights
1. Strong Uptrend & Breakout Confirmation
- Price has broken past multiple resistance levels, turning them into support.
- Holding above $2,805 - $2,750 will maintain bullish momentum.
2. Next Resistance Levels:
- First Target - $3,255 - $3,303→ Short-Term Target
- Second Target - $ 3760 - $3800- Long term Target
3. Possible Pullbacks (Buy Zone)
- If price retests $2,805 - $2,750 and holds, it could be a strong buy zone.
- Below this, $2,555 - $2,535 is the next key support.
4. Bullish Confirmatio
- If price breaks above $3,255, it could quickly move toward $3,500+.

#Nifty 50 Lalagi In Rang Bound? Weekly Wrap #Nifty 50 17/02/25First Step of a successful trader is to build a Trade plan & review what he has done. (education purpose for all )
*Trend is rangbound, Short term Bullish.
*Trade plan: Buy on dip.
*for Critical levels see the video
Jai Hind.
Disclaimer :
This video is only for educational purposes. Please consult your financial advisor before you take any trade.

TATA Power again down scenarioNSE:TATAPOWER
Tata Power make again down scenario
price halt pivote point between 38% to 50%
Disclaimer: This analysis is for educational purposes only.
Please assess your own risk tolerance and conslut with a financial advisor before trading.

Adani Power trend again weekNSE:ADANIPOWER
Adani power price sustains a pivot point between 522 - 504.
and continues downwards
Best selling zone between 504 - 495.
and stop loss of 514 NSE:ADANIPORTS
Disclaimer: This analysis is for educational purposes only.
Please assess your own risk tolerance and conslut with a financial advisor before trading.

How to trade in Nifty Tomorrow Nifty Prediction by Price Action Trading Strategy
Nifty Support for Intraday - 23530 - 23550 , 23450 23430 , 23290-23330
Nifty Resistance For Intraday - 23730 - 23750 , 23780 -23790 , 23830-23850
Nifty Intraday Trading Setup
Keep eyes on Nifty 23700 CE and Nifty 23700 PE
If Nifty Moves Towards 23500 then NIFTY JAN 23700 CE (LTP- 92) target will be 130.-150
If Nifty Moves Towards 23800 then NIFTY JAN 23700 PE (LTP- 87 ) target will be 125 -145
Nifty Trend Signal From Open Interest Analysis
PCR ratio as per Option Chain Analysis – 1.10 ( Bullish)
Max Pain As per Option Chain Analysis – 23600
Major Resistance as Per Nifty Open Interest Analysis – 23850
Major Support as Per Nifty Open Interest Analysis – 23450
The market has a slightly positive bias based on the current PCR and open interest. However, with max pain and key resistance near **23,850**, there are moderate bearish possibilities.
key strike Prices for Nifty Tomorrow
- Bullish above 23,850
- Bearish below 23,700
Overall, the market is **neutral to mildly bearish**.

NIFTY SUPPORT RESAITANCE - 4th feb 25SUPPORT /RESISTANCE in Intraday (todays) which lead to moves (good RR trades) depend on previous day(s) structure - this is highly helpful in Sideways Market where exact entry can easily give 1:2 RR

BRITANNIA [POSITIONAL | SWING] [LONG]I have taken a long entry In BRITANNIA At 4800
Upcoming Tax budget will have relaxation which would boost FMCG & Auto sector.
Fundamental Information
Britannia Industries Limited is a leading player in India's fast-moving consumer goods (FMCG) sector, renowned for its extensive range of bakery and dairy products. Let's delve into its fundamental strengths and key financial metrics:
Market Position and Brand Strength: Britannia boasts a robust brand presence with products like Good Day, Marie Gold, and NutriChoice, enjoying significant market share in the biscuit segment.
Financial Performance:
Revenue Growth: For the fiscal year ending March 2024, Britannia reported a revenue of ₹46.68 billion, marking a 5% increase from the previous year.
REUTERS
Net Profit: The net profit for the same period was ₹5.31 billion, reflecting a decline attributed to challenges like urban demand slowdown and commodity inflation.
REUTERS
Profitability Ratios:
Gross Margin: Stood at 43.05%, indicating efficient production cost management.
INVESTING
Operating Margin: Reported at 17.28%, showcasing effective control over operating expenses.
INVESTING
Net Profit Margin: At 12.9%, reflecting the company's ability to convert revenue into profit.
INVESTING
Valuation Metrics:
Price-to-Earnings (P/E) Ratio: Approximately 68.38, suggesting market expectations of future earnings growth.
INVESTING
Price-to-Book (P/B) Ratio: Around 37.96, indicating investor confidence in the company's asset utilization.
INVESTING

Technical Analysis of Ethereum - Weekly Time Frame
👉🚀Here is a #technical analysis of #Ethereum #ETH based on the most recent data and insights from the
📉📈Chart

SWING (OBSERVATION) - PERSISTENT SYSTEMSScript showing high upside momentum 2nd day in continuation after bouncig from prominent support area channel around 5500 , clearing Resistance Trendline .
Support trendline testing around 6100 can make momentum last better

Wipro looks good breakoutWipro 310 ce , with a multi time frame breakout and in strike and options . good trade for feb options and breakout.
