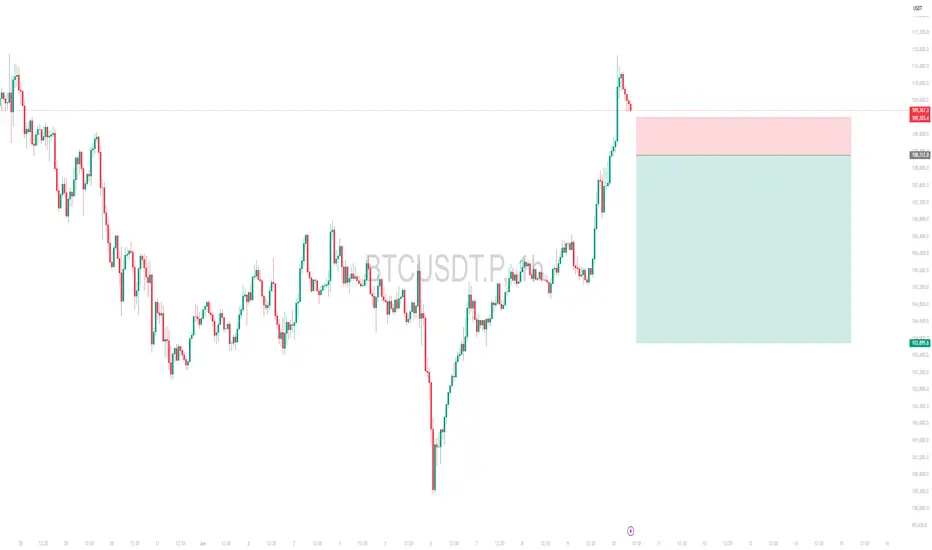
BTCAs it gave a strong breakout from the base at ATH to the upside, now ofcourse price would go up for sometimes.
But to it to go up, I m thinking of 2 possibilities.
And 2nd one is the one I am preferring "sweep and continuation."
Although I would any outcome ofcourse. 😂
Pivot Points

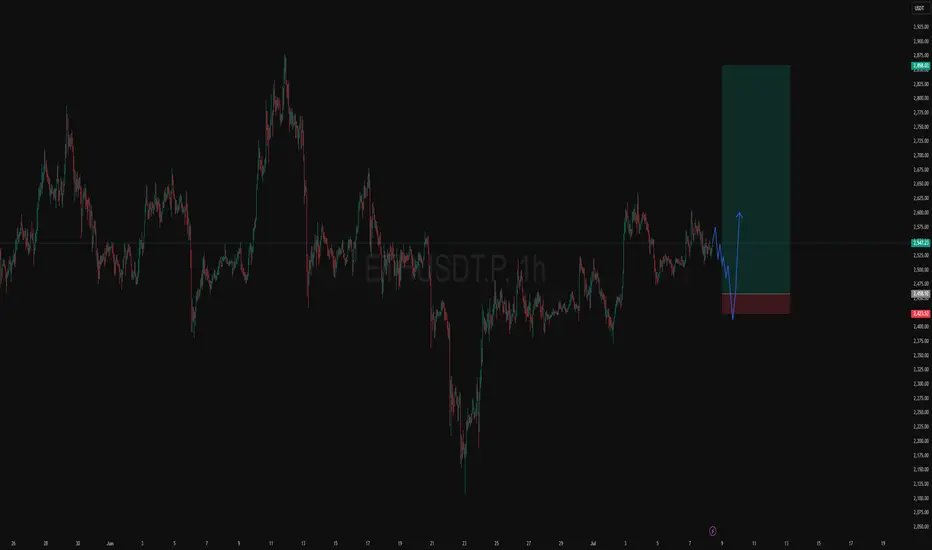
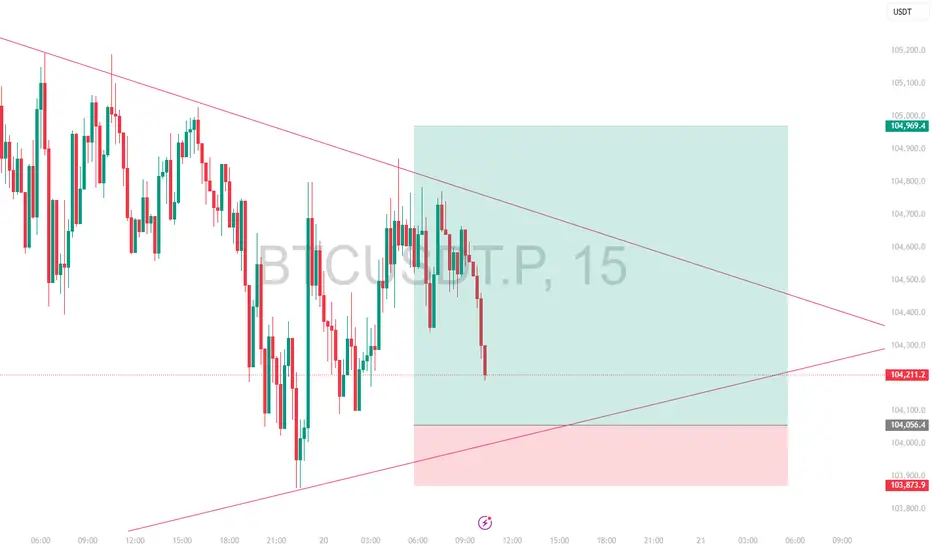
Weekly Long Setup | Jul 8th 2025 | Valid Until Weekly ClosePrice might retrace to a strong pivot zone (marked by the red box).
Structure remains bullish with potential for continuation after pullback.
The green box represents a high-probability long opportunity with tight risk control.
Watch for price reaction within the red zone. Entry only if confirmation (e.g., bullish engulfing, strong wick rejections) appears.
The setup expires at end of the weekly candle close.
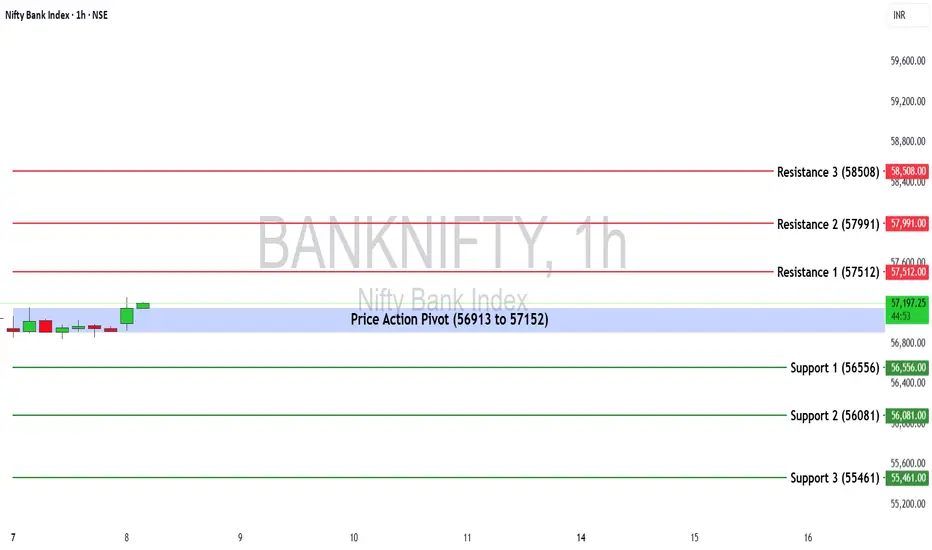
Bank Nifty Weekly Insights: Key Levels & TrendsBank Nifty ended the week at 57,031.90 with a slight drop of -0.72%
🔹 Key Levels for the Upcoming Week
📌 Price Action Pivot Zone:
The critical range to monitor for potential trend reversals or continuation is 56,913 to 57,152
🔻 Support Levels:
S1: 56,556
S2: 56,081
S3: 55,461
🔺 Resistance Levels:
R1: 57,512
R2: 57,991
R3: 58,508
📈 Market Outlook
✅ Bullish Scenario:
A sustained move above 57,152 could trigger fresh buying momentum, potentially driving Bank Nifty towards R1 (57,512) and higher levels.
❌ Bearish Scenario:
If the index falls below 56,913, selling pressure may intensify, pulling it down towards S1 (56,556) and lower supports.
Disclaimer: lnkd.in
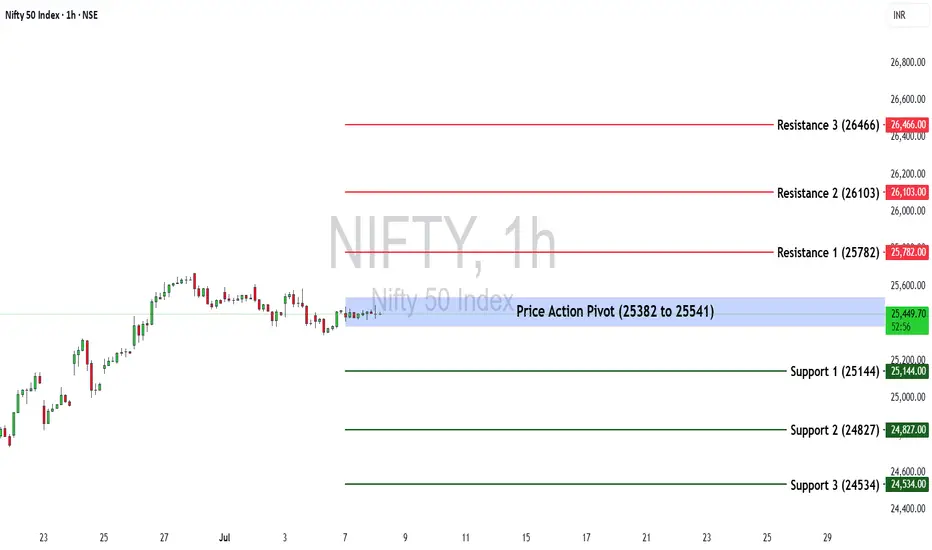
Nifty 50 at a Turning Point? Key Levels & Market Outlook AheadThe Nifty 50 ended the week at 25,461.00 with a loss of -0.69%
🔹 Key Levels for the Upcoming Week
📌 Price Action Pivot Zone:
The crucial range to watch for potential trend reversals or continuation is 25,382 to 25,541
🔻 Support Levels:
S1: 25,144
S2: 24,827
S3: 24,534
🔺 Resistance Levels:
R1: 25,782
R2: 26,103
R3: 26,466
📈 Market Outlook
✅ Bullish Scenario:
A sustained breakout above 25,541 could attract buying momentum, potentially driving Nifty towards R1 (25,782) and higher levels.
❌ Bearish Scenario:
A drop below 25,382 may trigger selling pressure, pushing Nifty towards S1 (25,144) and lower supports.
Disclaimer: lnkd.in
Long ASAHIINDIASuperTrend has turned positive on the weekly chart, with the recent closing price trading above the 10 EMA
BUY ASAHIINDIA
Entry - 848
SL - 742

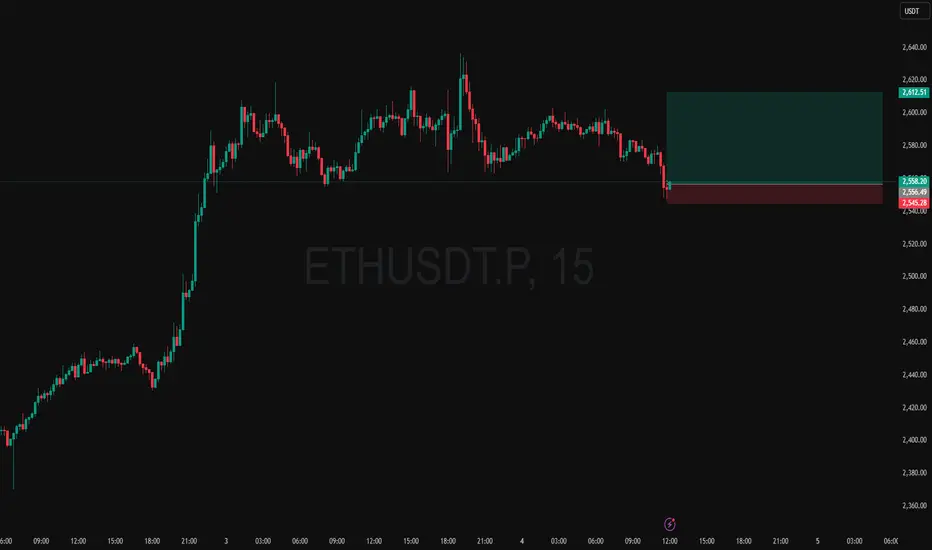
Intraday Long Setup | July 4th 2025 | Valid Until Daily ClosePrice retraced to a strong pivot zone.
Structure remains bullish with potential for continuation after pullback.
Tight risk control.
Watch for price reaction within the red zone. Entry only if confirmation appears
The setup expires at end of the daily candle close.
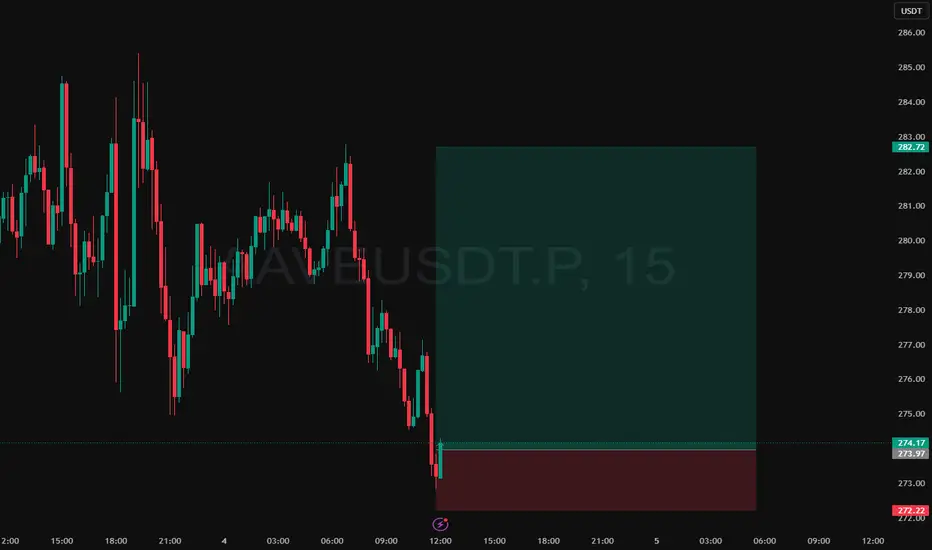
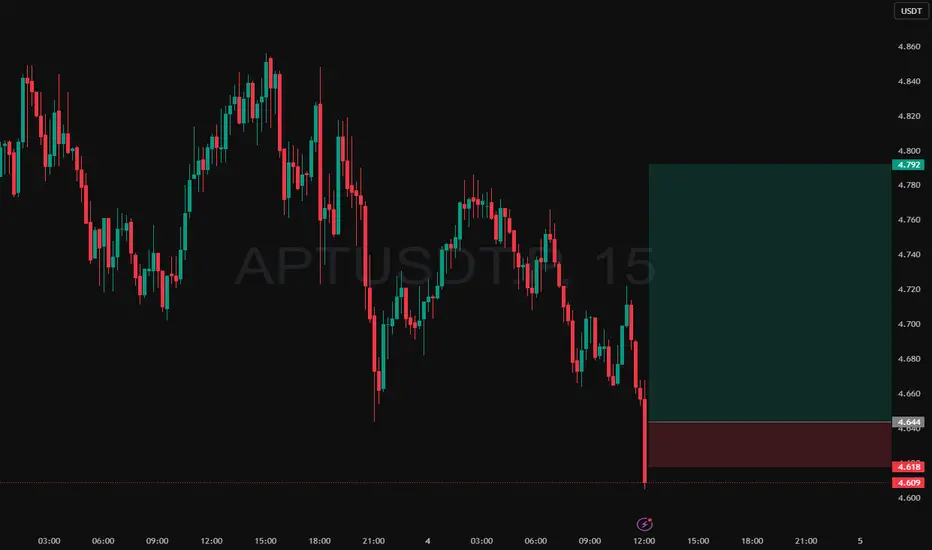
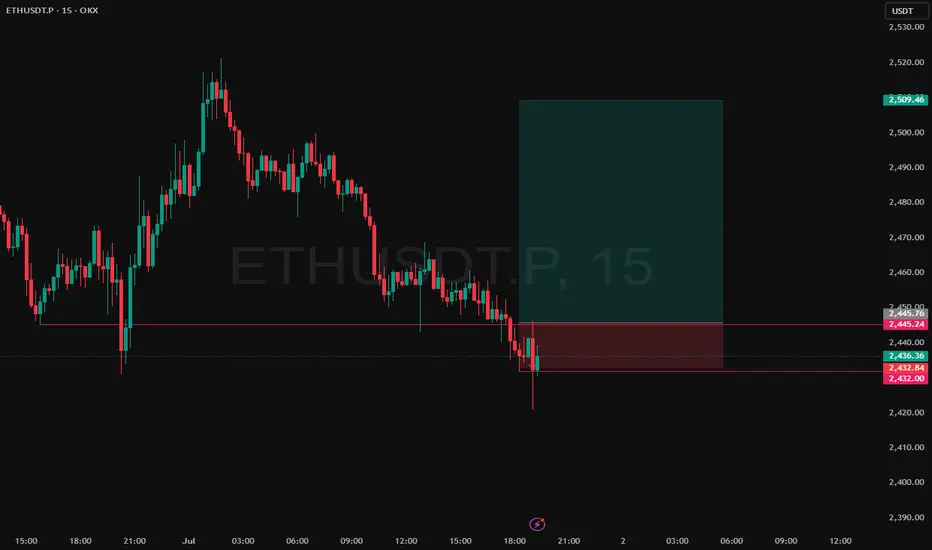
Intraday Long Setup | July 1st 2025 | Valid Until Daily ClosePrice retraced to a strong pivot zone.
Structure remains bullish with potential for continuation after pullback.
Tight risk control.
Watch for price reaction within the red zone. Entry only if confirmation appears
The setup expires at end of the daily candle close.
Hindustan Petroleum Corporation LtdHindustan Petroleum Corporation Ltd is mainly engaged in the business of refining of crude oil and marketing of petroleum products, production of hydrocarbons as well as providing services for management of E&P Blocks.

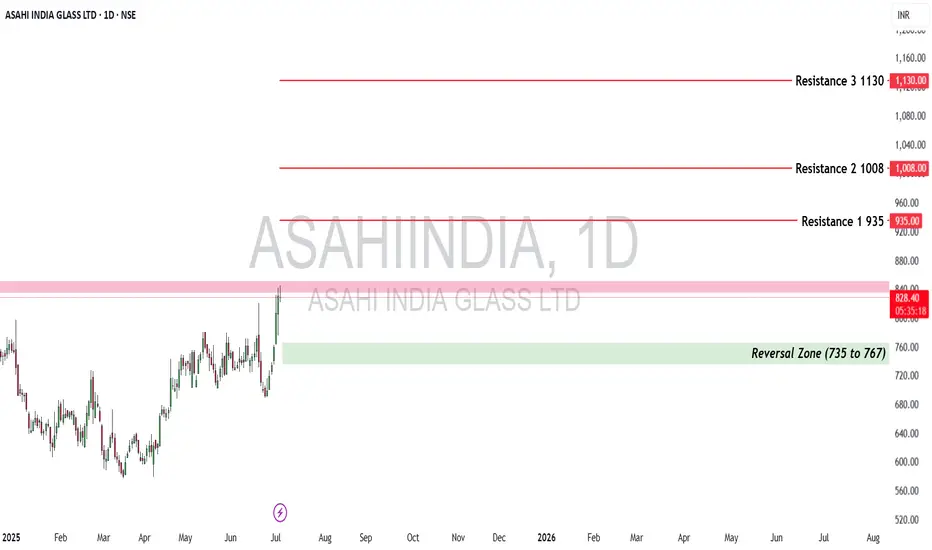
ASAHIINDIA Ready to Shine: Breakout in Focus!Asahi India Glass Ltd is India’s leading automotive and architectural glass manufacturer, backed by robust industry demand, especially in the auto and infrastructure space. The company holds a dominant position in OEM and aftermarket auto glass supply.
Market Cap: ~₹21,300 Cr
P/E Ratio: 48.19 (slightly overvalued but justified by strong growth)
ROE: ~18.75% (Healthy)
Debt to Equity: 0.31 (Well-managed leverage)
Profit Growth (YoY): 57.7%
Revenue Growth (YoY): 25.6%
Key Insight: The company benefits from tailwinds in the automobile sector and increasing demand for energy-efficient architectural glass
Technical Outlook
As per the attached chart, ASAHIINDIA has broken out of a multi-month consolidation zone, with a strong bullish candle crossing the breakout level.
Breakout Zone: ₹835–₹852 (highlighted in pink)
Reversal Zone (Demand Zone): ₹735–₹767 (highlighted in green)
Current Price Action: Testing breakout level with high momentum. Sustained closing above ₹852 could trigger further upside.
Resistance Levels to Watch:
R1: ₹935
R2: ₹1008
R3: ₹1130
🧭 Strategy Suggestion:
Swing Traders: Watch for a daily close above ₹852 for confirmation. First target ₹935.
Positional Investors: Accumulate on dips near the ₹770–₹800 zone with SL below ₹735.
Conclusion
Asahi India is technically breaking out from a major structure with strong bullish volume and price action. With sound fundamentals and sectoral tailwinds, the stock presents an opportunity for both short- and medium-term bullish trades.
Disclaimer: lnkd.in
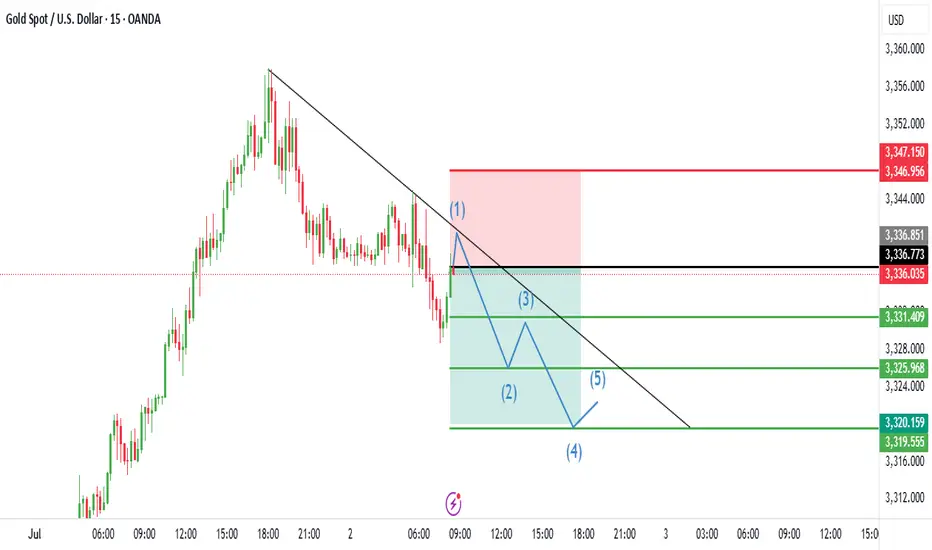
Trading Analysis for Gold Spot / U.S. Dollar (15-Minute Chart)
Based on the provided 15-minute chart for Gold Spot / U.S. Dollar (XAU/USD) and the specified data, here’s a suggested trading setup for a sell position:
Current Price and Trend: The current price is not explicitly provided, but the entry price is set at 3,336.00. The chart suggests a potential resistance zone near this level, with a recent uptrend showing signs of exhaustion.
Sell Entry: Enter a sell position at 3,336.00, aligning with the specified entry price where the price may face rejection due to resistance.
Stop Loss: Place a stop loss at 3,346.00, above the recent high, to protect against an upward breakout. This level is 10.00 points above the entry, defining the risk.
Take Profit Levels:
Take Profit 1: 3,331.00, a conservative target 5.00 points below the entry.
Take Profit 2: 3,326.00, a mid-range target 10.00 points below the entry.
Take Profit 3: 3,321.00, a deeper target 15.00 points below the entry, aligning with a potential support zone.
Price Action: The chart indicates a peak near the entry level, with a bearish reversal signal suggested by the candlestick pattern and resistance line.
Risk-Reward Ratio: The distance to the stop loss (10.00 points) compared to the take profit levels (5.00 to 15.00 points) offers a mixed risk-reward profile. Take Profit 2 and 3 provide a 1:1 and 1:1.5 ratio, respectively, making this a balanced short-term trade.
Conclusion
Enter a sell at 3,336.00, with a stop loss at 3,346.00 and take profit levels at 3,331.00, 3,326.00, and 3,321.00. Monitor the price action for confirmation of a downtrend, and be cautious of a potential upward move if the price breaks above the stop loss level.
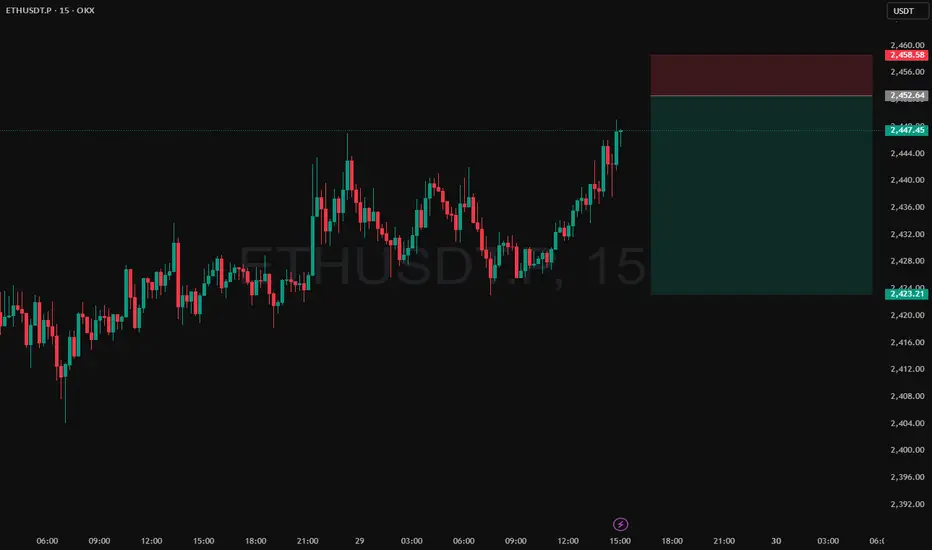
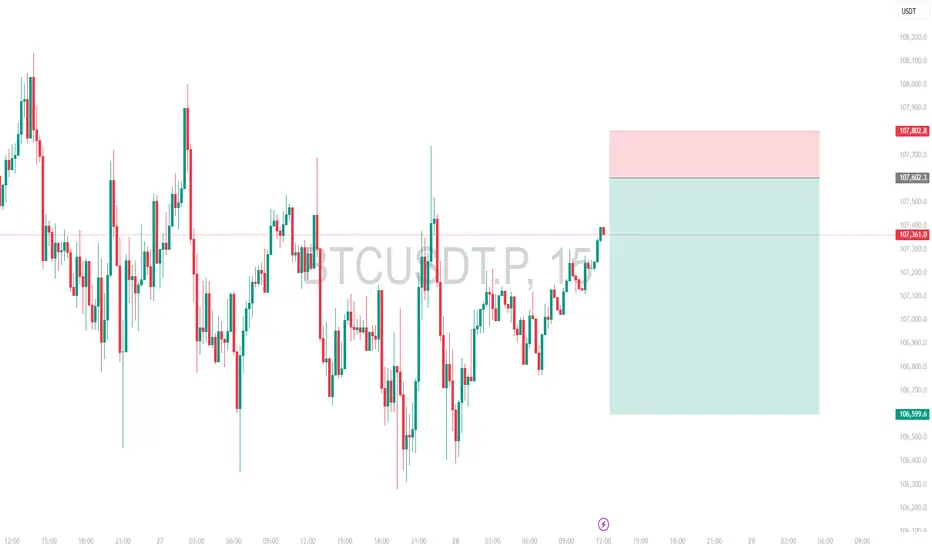
Intraday Short Setup | June 29th 2025 | Valid Until Daily ClosePrice has pushed into a potential intraday Pivot supply zone (red box) where sellers may step in. This trade is based on the expectation of a rejection from this area.
Entry: Red box — a short entry zone aligned with overhead supply
Stop Loss: Above the red zone (invalidates the setup)
Target: Green box — area to consider partial/full exit based on momentum
Risk-reward is favorable with a tight invalidation and clean downside target
Price may stall or reverse near the red box, creating short opportunity
Note:
This is an intraday trade idea that expires at 00:00 UTC (Daily Candle Close). Re-evaluate the setup if price remains indecisive near the entry zone close to that time.
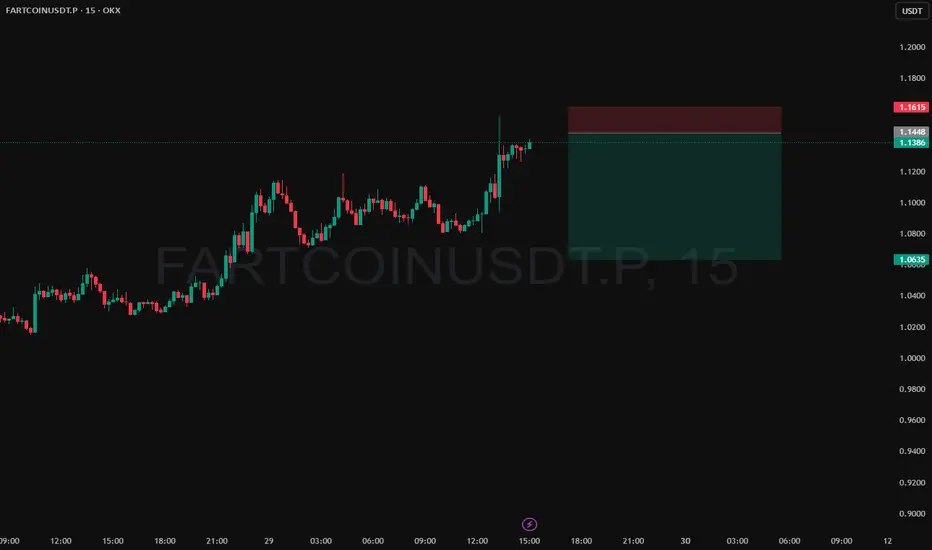
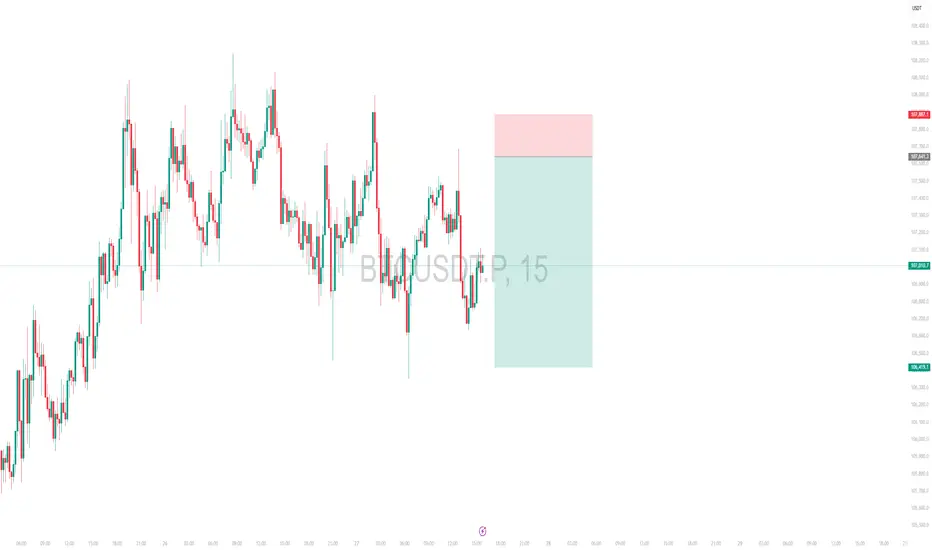
Intraday Short Setup | June 28th 2025 | Valid Until Daily ClosePrice has pushed into a potential intraday Pivot supply zone (red box) where sellers may step in. This trade is based on the expectation of a rejection from this area.
Entry: Red box — a short entry zone aligned with overhead supply
Stop Loss: Above the red zone (invalidates the setup)
Target: Green box — area to consider partial/full exit based on momentum
Risk-reward is favorable with a tight invalidation and clean downside target
Price may stall or reverse near the red box, creating short opportunity
Note:
This is an intraday trade idea that expires at 00:00 UTC (Daily Candle Close). Re-evaluate the setup if price remains indecisive near the entry zone close to that time.
Intraday Short Setup | June 27th 2025 | Valid Until Daily ClosePrice has pushed into a potential intraday Pivot supply zone (red box) where sellers may step in. This trade is based on the expectation of a rejection from this area.
Entry: Red box — a short entry zone aligned with overhead supply
Stop Loss: Above the red zone (invalidates the setup)
Target: Green box — area to consider partial/full exit based on momentum
Risk-reward is favorable with a tight invalidation and clean downside target
Price may stall or reverse near the red box, creating short opportunity
Note:
This is an intraday trade idea that expires at 00:00 UTC (Daily Candle Close). Re-evaluate the setup if price remains indecisive near the entry zone close to that time.
Persistent Systems LtdCurrent Price: ₹6,127
🔹 Approaching key resistance at ₹6,500
🔹 Sustained breakout can open targets towards ₹7,500+
🔹 Immediate support at ₹5,841
🔹 Bullish structure intact after recent recovery
🎯 Watch for: Weekly close above ₹6,500 for further momentum.

Weekly Long Setup | June 23rd 2025 | Valid Until Weekly ClosePrice is retracing to a strong pivot zone (marked by the red box).
Structure remains bullish with potential for continuation after pullback.
The green box represents a high-probability long opportunity with tight risk control.
Watch for price reaction within the red zone. Entry only if confirmation (e.g., bullish engulfing, strong wick rejections) appears.
The setup expires at end of the weekly candle close.

Weekly Short Setup | Valid Until Weekly CloseI have been in this trade for sometime now with first TP taken. Due to uncertainty globally, I am not posting any intraday charts.
Stay safe, save capital is the motto right now.
Note:
This is an weekly setup and idea that expires at Weekly Candle Close. Re-evaluate the setup if price remains indecisive near the entry zone close to that time.
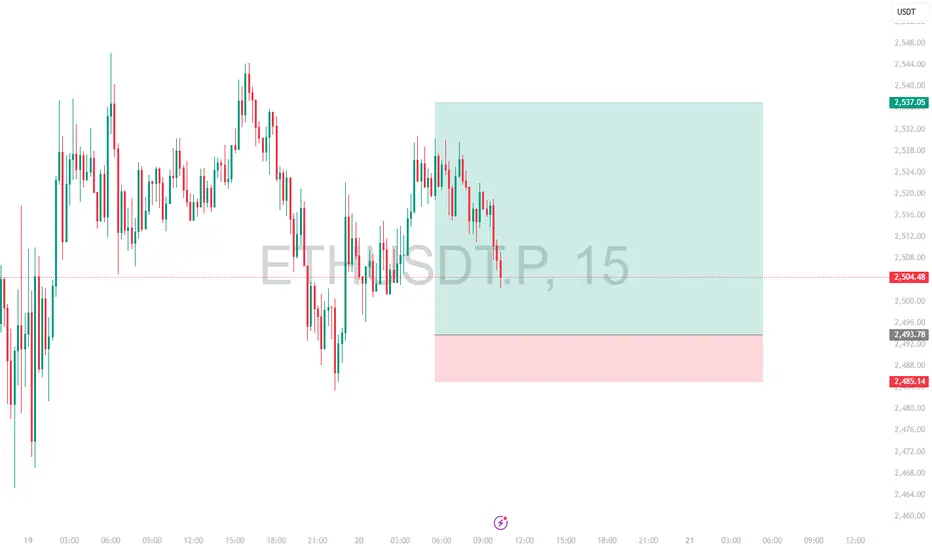
Intraday Long Setup | June 20th 2025 | Valid Until Daily ClosePrice retraced to a strong pivot zone.
Structure remains bullish with potential for continuation after pullback.
Tight risk control.
Watch for price reaction within the red zone. Entry only if confirmation appears
The setup expires at end of the daily candle close.
Intraday Long Setup | June 11th 2025 | Valid Until Daily ClosePrice retraced to a strong pivot zone.
Structure remains bullish with potential for continuation after pullback.
Tight risk control.
Watch for price reaction within the red zone. Entry only if confirmation appears
The setup expires at end of the daily candle close.

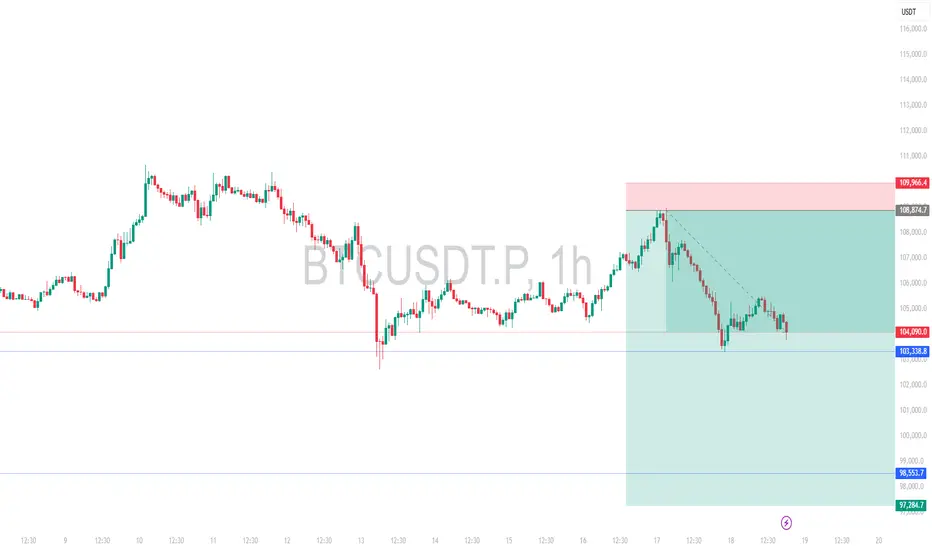
Weekly Short Setup | Valid Until Weekly ClosePrice has pushed through a potential weekly Pivot supply zone (red box) where sellers may step in. This trade is based on the expectation of a rejection from this area.
Entry: Red box — a short entry zone aligned with overhead supply
Stop Loss: Above the red zone (invalidates the setup)
Target: Green box — area to consider partial/full exit based on momentum
BTCUSDT has shown a strong bounce and has now approached a key pivotal resistance zone
Risk-reward is favorable with a tight invalidation and clean downside target
Price may stall or reverse near the red box, creating short opportunity
Note:
This is an weekly setup and idea that expires at Weekly Candle Close. Re-evaluate the setup if price remains indecisive near the entry zone close to that time.