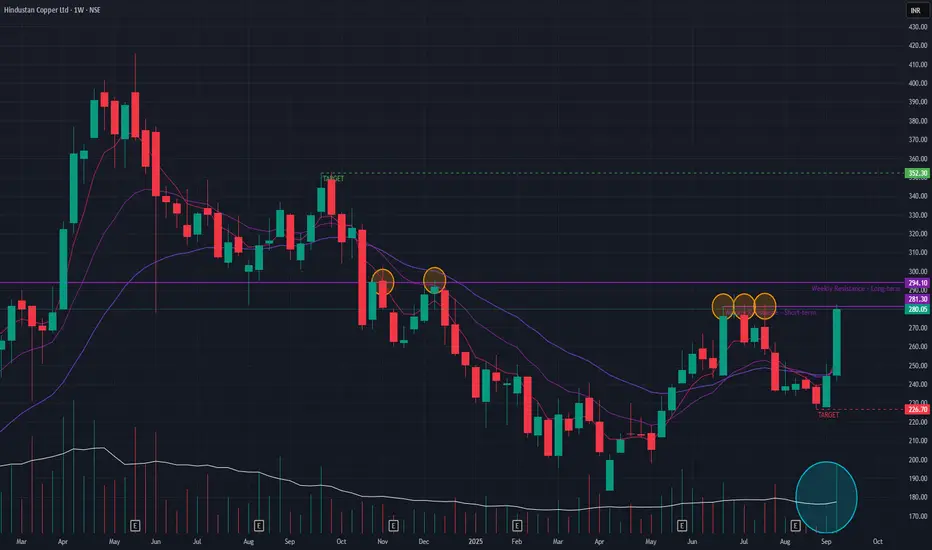
Hind Copper (Weekly Timeframe) - Potential BreakOut Candidate ??After a multi-year uptrend concluding in May 2024, Hindustan Copper entered a corrective downtrend. However, a potential reversal has been forming since April 2025, evidenced by a pattern of higher lows and a constructive setup in its short-term Exponential Moving Averages (EMAs).
This shift in sentiment has been confirmed by a powerful +23.5% rally over the past two weeks, backed by immense trading volume. For the uptrend to continue, the stock must overcome two key hurdles: a near-term horizontal resistance and, more importantly, a multi-year resistance trendline dating back to March 2012. A sustained breach of this long-term resistance would be a significant technical event, potentially paving the way for a move toward ₹352 . Should the breakout fail, a pullback to the ₹226 support zone is possible.
To be monitored !!
Potentialbreakout
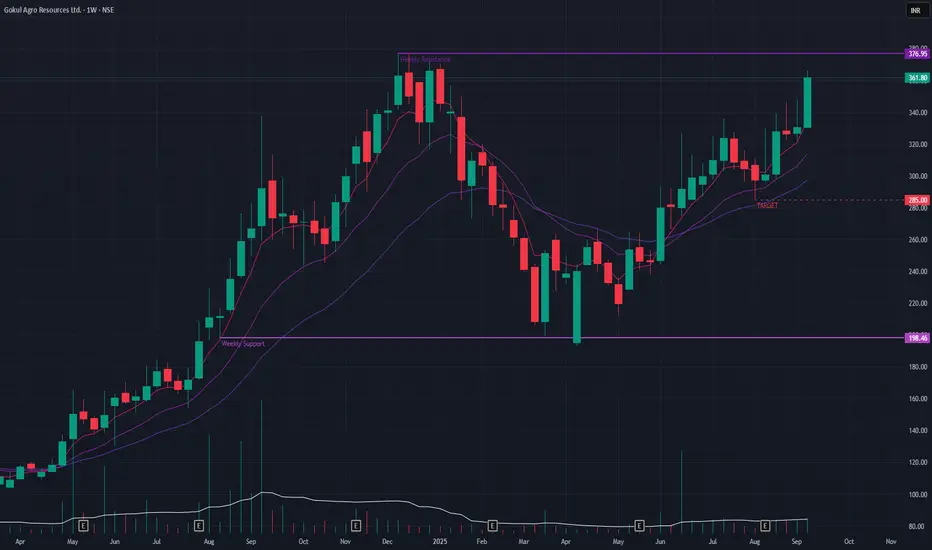
Gokul Agro (Weekly Timeframe) - Can it BreakOut & new ATH ?Gokul Agro has undergone a significant trend reversal, shifting from a downtrend that began in December 2024 to a renewed uptrend since April 2025. This recovery has brought the stock within striking distance of its all-time high (ATH).
Recent price action has been particularly strong, highlighted by a +9.39% gain last week, which was supported by healthy trading volumes, indicating strong buyer conviction. Further technical confirmation comes from the short-term EMAs, which are stacked in a bullish formation, signaling strong upward momentum.
A sustained push through the current resistance could propel the stock to a new ATH. Beyond that, the next projected technical target is the ₹490 level. Conversely, a failure to break out could see the price pull back to the primary support zone around ₹285 .
Monitor the price-action !!
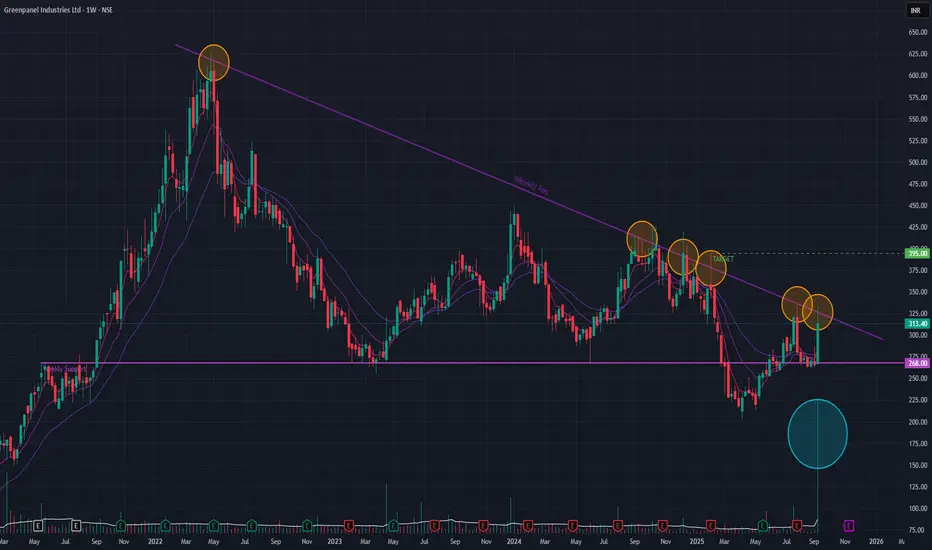
Greenpanel Ind (Weekly Timeframe) - Can it Breakout??After a prolonged downtrend since its peak in April 2022, Greenpanel is exhibiting noteworthy behavior. The stock has repeatedly faced rejection at a critical long-term angular trendline, a key resistance level. However, this past week marked a significant departure from that pattern, with the stock climbing +17.86% accompanied by a massive surge in volume.
This powerful move indicates strong accumulation and a potential exhaustion of sellers. Should the buying interest persist, a realistic near-term objective for Greenpanel would be the ₹395 price level.
Watchout for the price-action !!
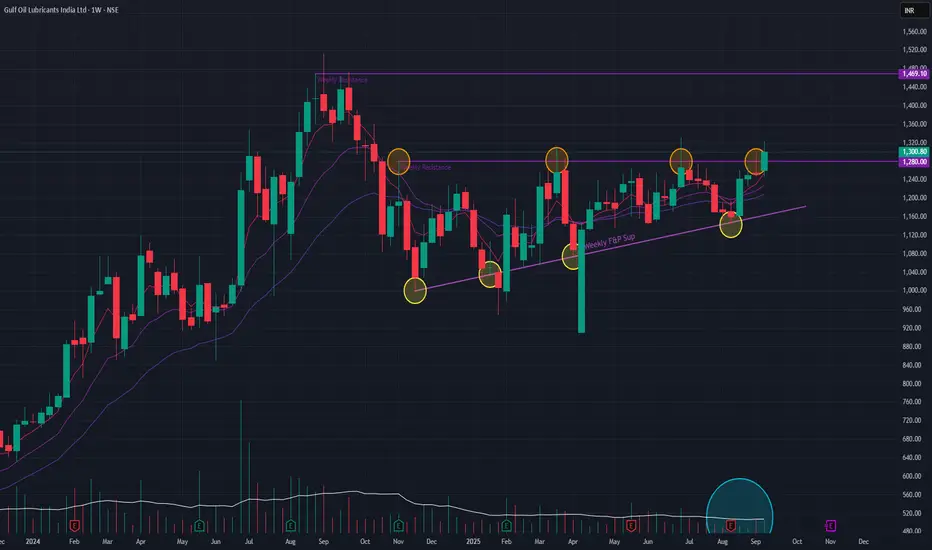
Gulf Oil (Weekly Timeframe) - Potential BreakOut & ContinuationTechnical analysis of Gulf Oil reveals a promising setup. The stock has formed a classic triangle pattern , indicating a period of consolidation before a likely continuation of its preceding uptrend. This week, we've observed a significant breakout attempt, which is notable as it follows multiple rejections from the pattern's upper trendline.
For this breakout to be considered valid, it must be accompanied by a surge in trading volume , confirming buyer conviction. If these conditions are met, the stock could challenge its all-time high of ₹1469 . Further reinforcing this positive sentiment, the short-term EMAs are in a bullish configuration, signaling that momentum is currently in favor of an upward move.
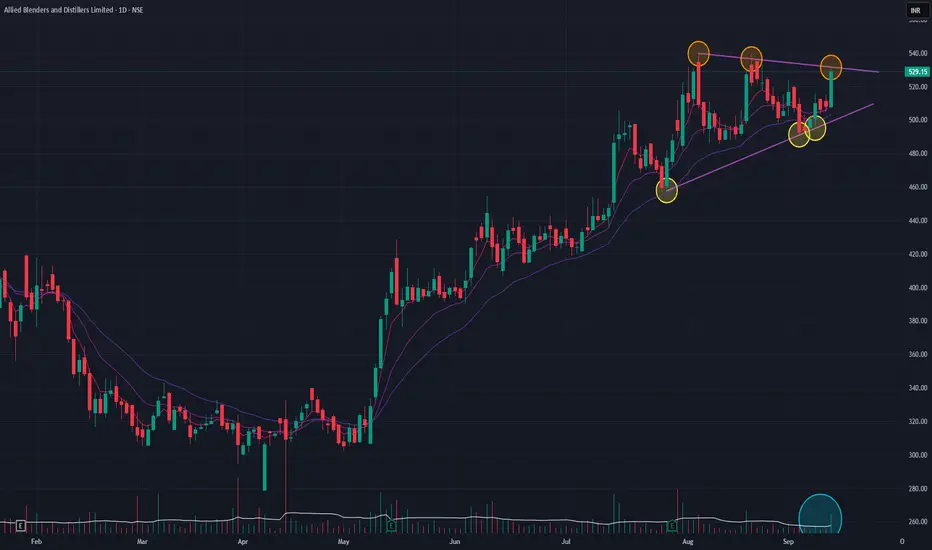
ABDL (Daily Timeframe) - Can it continue the uptrend ??ABDL is in a confirmed uptrend, having rallied over 90% since its April 2025 lows. The stock is now consolidating within a bullish triangle pattern , which typically signals a continuation of the prior trend.
This bullish outlook is supported by several key factors:
Today's significant price surge was accompanied by a massive spike in volume, confirming strong buyer interest and a potential breakout.
The short-term Exponential Moving Averages (EMAs) are in a Positive Crossover (PCO) state , indicating strong underlying momentum.
If the breakout from the triangle is sustained, the next potential price target is the ₹614 level.
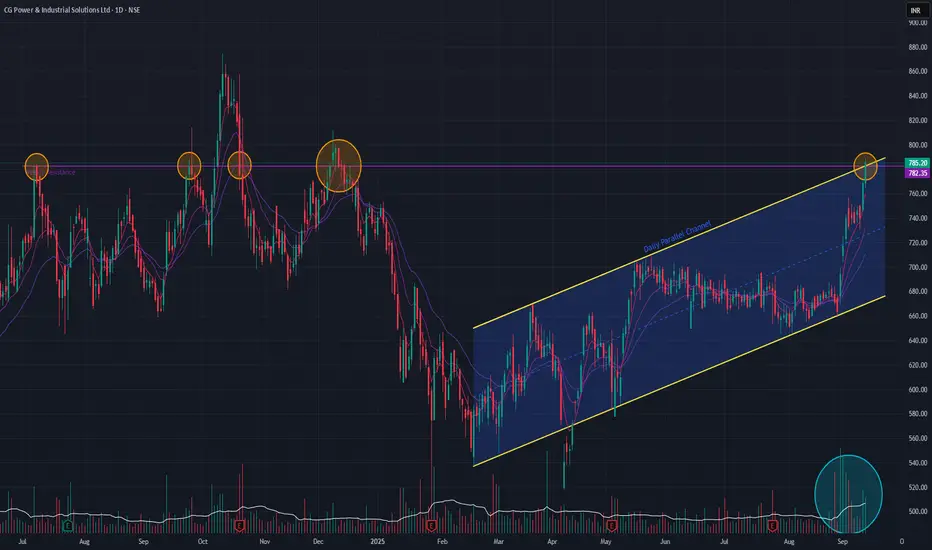
CG Power (Daily Timeframe) - Potential BreakOut CG Power has been consolidating below a major horizontal resistance line established in July 2024, which has so far prevented new all-time highs. Following a downtrend that began in October 2024, the stock has been trading within a well-defined parallel channel.
Today's price action is particularly bullish, as the stock is attempting a breakout from a confluence of resistance: the top of the parallel channel and the long-term horizontal trendline.
This significant move is supported by two key technical indicators:
The short-term EMAs are in a Positive Crossover (PCO) state.
An SMA Golden Cross occurred just a few days ago.
A sustained breakout above this confluence would be a strong signal that the uptrend is resuming.
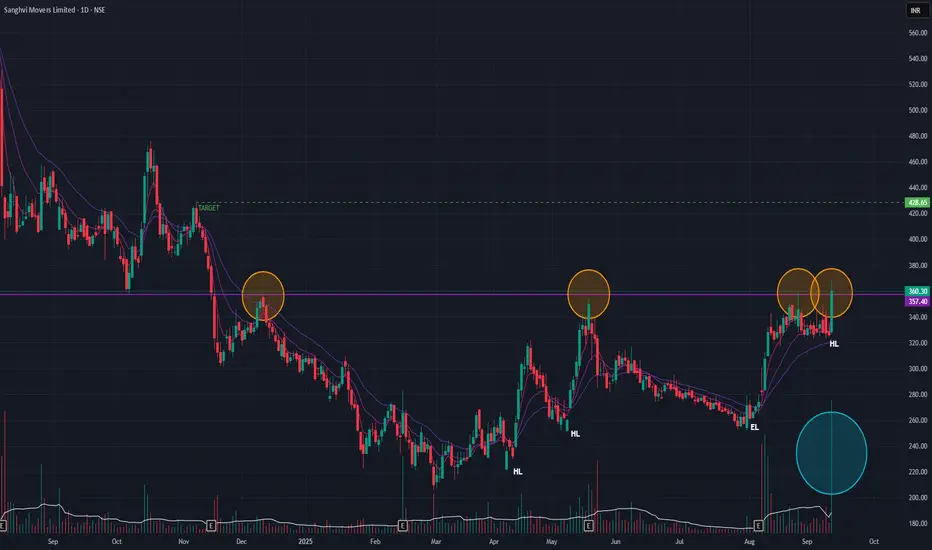
Sanghvi Movers (Daily Timeframe) - Potential BreakOut ??Sanghvi Movers has been in a corrective downtrend since peaking at its all-time high in May 2024. A notable shift in market structure appeared in March 2025, with the stock starting to print a series of higher lows —an early sign of a potential trend reversal.
A significant horizontal resistance, established in August 2023, has capped multiple rally attempts. Today, however, the stock challenged this level with conviction, closing +10.45% higher on massive volume , which suggests strong institutional interest. Bullish sentiment is further reinforced by a recent Simple Moving Average (SMA) Golden Cross.
While we await a confirmatory Positive Crossover (PCO) on the short-term Exponential Moving Averages (EMAs) , a sustained breakout above this resistance could signal the start of a new uptrend. The next logical price target on a successful breakout would be the ₹428 zone.
GreenPly Ind (Daily Timeframe) - Will it BreakOut?Greenply was in a downtrend since Aug 2024 and the trend reversed since Mar 2025. A Long-Term angular resistance that had formed since Aug 2024 has not been breached even after multiple tries. Today the stock made a positive BreakOut with exceptionally huge volume. At the same time, a Long-Term resistance from Dec 2017 is more significant. Short-term EMAs are yet to form PCO state, but we can already see Golden Cross-over since few days.
Will this BreakOut sustain? Let's watchout.

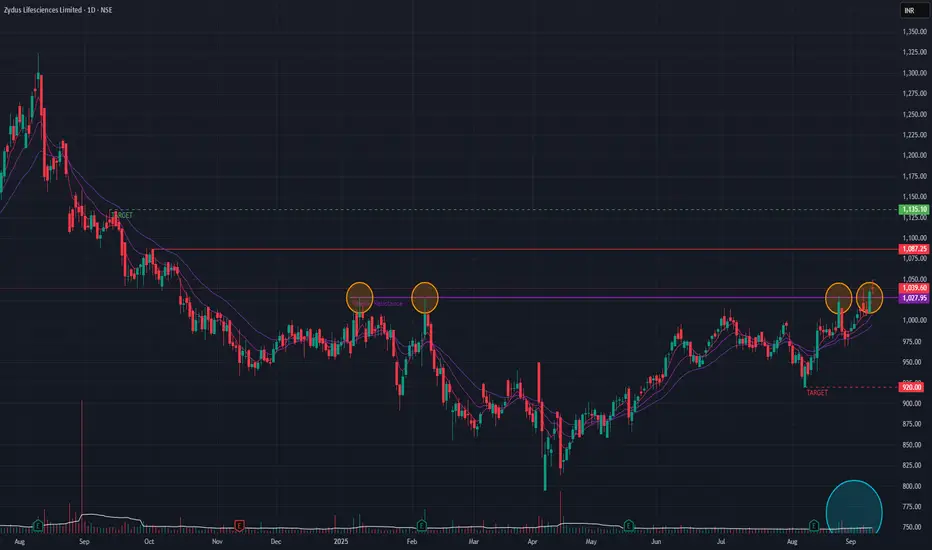
Zydus Life (Daily Timeframe) - Potential BreakOut candidate ??Zydus Lifesciences BrokeOut of a major resistance zone (since Oct 2024) couple of days back and it re-tested the zone again today. The volume is above average though. Short-term EMA's are in PCO state which indicates bullishness.
If the BreakOut sustains then we may see the stock reaching levels of 1135. We may see levels of 920 if the BreakOut does not sustain.
Price-action is to be monitored !!
Motherson Sumi (Daily Timeframe) - A new ATH ??MSumi has broken out of a major resistance trendline today after couple of earlier attempts as indicated. The volume has been exceptionally high since last week. Today as well the volume was huge indicating buyer interest. Short-term EMAs are in PCO state indicating Bullishness. If the momentum continues, we may see the stock making new ATH. Few major resistances to be breached before it can achieve new ATH.
If the stock is able to sustain the momentum, then we may see 67 levels on the upside & if the trend reverses, we may see 40 levels on the downside.
Keep watching!!

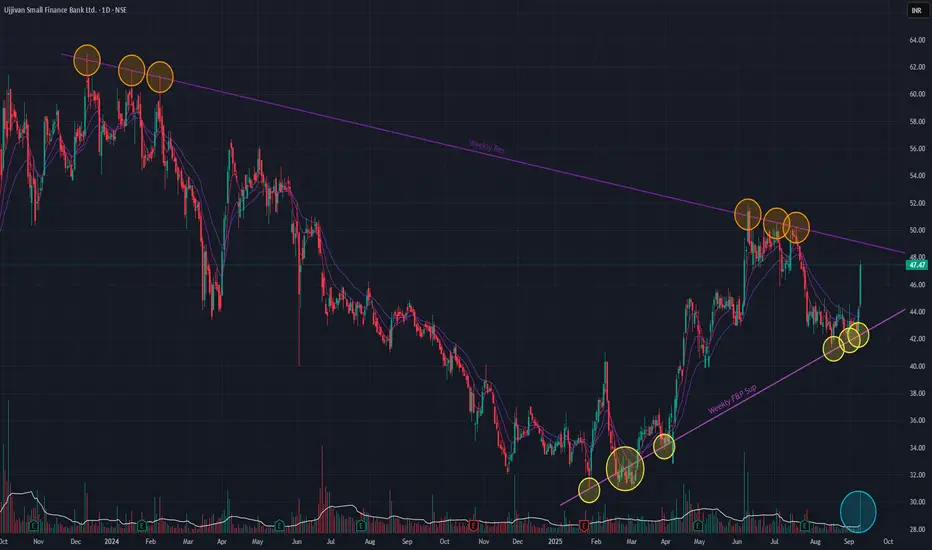
Ujjivan SFB (Daily Timeframe) - Potential BreakOut Candidate ??Ujjivan has been on a downtrend since making the ATH in Dec 2023. Since Feb 2025, there has been a reversal where the stock is making Higher Lows while respecting the support trendline. Since the ATH, the stock has attempted several occasions to BreakOut of the angular resistance trendline, but failed. The past two days there has been a surge in stock price accompanied by huge volume, showing bullishness. Short-term EMAs are also in a PCO state.
Let's wait for the stock to BreakOut of the resistance trendline. Keep monitoring!!
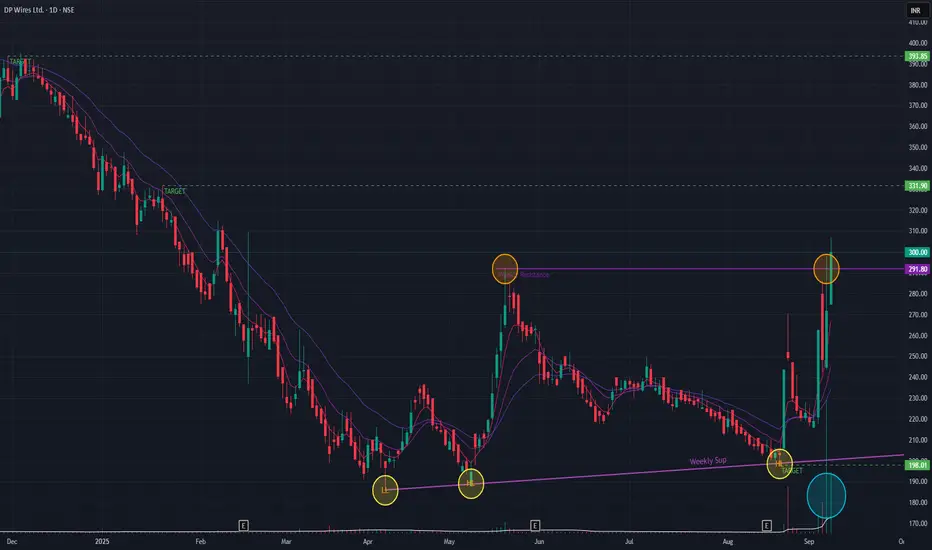
DP Wires (Daily Timeframe) - Can it sustain the momentum??DP Wires has been on a downtrend till Apr 2025 and ever since has been forming Higher Lows which is a bullish signal. Short-term EMAs are in PCO state. With today's bullish candle the stock has broken out of a key resistance trendline with huge volume spike.
The stock may reach 331 levels & thereafter 393 levels if the momentum continues on the upside. We could see levels of 198 if the stock reverses to the downside.
Keep monitoring the price-action!!
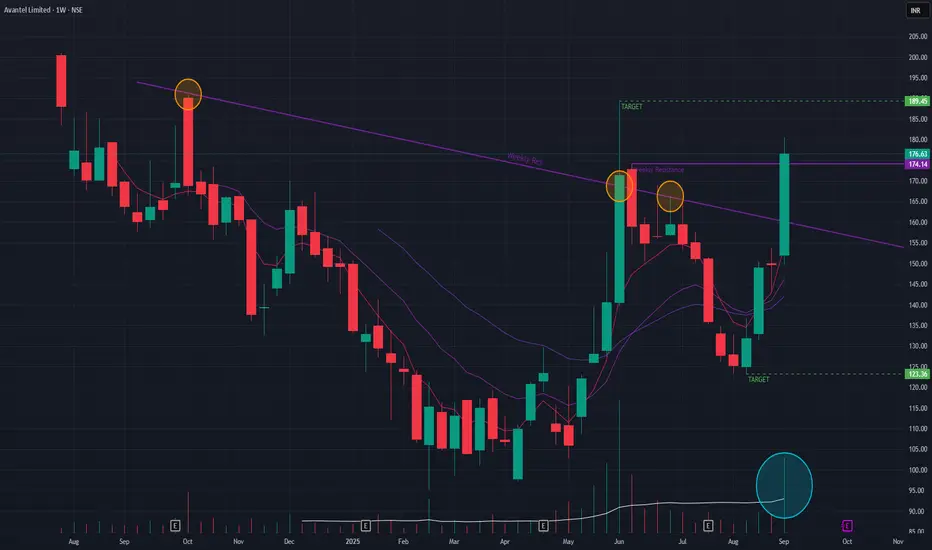
Avantel Ltd (Weekly Timeframe) - Can it sustain the BreakOut??Avantel has been on a downtrend since it's IPO. Since Apr 2025, the stock has been in an uptrend by forming Higher Lows. In the process the stock was able to BreakOut of a key angular resistance as well as a horizontal resistance with a 17.94% surge accompanied with exceptionally huge volume while the short-term EMAs are still in PCO state.
If the momentum continues with some good price-action during the coming week, we may see the stock reach 189 levels. On the downside, we may see the stock reach 123 levels.
Let's watch-out for the price-action during the coming week.
Carysil - Can it sustain the uptrend?Carysil BrokeOut of the horizontal resistance zone and also angular resistance zone with huge volume, last week. The stock surged by 11.59%. Short-term EMAs are still in PCO state which is showing a bullish trend.
With good quarterly earning, the stock may surge further and may reach 1048 levels & thereafter may make new ATHs if the price-action sustains. On the downside, we may see the levels of 768.
Watch-out for next week's price-action.

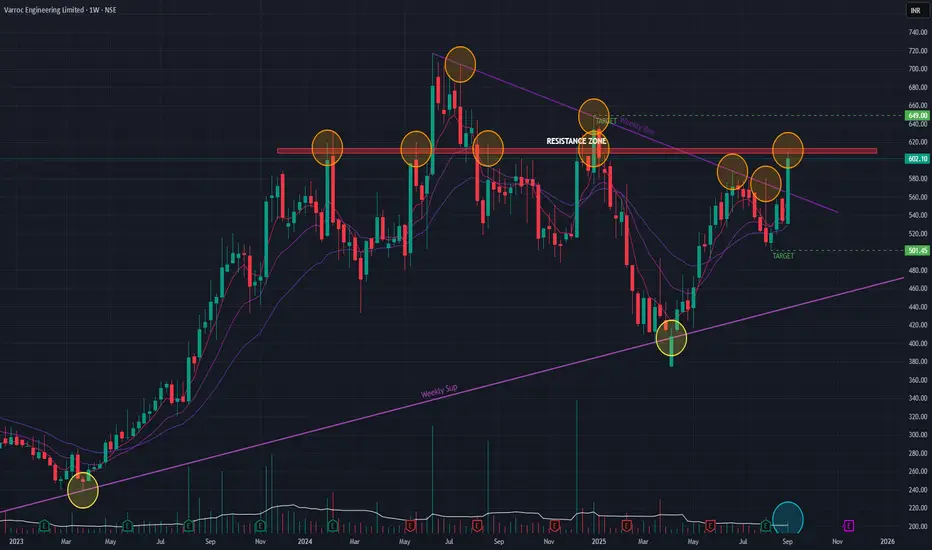
Varroc (Weekly Timeframe) - Potential BreakOut ??Varroc has been mostly in a sideways trend since Dec 2023. Key horizontal resistance zone was brokenout couple of times but that could not be sustained for long. Last week the stock surged by 12.68% with decent volume. With the surge it was able to breakout of a major angular resistance. Short-term EMAs are in PCO state as of last week.
If momentum continues, we may see the stock surge past the resistance zone and may reach 649 levels. On the downside, we may see the stock at 501 levels.
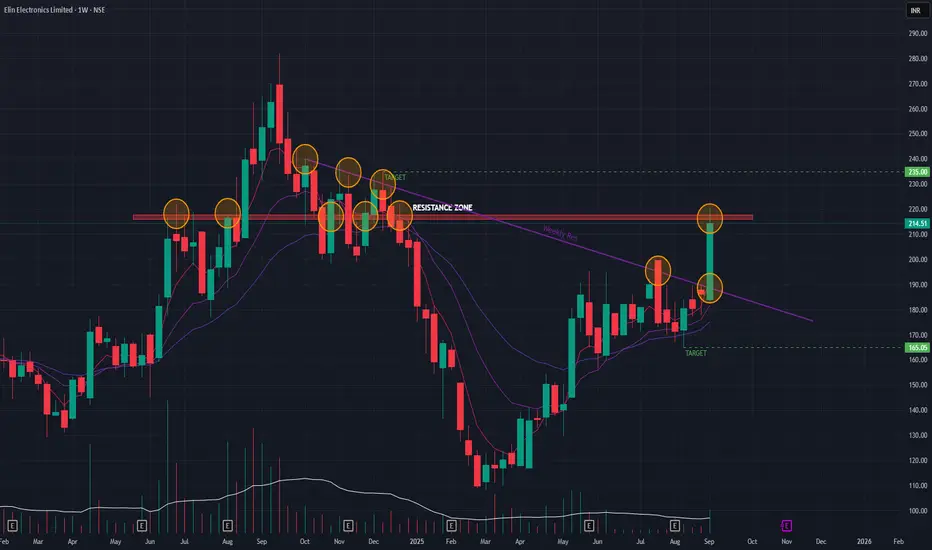
ELIN Electronics (Weekly Timeframe) - Potential BreakOut & ATH??ELIN was at an All-Time High (ATH) in Sept 2024, ever since it has been in a downtrend till Mar 2025. The stock has been on a bullish reversal since then and has broken out of a major angular resistance trendline after several attempts. Last week, it also BrokeOut of a major horizontal resistance zone. The stock surged by 15.19% with above-average volume. The Short-term EMAs are still in a Positive Cross-over state, signaling a bullish trend.
If the stock is able to sustain the uptrend during the coming week, then it may reach 235 levels & thereafter target new ATH. On the downside, it may reach 165 levels considering some profit booking.
Price-action is to be monitored!!!
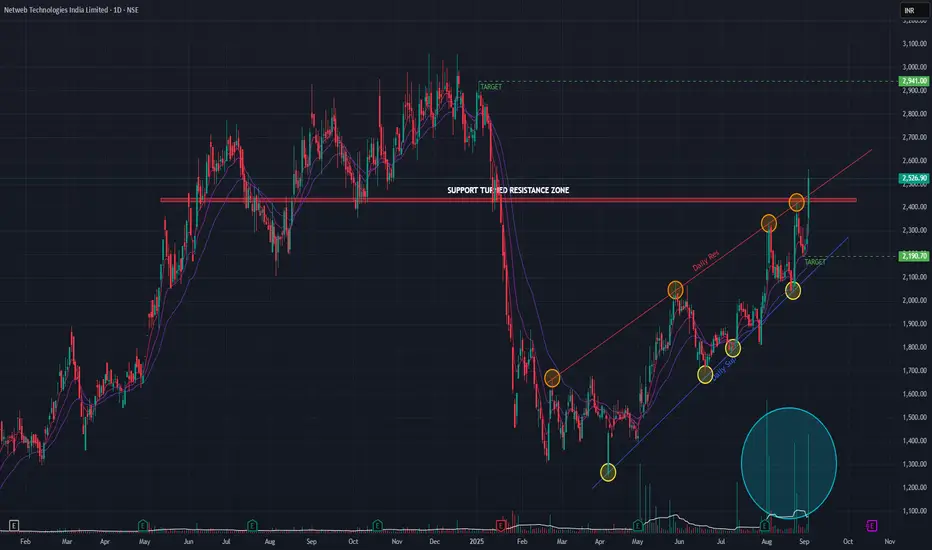
Netweb Tech (Daily Timeframe) - bullish signs ??Netweb has been on an uptrend since Feb 2025 and today it breached a key support turned resistance zone with huge volume. With a +11.48% gain combined with huge volume, the stock also breached the angular resistance trendline as indicated. Short-term EMAs are in positive cross-over state indicating bullish signs.
The recent quarter earnings are also positive for the stock.
If the uptrend momentum continues, then we may see the stock go upto 2940 range. On the downside it may go to 2190 range. The price action on the coming days would be key.
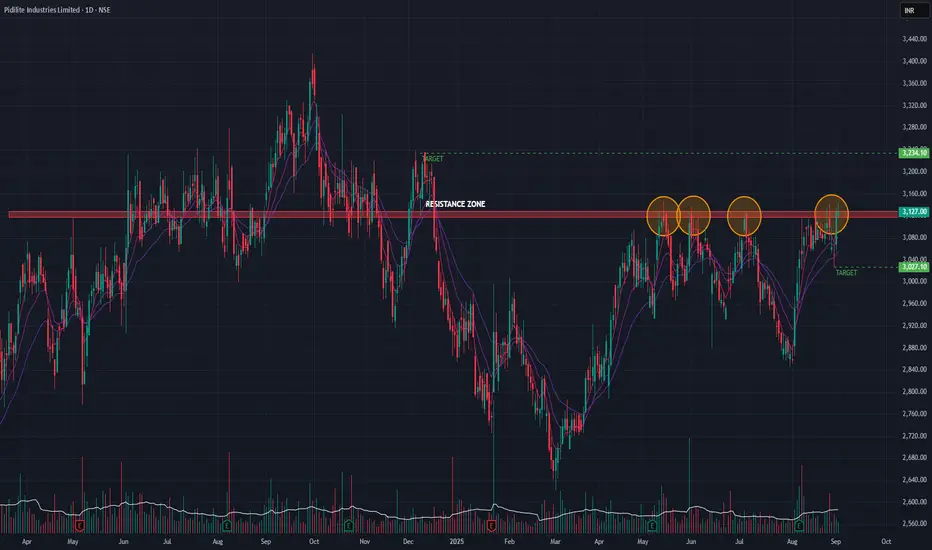
Pidilite Industries (Daily Timeframe) - Potential BreakOut??Pidilite, though with good earnings in the past quarter has not been able to BreakOut of the support turned resistance zone. Few attempts has been made but none of them were successful. The recent past, the stock has been making Equal Highs and Higher Lows. Volume has been decent though. Short-term EMAs are in Positive Cross-Over state.
On upside, the target may be around 3234 & on downside it may go upto 3027.
Monitor the price action in the coming days.
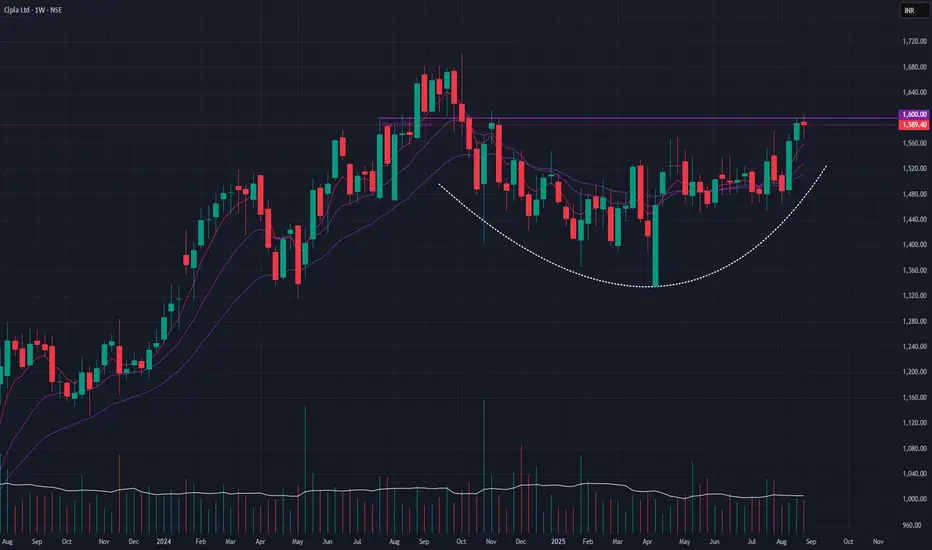
CIPLA (Weekly Timeframe) - Can it breakout ??Cipla has been in an accumulation stage for a while. Few attempts to breakout of the 1600 zone has not been successful. With EMAs in positive cross-over state, the stock looks to breakout of this key resistance zone. The volume is also OK in the past few weeks.
To be monitored on how it goes in the coming weeks.
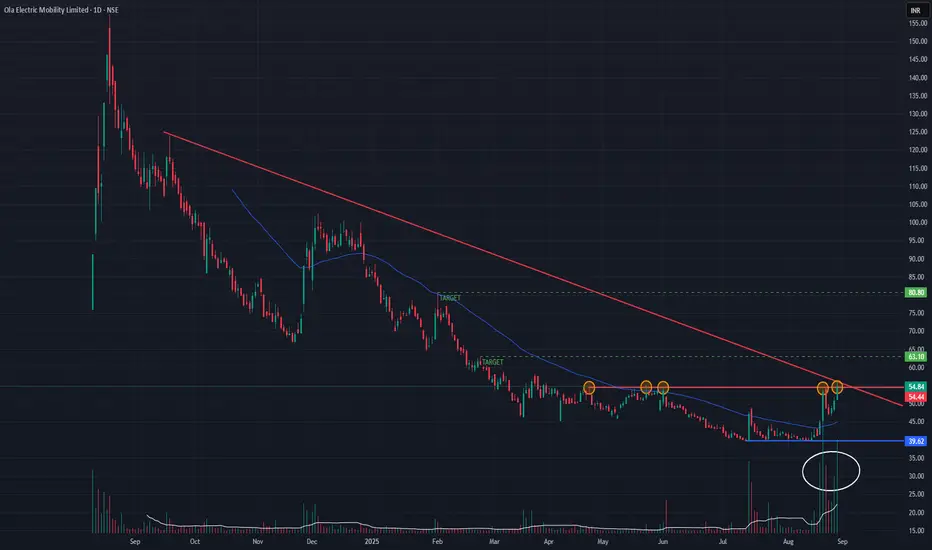
OLA Electric (Daily Timeframe) - Potential Bullish BreakoutOLA has been on a downtrend ever since it's IPO and recently it has shown signs of a reversal . Past few days, the stock has been attempting to Break-Out a major resistance multiple times, as indicated. Today it was able to breach the resistance with huge volume. The next few trading sessions will indicate the stock's trend.
Possible targets are, 62 & 80 if the stock sustains the uptrend.
To be monitored !!!
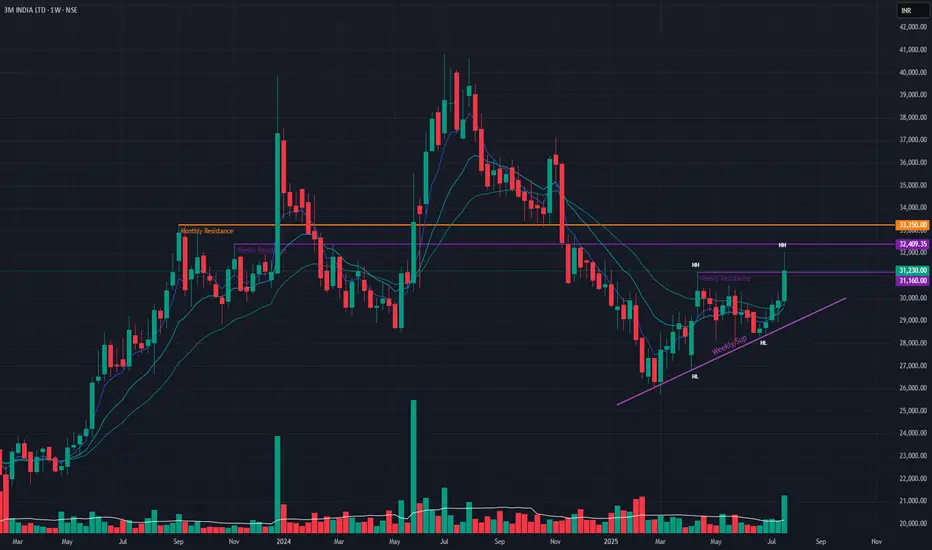
3M India Ltd (Weekly Timeframe) - Potential BreakoutPast few weeks, the stock has been in an uptrend and has breached the short-term weekly resistance during this week with HUGE VOLUME . Next target for the stock is to breach the weekly resistance zone near 32,405. During the week, a positive cross-over of EMAs has been established, indicating positive signs. With this week's bullish candle, the stock has made Higher Highs (HH) while breaching the short-term weekly resistance.
Keep a watch on the stock for next week.
Aarti Drugs Ltd (Daily Timeframe) - Potential BreakOutThe resistance zone (560-570) was breached only once , and thereafter, the stock was in a downtrend for a prolonged duration. Recent past, the stock has been forming Higher Lows & a buildup in volume in the past few days. The stock gained almost 19.5% over the last few days, assisted by huge volume. On Jul 15, the stock BrokeOut of a major resistance with huge volume, and today it tried to breach the long-term resistance.
The Short-term EMAs are in PCO state as well as a Golden Cross-over has formed few days back, which indicates further uptrend.
We should monitor the stock in the coming days for its price action to take a call.

Greenply Industries Ltd (Weekly Timeframe) - Potential BreakOutGreenply was in a downtrend since Aug 2024 and since Feb 2025, the stock has been in an uptrend forming Higher Lows . Last week it has BrokenOut a major resistance with +9.01% gain including a huge spike in volume . If the momentum continues, it may BreakOut the next key resistance at 365.
To be monitored !!
