Powergrid inside Perfect Descending Parallel Channel PatternPowergrid seen travelling perfectly inside the descending channel pattern, taking perfect resistance and support at the channel (from April 2025 till now)
Now seen at the perfect crucial point where it can either move bullish or bearish in the upcoming days
Bearish view gets cancelled on getting past the red dotted line...till that we can't be bullish on Powergrid!!!
Just add to the watchlist and let's watch how its going to move!!!!
will update once the decider move occurs!!!!
Just Sharing my view ...not a tip nor Advice!!!
Thank you!!!
POWERGRID

Power Grid (D): Aggressive Bullish (Guidance-Backed Breakout)(Timeframe: Daily | Scale: Linear)
The stock has staged a violent recovery from its long-term support zone of ₹250. This is not just a technical bounce; it is a Fundamental Re-rating driven by the Capex hike and strong Q3 numbers.
🚀 1. The Fundamental Catalyst (The "Why")
The technical breakout is fueled by three major factors:
> Capex Upgrade: The management raised its FY26 capital expenditure guidance to ₹32,000 Crore (up from ₹28,000 Cr). Higher capex implies higher future asset capitalization, which directly boosts regulated returns (RoE).
> Q3 Earnings: The company reported an 8% YoY jump in Net Profit (₹4,185 Cr) and declared a second interim dividend of ₹3.25/share .
> Sector Tailwind: The Power sector is rallying post-Budget expectations, and Power Grid is the primary beneficiary of transmission grid expansion.
📈 2. The Chart Structure (The Double Bottom)
> The Support: The ₹251 – ₹254 level.
- Significance: The stock took support here in Feb-Mar 2025 and again in Jan 2026. This formation creates a classic "Double Bottom" on the weekly/daily charts.
📊 3. Volume & Indicators
> Volume Ignition: The 37 Million volume is an "Institutional Stamp." It confirms that "Smart Money" is entering to ride the upgraded growth guidance.
> RSI: Rising in all timeframes. The Daily RSI is about to break above 60 with such volume indicates the start of a new "Markup Phase."
Conclusion
Look out for the price action in the coming days

Power Grid: At the End of Expanding WedgeAfter strong impulsive move from ~246 Low to ~322 High(A), Price pulled backed (Internal retracement) to near 0.786% of A, in the form of three drive pattern/Expanding wedge.
Strong support price holds @ 244-246 zone for the Expected Rally to 61.8%(minimum rally), 100% of A and 168% of A.
Breakout of Pattern is the strongest confirmation for the trend reversal.

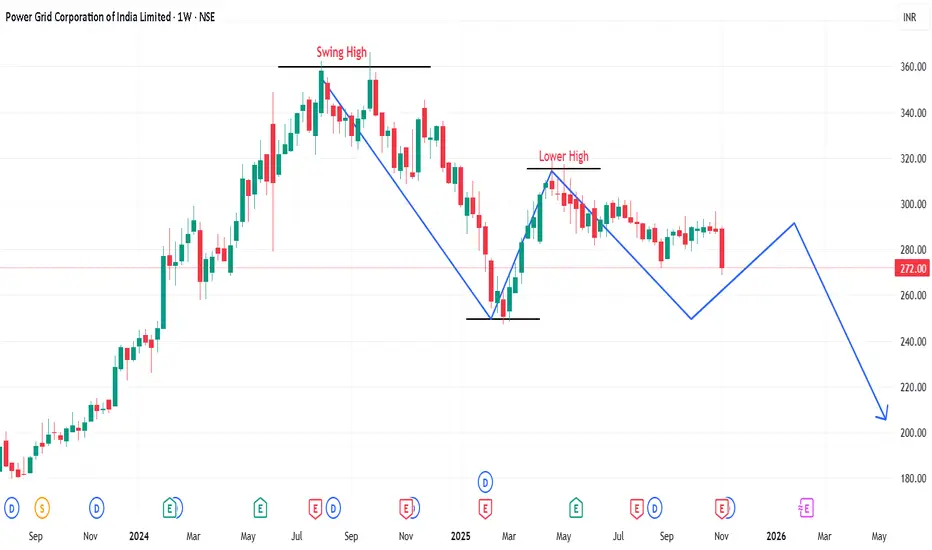
Will Powergrid showing sign of exiting it??Power Grid has been trading in a range for a while and it is showing sign of some weakness.
Major Trend - Down Trend
As there is a BoS of the previous market cycle.
Minor Trend - Sideway to range bound.
The market tends to retest the swing low in the coming month.
Stock has taken a strong resistance from 20 & 50 EMAs. Weekly close is below 100 EMA.
If the stock follow through the downside movement, entry for a sell trade is there with a 1:2 R:R ratio.
Entry :- 270
Stop Loss :- 279
Target :- 259
Last week the index too has supported the fall. If the index remains negative, full quantities can be punched around 270, in case of a retest half quantities can be sold around the retest and the price action near resistance levels while remaining quantity to be entered once the price action is in our favor.
Powergrid: Falling wedge pattern- Bullish breakout.Price has given the breakout already, but the entry is pending as I'm waiting for a retest of the entry level 290-291.30 range as support to validate the entry level.
The stop loss will be the upper trendline of the falling wedge for the upper side target. Targets are set as recent swing highs. Targets are 301, 310, 317 and 321-324.
On a higher timeframe, a triangle pattern is also evident, but I'm more bullish on this stock. If the price falls back within the wedge, a new updated video will be shared.

NTPC seems Bearish !!NTPC technically is getting ready to take support at 310 range ....if 310 too gets broken, major support at 299.
Rounding top fits perfectly and as a result we can expect the down move in the next few days.
Let's wait and watch ...how it moves!!!!
Just my view...not a tip nor advice!!1
Thank you!!

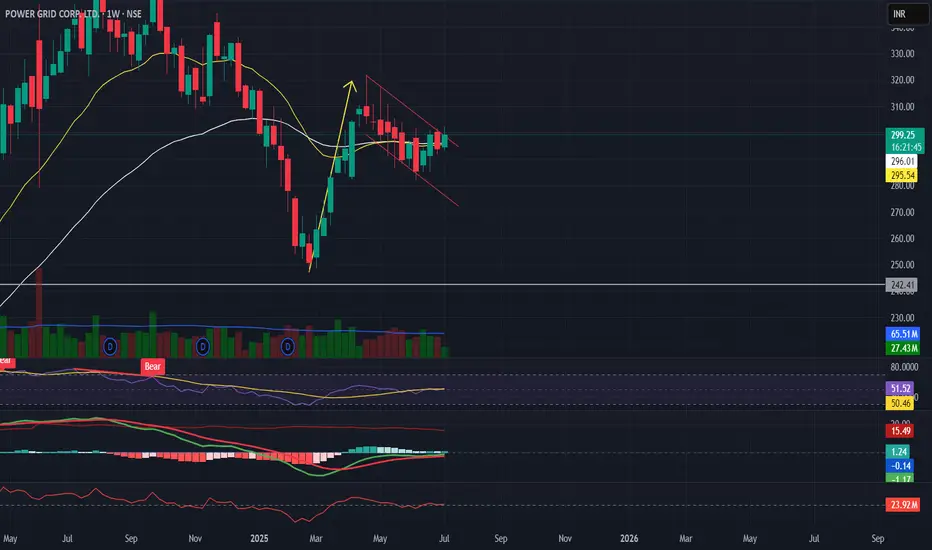
Powergrid showing Many Bullish signs!!!Things explained well in the chart...
Showing you the Monthly and Weekly charts below as Snapshot
For the past 5 years, September been giving good movement for Powergrid(3 years giving nearly 9% upmove)...Let's wait and watch!!!
Just my view ....not a tip nor advice!!!!
Thank you!!!
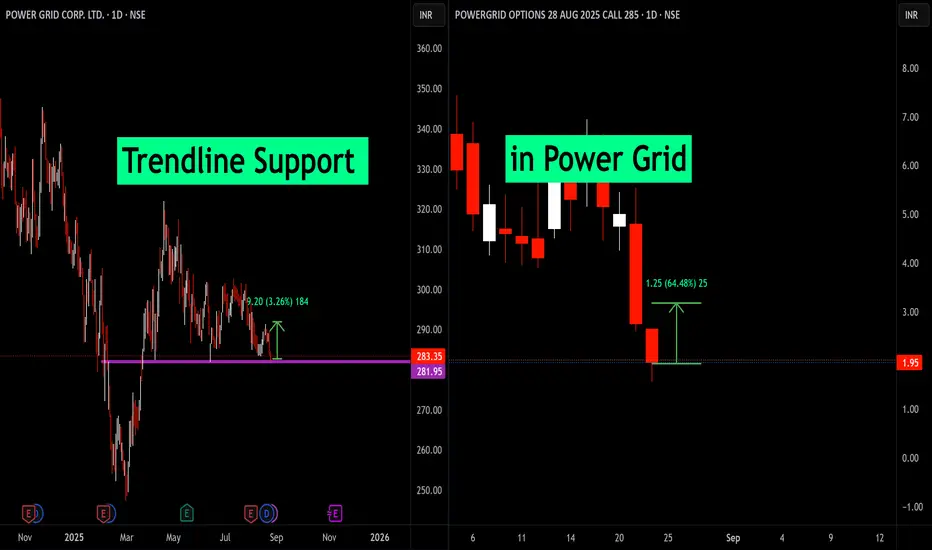
Trendline Support in Power grid On the daily chart, Power Grid has once again tested its long-held trendline support zone near ₹282–284. This level has acted as a reliable demand area in the past, and today’s price action showed another strong reaction.
Price rebounded +3.26% from the support, confirming active buyers at this zone.
In the derivatives segment, the 285 CE (28 Aug 2025 expiry) option also responded sharply, rallying +64% intraday from its recent low.
This confluence between cash price action and option movement highlights the strength of this support zone.
📌 Trading Viewpoint:
As long as the ₹282 level holds, short-term bullish momentum could sustain. A decisive break below, however, would negate this setup and invite further downside.
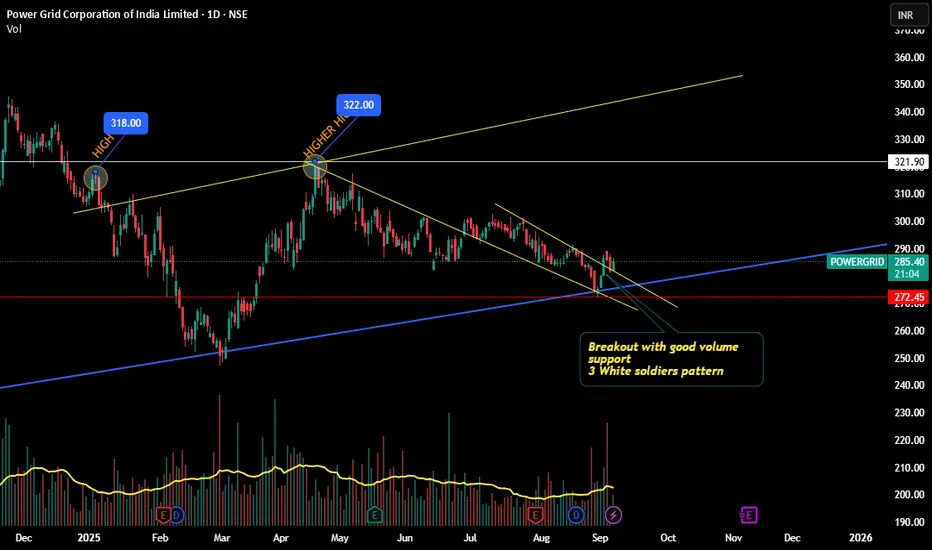
Powergrid - 10% Upmove possible?!!!Chart patterns suggest me the above titled opinion
1. Monthly chart shows a Mother baby candle (feb and march 2025)
2. Weekly chart too shows a good inside bar candle with good volume support and Breakout visible (shown below)
3. In daily time frame, there is an expanding channel pattern... . Higher high formed indicates a bulls edge .
4.Let's wait for the Breakout and enter the trade
5.Target levels mentioned @ chart.
This is just my opinion...not a tip nor advice...
Thank you!!!!

Power Grid Flag Pattern Breakout SetupPower Grid – Breakout Plan
Watching for a clean move above ₹300 level.
Hourly chart shows Cup & Handle formation, while Daily/Weekly has Flag pattern attempting breakout.
✅ Breakout level: ₹300 (confirmation close needed)
✅ Stop-loss: ₹290–294 (below support / ATR-based)
✅ Target 1: ₹328 (Fibonacci 0.618 – Golden Ratio)
✅ Target 2: ₹375 (Measured Move)
Indicators:
EMAs rising on hourly, steady on daily.
RSI strong but nearing overbought on lower timeframe.
MACD positive momentum.
Watching volume for confirmation.
Macro Drivers:
Government infra spending.
Cooling inflation.
Rising electricity demand in India.
✅ Plan: Wait for confirmed breakout with volume. Strict risk management with pre-defined stop.
POWER GRID - INVERSE HEAD & SHOULDERS BREAKOUTSymbol - POWERGRID
Power Grid Corporation of India Ltd. is a Maha-ratna Public Sector Enterprise and a key player in the Indian power transmission sector. It operates as a central transmission utility and is involved in the planning, implementation, and maintenance of transmission systems across the country.
Recently, the stock has exhibited a notable bullish breakout after forming an Inverse Head and Shoulders pattern. A classic reversal formation signaling a shift from a downtrend to an uptrend. Following the breakout, the stock may witness a retest of the neckline zone, which now acts as a support area - around 300 to 303 range. This zone offers a favorable risk-reward entry for positional investors anticipating further upside.
The projected target from this breakout lies near the 350-355 zone, offering a potential 17-20% upside from current levels, based on the height of the pattern added to the breakout point.
For prudent risk management, a stop loss below 280 is advisable, just below the right shoulder, to protect against unexpected downside.
Overall, the breakout of a well-formed Inverse Head and Shoulders on a higher time frame charts presents a bullish outlook for Power Grid, making it a strong candidate for medium-term investment consideration.
Disclaimer: The information provided here should not be construed as a buy or sell recommendation. It reflects my personal analysis and my trading position. Please consider this trading idea for educational purposes only. Thank you!

Power Grid - Weekly EW - Long Set-upEither Wave 4 done or W done.
In both cases a trade till 310 looks good.

POWER GRID SWING TRADEPOWER GRID Swing Trade
Hi This Flip Zone we can see buying from this level 328.5 i taken entry
Towards 1st Target - 345 2nd Target - 363
Seller will come if breaks 322 level the its fail accrdoing to SMC
Note - Only for Education purpose . Do your own research.

POWERGRID RESISTANCE BREAKOUTPowergrid breaking resistance
with volume spike,bullish rsi
trading above 20ema
#target mentioned in chart
NOBUY/SELL RECOMENDATION

POWERGRID 1D TFIn the previous post, I've posted that NSE:POWERGRID is in a demand zone and will retrace. But the market hit stoploss in that trade. Now we can clearly see that NSE:POWERGRID has gained liquidity and moving up. Though a strong bullish candle can be seen. This is a risky entry. Hence be cautious and look for confirmations before entering the trade.
We have discussed this more on our previous post. You can view the previous post by clicking the attachment below this post.
Disclaimer:- This analysis is only for educational purpose. Please always do your own analysis or consult with your financial advisor before taking any kind of trades

PowerGrid-1D TimeframeNSE:POWERGRID is in a uptrend in 1 month timeframe. While coming to lower timeframe, it is clear that the chart has touched the support zone for three times and hence we could go for a long position. There are two partial profits too in this analysis.As the higher timeframe chart is in uptrend, having a long position is advicable.
Disclaimer:- This analysis is only for educational purpose. Please always do your own analysis or consult with your financial advisor before taking any kind of trades
NSE:POWERGRID

Adani Power for 70% gainsDate: 01 Nov’24
Symbol: ADANIPOWER
Timeframe: Daily
The Big Question is - if Wave IV in Adani Power is now over? A higher high after a close above 675 will make it official. Is 570 a strong enough support? Looks like it. As seen in the chart, a circle has been marked as an accumulation zone. Wave V is likely to head to 1050 levels (70% from current price of 600); more clarity on target will emerge as it moves above 750.
Sept quarter results at operational levels were descent but because of lower other income and higher tax; Sept quarter of last FY looks stronger.
This is not a trade recommendation. Please do your own analysis.
HINGLISH VERSION
Bada savaal yah hai ki kya Adani Power mein Wave IV ab khatm ho gaya hai? 675 se upar band hone ke baad ek uchchatar oonchaee ise aadhikaarik bana degi. Kya 570 paryaapt majaboot support level hai? Aisa lagta hai. Jaisa ki chart mein dekha gaya hai, ek sarkal ko accumulation zone ke roop mein chihnit kiya gaya hai. Wave V ke 1050 ke star (600 kee maujooda keemat se 70%) tak pahunchane kee sambhaavana hai, jaise hi yah 750 se upar jaega, target par adhik spashtata saamane aaegee.
Operational star par September quarter ke nateeje achhe the. Lekin other income kam hone aur adhik tax ke kaaran; pichhale financial year ka September timaahee majaboot dikh raha hai.
Yah koi trade lene ki salah nahi hai. Kripya apana vishleshan svayan karein.

Tata Power for 20% gainsDate: 27 Sept’24
Stock: Tata Power
Timeframe: Daily chart
Tata Power seems to be in Wave V of 5 which is heading towards 580 levels (20% from current price of 485) as seen in the chart. It is then likely to go into a longer consolidation (a larger timeframe Wave 4) which I will analyse in due course. Likely to achieve this target by end of this year? (Yes, I would like to think so).
This is not a trade recommendation. Please do your own due diligence.

Rounding Bottom in Rising Channel NSE:POWERGRID is Making a Rounding Bottom near its ATH in a Rising Channel giving Respect to 100 EMA with Heavy Volumes once breaking it, it will continue its uptrend Further ahead in days to come. Keep on Watch.
Disclaimer: This analysis is intended solely for informational and educational purposes and should not be interpreted as financial advice. It is advisable to consult a qualified financial advisor or conduct thorough research before making investment decisions.

INVERSE HEAD & SHOULDER BREAKOUTThe stock has given a strong breakout in Daily time frame.
The height of the neckline can be taken as a target

Buy Power Grid Corporation Short Term Trading Advice by Goodluck Capital
Buy Power Grid Corporation
Buy Range- 325 - 330
Target- 344 - 348
StopLoss- below 313
Potential Return- 6-7%
Approx trade duration 10 - 12 days

Powergrid - Bullish IdeaStrong turnaround from support area
Making HH and HLs
Breaching ATHs
Gap Up
Volume activity suggest strong momentum in coming days
Strong support zone at 335-340
Perfect recipe for bullish stock

Buy Powergrid Corporation Short Term Trading Advice by Goodluck Capital
Buy Powergrid Corporation
Buy Range- 314 - 324
Target- 335 - 345
StopLoss- below 305
Potential Return- 5-8%
Approx trade duration 14 - 16 days
