The Calm Stocks Swing Strategy - Big Moves Start in Silence!Hello Traders!
Most people believe swing trades work only when stocks are moving fast.
Strong candles, news headlines, social media hype and suddenly everyone feels confident.
But after spending years studying stock charts, I have learned something very different.
The best swing trades in stocks usually begin when nothing looks exciting.
When a stock becomes quiet, volume dries up and nobody is talking about it
that is often when serious preparation starts.
Retail bolega “ye stock toh bilkul boring hai” and moves on 😄
What a Calm Stock Phase Really Means
A calm phase appears when a stock starts moving in a tight range with smaller candles and limited volatility.
Price keeps respecting the same support and resistance levels again and again.
Volume slowly reduces but price structure remains stable which shows balance not weakness
For swing traders, this boredom is not a problem. It is actually a signal to start paying attention.
Why Smart Money Loves Silence
Big players cannot build positions when price is moving fast because it attracts attention.
They prefer calm stocks where accumulation can happen slowly without pushing price.
Low volatility allows them to prepare before the real move begins.
Silence does not mean nothing is happening. It often means something is being built quietly.
Why Retail Traders Miss These Moves
Most retail traders want action and fast movement.
Calm stocks feel uninteresting so they get ignored.
When the breakout finally happens, retail notices it late and enters emotionally.
Retail chases movement. Swing traders prepare before movement.
How I Personally Trade Calm Stock Swing Setups
I scan daily and weekly charts to find stocks moving in tight consolidation ranges.
I check whether price is repeatedly reacting from the same support and resistance zones.
I focus on stocks where volume is reducing but structure is still clean.
Instead of chasing breakouts, I plan entries near the range with limited risk.
This keeps my mind calm and decisions logical. No pressure and no hurry.
Real Chart Example: Hero MotoCorp
To make this concept practical, I have explained it using the Hero MotoCorp daily chart above.
If you look closely, the stock spent a long time moving inside a tight consolidation zone.
Price reacted multiple times near resistance and support while volume kept reducing.
During this phase, many traders ignored the stock because it looked slow and boring.
But this calm structure was actually preparation.
Once the stock finally broke out, it delivered a clean swing move with strong follow through and very limited pullbacks.
This is exactly how calm stocks reward patience.
Main yahi karta hoon, I study the silence first and let the move come to me.
The Breakout Is the Result Not the Start
Most traders believe the breakout candle is the opportunity.
In reality, the real edge comes from preparation during consolidation.
When volatility expands, the swing trader is already positioned.
Jab sab excited😄hote hain tab smart planning already ho chuki hoti hai.
Rahul’s Tip
If a stock feels too quiet, too slow or too boring, do not ignore it immediately.
Sometimes silence is the market’s way of preparing something big.
Patience during calm phases has helped me far more than chasing excitement.
Conclusion
The Calm Stocks Swing Strategy teaches you to think opposite to the crowd.
Instead of chasing noise, you learn to prepare during silence.
In stocks, the loudest moves often begin when nobody is paying attention.
If this post helped you see calm stocks differently,
like it, share your view in the comments and follow for more practical swing trading insights.
Priceactionstrategy

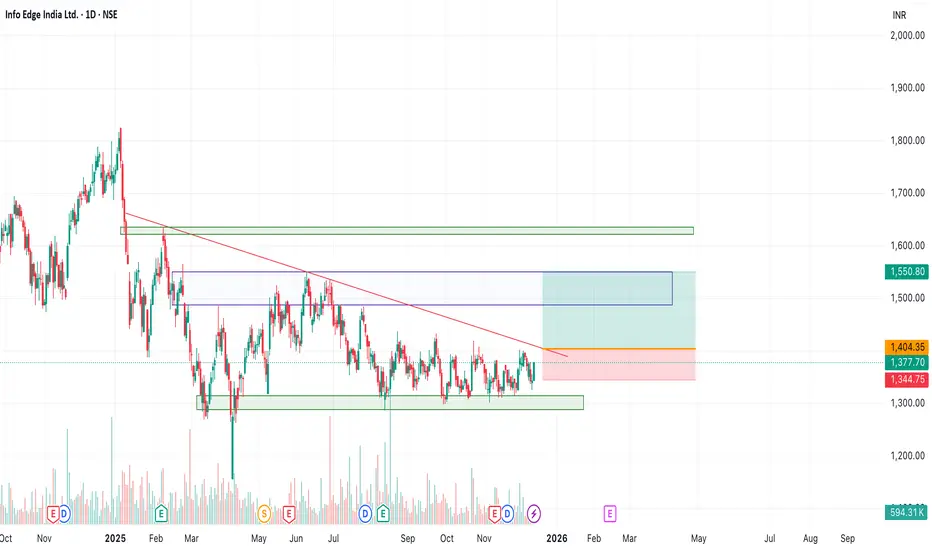
NaukriInfo Edge - Consolidation is ongoing and near breakout.
Above 1405, there is a breakout and target will be in range of 1490-1550.
Above 1550 it will be 1620-40.
Keep hold for the long term will give good returns.
TRADING PLAN XAUUSD 12/1/2025🔔 Hello everyone!
Let’s take a quick look at today’s market context and the trading plan for gold (XAUUSD).
📌 1. Market Context & Fundamentals
Gold has broken above the previous descending trendline and is maintaining a bullish structure on the H4 timeframe.
Bullish momentum is supported by several macro factors:
Expectations of a Fed rate cut in December.
Geopolitical tensions between the U.S. and Venezuela, as well as rising friction between Japan and China, which increases safe-haven demand.
Price may move sideways/pin during the session before continuing its broader uptrend.
2. Main Trading Idea: BUY BIAS
✅ Key BUY Zones
4190 – 4194
4150 – 4153
4105 – 4110 (deeper zone)
Nearest zone: 4210 – 4215
➡️ Each entry targets approximately 100 pips
3. Short-term SELL Reaction Zones (Scalping Only)
4250 – 4256 (recent high)
4294 – 4295
4300
4312 – 4315
➡️ Sell setups are only for quick scalps, not for holding long. Target ~100 pips
4. Expected Price Scenarios
If price pulls back to support → look for BUY setups aligned with the trend.
If price reaches strong resistance → only scalp SELL setups, avoid long holding.
Overall trend remains bullish, so BUY remains the primary strategy.
Summary
H4 Trend: Bullish
Trading Bias: Mainly BUY – SELL only at key resistance for scalps
Macro & geopolitical environment is supportive for gold upside.

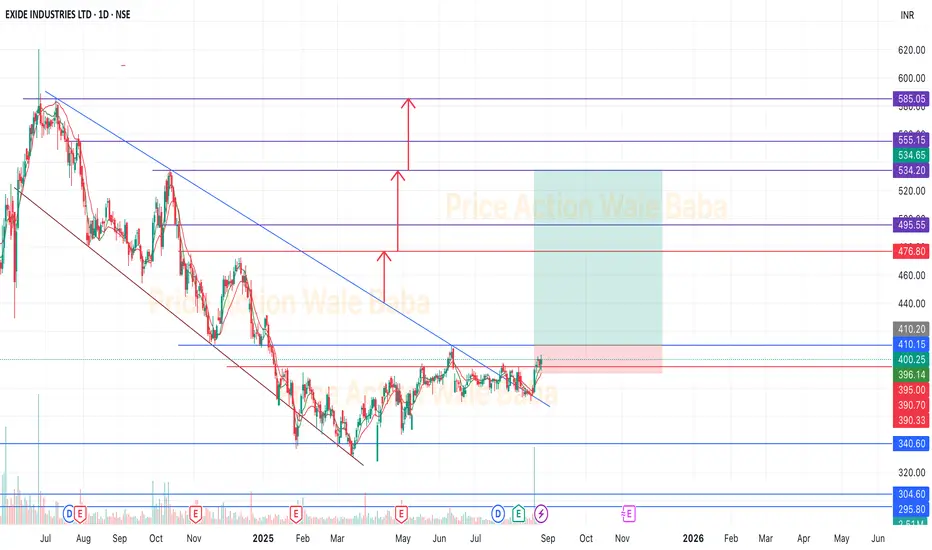
ExideExide is near breakout.
Looks good to buy on dip. In short term, it can give the good returns.
Company under power sector and making batteries for two and four wheeler. So, diwali sales can grow and give good result.
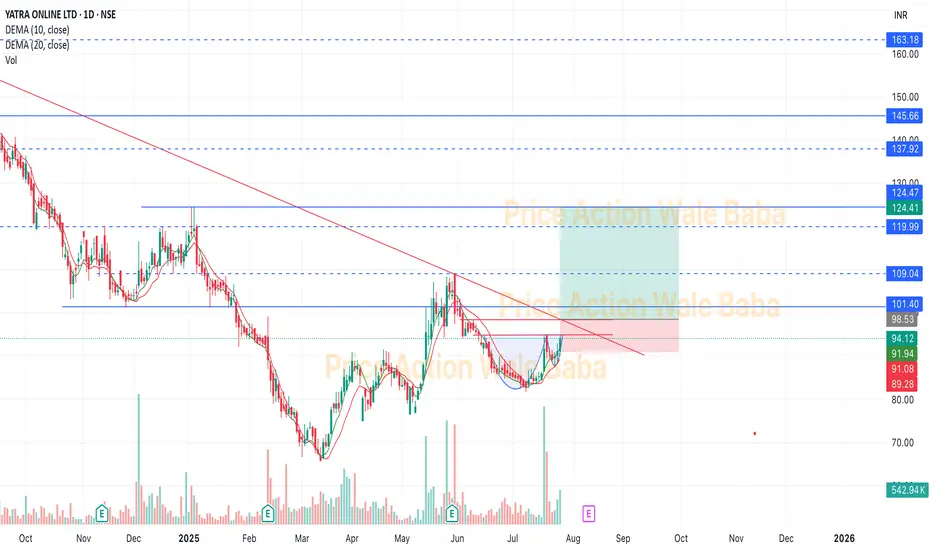
Yatra Online LtdYatra Online Ltd
a) YOL deals in the entire value chain of travel and hospitality, covering B2C and B2B segments.
b) It is the largest Corporate travel services provider, and one of the largest OTAs with ~80,000 domestic hotels and homestays contracted in ~1497 cities.
c) It provides a Real-time and Integrated SaaS Tech Platform which is accessible through the desktop & Mobile apps.
d) The company has a customer base of over 1,300 large corporates with addressable employee base of 9+ million employees.
Service:
The company is one of India’s leading online travel platforms, offering comprehensive corporate travel services to over 850 corporate clients. It facilitates bookings for domestic and international flights, hotels, holiday packages, buses, trains, cabs, homestays, cruises, and local activities. With a network of approximately 108,000 hotels and homestays across 1,500 Indian cities and access to around 2 million hotels globally, it stands as the largest domestic hotel platform in India.
Market Cap: ₹ 1,477 Cr.
Promoter holding: 64.5 %
FII holding: 2.82 %
DII holding: 19.1 %
Public holding: 13.6 %
Debt: ₹ 78.4 Cr.
Debt 3Years back: ₹ 62.8 Cr.
Looks good to buy on every deep, once breakout come it will give good movement.
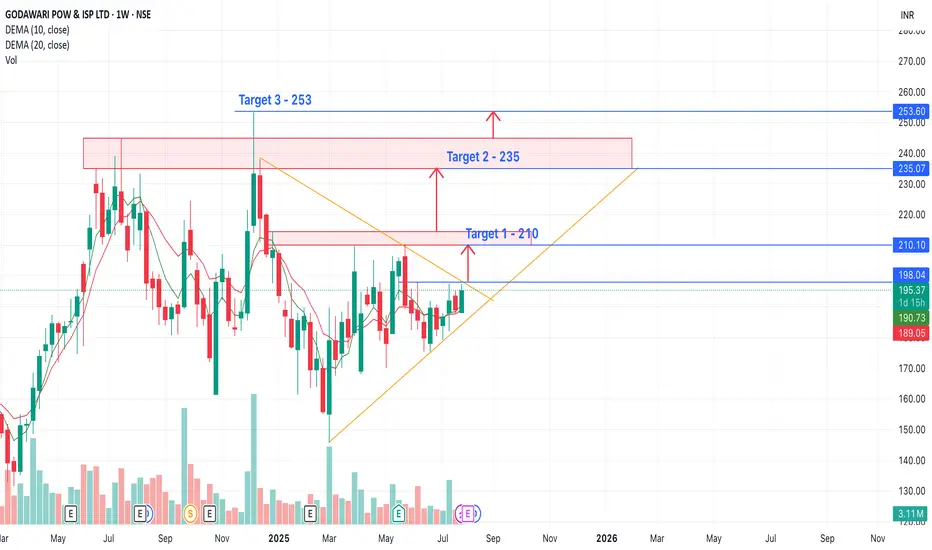
GPIL - Near BreakoutGodawari Power & Ispat is mainly engaged in the business of Mining of Iron Ore and Manufacturing of Iron Ore Pellets, Sponge Iron, Steel Billets, Wire Rods, H.B. Wire and Ferro Alloys with generation of Electricity.
Market Cap: ₹ 13,084 Cr.
Promoter holding: 63.5 %
FII holding: 6.51 %
DII holding: 2.67 %
Public holding: 27.3 %
Debt: ₹ 309 Cr.
Debt 3Years back: ₹ 428 Cr.
Stock near resistance, Above 198 look breakout and good to buy and hold.
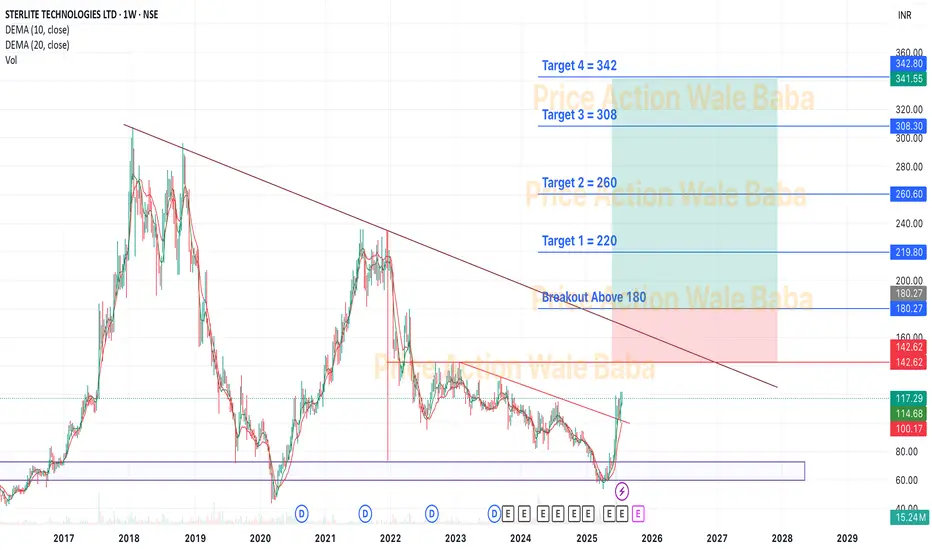
Sterlite Technologies Ltd - Near Breakout.Sterlite Technologies Limited was established in July 2001 after the demerger of the telecom division of Sterlite Industries Ltd (SIL). In July 2006, STL acquired the transmission line business of SIL to foray into the power transmission cables business. STL has grown over the years to become the largest Optical Fiber and Optical Fiber Cables manufacturer in the country. The company also has sizeable presence in the overseas markets with an established presence in the global optical fiber market.
The company’s global ex-China Optical Fiber Cables (OFC) market share was 8% in FY24 vs 12% in FY23. It is among the largest and lowest-cost producers of Optical Fibre and OFC in India because of extensive backward integration.
Order Book
As of Q4 FY24, the company's order book stood at Rs. ~10,200 Cr vs Rs. ~9,800 Cr in Q3 FY24.
Telcos: 59%
Citizen Networks: 22%
Enterprises: 19%.
Optical Connectivity portfolio in US
On 29 July 24, the company announce the expansion of its Optical Networking capability with the addition of its Optical Connectivity portfolio in the US market.
Market Cap: ₹ 5,723 Cr.
Promoter holding: 44.4 %
FII holding: 6.74 %
DII holding: 11.3 %
Public holding: 37.5 %
Debt: ₹ 1,926 Cr.
Debt 3 Years back: ₹ 3,475 Cr.
Note: Debt is decreasing
Southern Petrochemicals Industries Corporation - Near Breakout Southern Petrochemicals Industries Corporation Ltd is engaged in manufacturing and selling Urea and Nitrogenous chemical fertilizer.
The company’s product offerings include Primary nutrients, Secondary Nutrients, Water Soluble Fertilisers, Organic Fertilisers, Non-edible deoiled Cake Fertilisers, pesticides, industrial products, etc.
Power Arrangements
The company’s associate Greenam Energy operates a 22.0 MW AC Floating Solar Project to meet the Renewable Power obligations stipulated by the Government.
Market Cap: ₹ 2,008 Cr.
Promoter holding: 53.4 %
FII holding: 6.53 %
DII holding: 0.29 %
Public holding: 39.8 %
Debt: ₹ 722 Cr.
Debt 3Years back: ₹ 305 Cr.

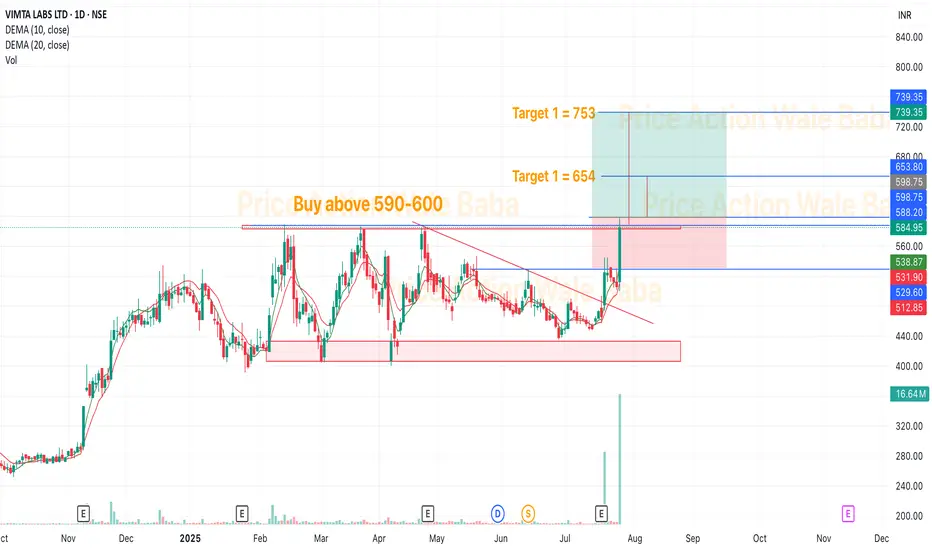
Vimta LabsVimta Labs
VLL is is in the business of contract research and testing in the fields of biologics, small molecules, agro -chemicals, food & beverages, electronics, clinical diagnostics, medical devices, home and personal care products, and environment testing
On July 12th 2024, company approved the scheme of amalgamation of its Wholly Owned Subsidiary company viz. Emtac Laboratories Pvt. Ltd. with the Holding Company
Market Cap: ₹ 2,603 Cr.
Promoter holding: 36.7 %
FII holding: 3.49 %
DII holding: 1.42 %
Public holding: 58.4 %
Debt: ₹ 8.52 Cr.
Debt 3Years back: ₹ 19.0 Cr.
Looks good to buy and hold for the given Targets.
EMA Pullback Entry – The Cleanest Setup for Trend Followers!Hello Traders!
In today’s post, let’s explore one of the most reliable and beginner-friendly setups — the EMA Pullback Entry . If you’re a trend follower looking for clear, rule-based entries , this strategy will become a go-to in your toolkit. It helps you avoid chasing breakouts and instead ride strong trends with precision entries during pullbacks .
What is EMA Pullback Entry?
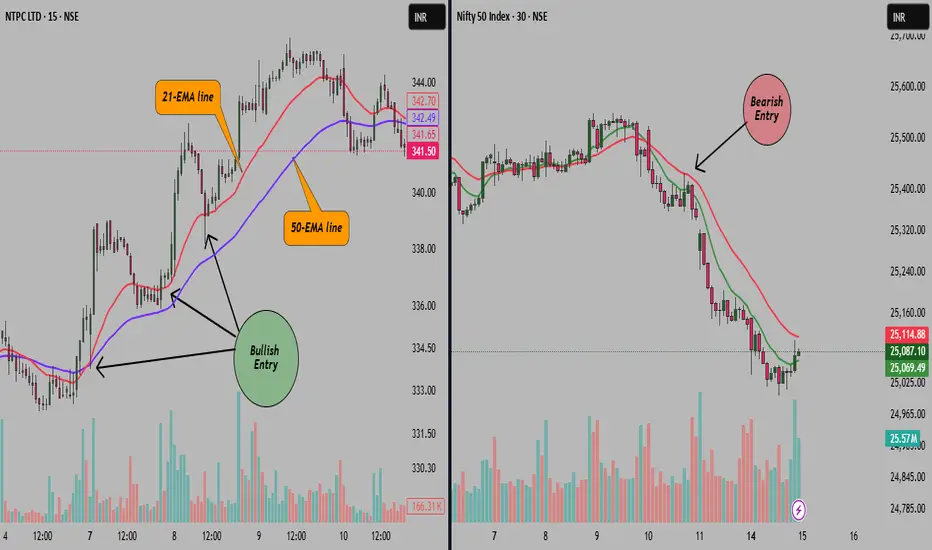
It’s a trend continuation strategy where traders use Exponential Moving Averages (EMAs) — typically the 21 EMA and 50 EMA — to identify the trend and wait for the price to retrace (pull back) into the moving average zone before continuing in the direction of the trend.
How to Trade the EMA Pullback Setup
Identify the Trend: Use a 21 EMA and 50 EMA on your chart. A bullish trend is confirmed when 21 EMA is above 50 EMA and price stays above both. Opposite for bearish.
Wait for a Pullback: Let the price retrace toward the EMAs without breaking below/above them significantly.
Look for Confirmation Candle: Wait for a bullish (or bearish) confirmation candle near EMAs — like a Pin Bar, Engulfing, or Doji rejection.
Entry & Stop Loss: Enter after confirmation. Place a stop-loss just below the pullback low (for long) or high (for short).
Target: Aim for previous swing high/low or use 1:2 risk-reward ratio.
Why It Works
Trend Is Your Friend: You’re trading with the trend, not against it.
Clear Visual Clarity: EMAs help you spot dynamic support/resistance zones.
Disciplined Entry: You wait for price to come to you, not chase it.
Rahul’s Tip
“The best trades often come to those who wait.” Don’t jump on every candle — let the price respect your EMAs, then strike.
Conclusion
The EMA Pullback Entry is a simple yet powerful setup that can give you high-probability trades in trending markets. Whether you trade intraday or swing, this strategy can help you time entries better and stay disciplined.
Have you tried this setup? Share your experience or ask questions in the comments – let’s grow together!
RTNPOWER – A Classic Price Action Study Around Major Trendlines🟦 Dotted Blue Line
Represents the main counter trendline, stretched over a significant duration. Price has currently pushed above it, but the weekly candle is still open.
⬜ White Line (Hidden CT)
A hidden resistance line, drawn from key lower highs. Price is currently reacting near this line — acting as a logical area where sellers might test control ( for my setups )
🟨 Yellow Zones
These levels highlight higher lows, a sign of evolving structure. These bases often add context to the strength behind a breakout move.
🔴 Red Line (MTF Resistance)
Plotted from historical monthly rejection zones — a crucial area for confluence and reaction.
🛠️ Only sharing my Charting — no recommendations, no forecasting .

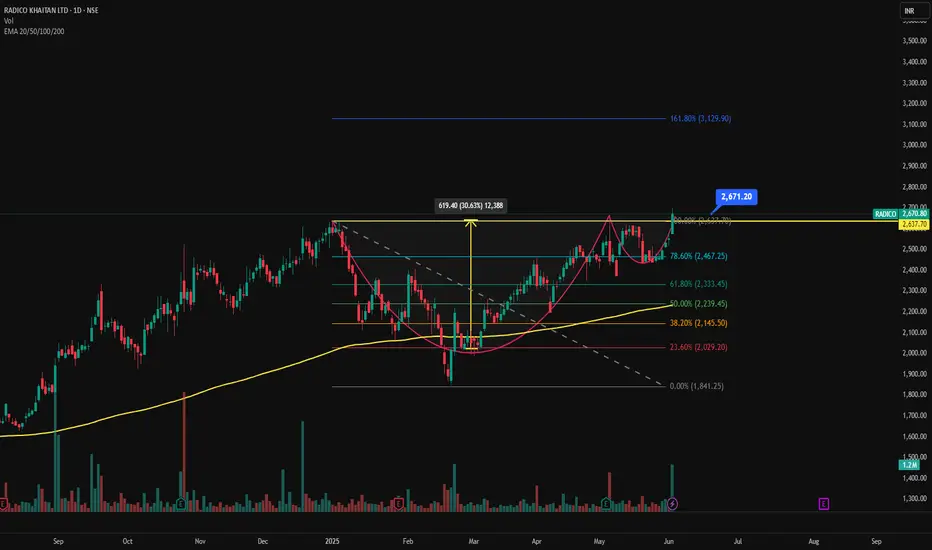
RADICO - Cup & Handle Breakout | Daily Chart📊 RADICO KHAITAN LTD (RADICO) – Cup & Handle Breakout | Daily Chart
📅 Chart Date: June 4, 2025
📈 CMP: ₹2,670.80 (+4.78%)
📍 Ticker: NSE:RADICO
🔍 Technical Breakdown
☕ Cup & Handle Breakout Confirmed
A classic Cup & Handle formation has played out with a bullish breakout above the neckline near ₹2,640–₹2,670. The pattern is well-structured, showing clear accumulation followed by a rounded bottom and brief consolidation.
📏 Measured Target:
The height of the cup (~₹620) projects an initial target near ₹3,129, aligning closely with the 161.80% Fibonacci Extension level.
⚙️ Indicators Used
🔹 Chart Pattern: Cup & Handle
📐 Fibonacci Retracement & Extension
📊 Volume Spike: Strong breakout volume
📈 EMA Cluster: 20/50/100/200-day — bullish alignment
🟢 EMA Support: Price sustaining well above EMAs; 200 EMA ~₹2,000
📍 Key Price Levels
✅ Breakout Zone: ₹2,640–₹2,670
🚀 Upside Targets:
📈 127.20% – ₹2,853
📈 161.80% – ₹3,129
📈 200% – ₹3,352 (extended swing target)
🛡️ Support Levels:
₹2,467 – 78.6% Fibo
₹2,333 – 61.8%
₹2,145 – 38.2%
₹2,029 – 23.6%
🔻 Invalidation/Stop: Closing below ₹2,467 (strong Fibo + EMA support zone)
💼 Trading Strategy
Entry: On breakout retest or strong close above ₹2,670
Stop Loss: ₹2,467
Target Range: ₹2,853 – ₹3,129 – ₹3,350+
Timeframe: Short to medium term swing
⚠️ Disclaimer
This analysis is for educational purposes only. Please do your own research or consult a financial advisor before making trading/investment decisions.
Fear of Missing Out vs Fear of Being Wrong–Which Is Destroying UHello Traders!
Today, let’s talk about something that silently eats into our trading performance — the battle between FOMO (Fear of Missing Out) and FOBR (Fear of Being Wrong) . These emotions don’t just affect your entries and exits — they define your success or failure over the long run. Let’s break it down and help you gain control.
FOMO: The Urge to Chase
Jumping in Late: You see a breakout and rush in without a plan, just because everyone else is in.
Overtrading: You take trades without confirmations, afraid of “missing the move.”
Emotional Entries: No logic, no strategy — just fear of being left behind.
FOBR: The Paralysis of Perfectionism
Can’t Pull the Trigger: You wait for 100% confirmation and miss high-quality trades.
Doubt After Entry: You second-guess your setup, cut winners too early, or shift your stop-loss too tight.
Fear of Losing Face: You’re more focused on being “right” than being profitable.
Rahul’s Tip
Both fears are destructive in their own ways. One makes you reckless, the other makes you inactive. Focus on process over perfection. Let your strategy handle decisions — not your emotions.
Conclusion
Whether you’re haunted by FOMO or FOBR , the cure lies in trusting your system, accepting losses as part of the game, and sticking to your edge. Discipline > Emotion — every single time.
Which one do you struggle with more — FOMO or the fear of being wrong? Let’s talk in the comments!

Fake News Rally Setup – The Smart Money Trap Explained!Hello Traders!
Today, we’re diving into one of the most dangerous traps in the market — the Fake News Rally Setup . Ever seen a stock or index suddenly spike after a “positive” news headline, only to crash minutes or hours later? That’s not by accident — it's often a coordinated move by smart money and institutions to lure retail traders into buying high before dumping their own positions. Let's break it down.
What is a Fake News Rally?
It’s a short-lived price surge triggered by news headlines, press releases, or media buzz — but without real institutional buying to support it. These setups are used to create emotional buying frenzies among retail traders, followed by a fast reversal as institutions offload their positions at inflated prices.
Key Signs of a Fake News Rally
Sharp Spike on News Without Volume: Price rises quickly, but volume doesn’t support the move — a big red flag.
Overextended Move into Resistance: The rally happens near a supply zone or resistance area where smart money waits to sell.
No Follow-Through in Next Candle: After the news candle, if price stalls or reverses quickly — it’s likely a trap.
Absence of Broad Market Support: The rest of the market isn’t moving — only the stock or sector affected by the news.
Sudden Volume Spike on Down Candle: Institutions often dump in bulk after trapping retail traders, causing a sharp reversal.
How to Trade Smart Around Fake News Rallies
Wait for Confirmation: Don’t chase the first candle. Let price action confirm whether it’s real momentum or a trap.
Use VWAP or Trendlines: If price stays above VWAP and breaks trendlines with volume, it may be real. Otherwise, stay alert.
Look for Bearish Engulfing or Reversal Candles: These are strong signs that the move was fake and reversal is coming.
Go Short After Confirmation: Once you spot signs of weakness and a breakdown below support — it’s time to ride the dump.
Rahul’s Tip
Don’t react to headlines — respond to price action. News creates noise. Learn to spot the footprints of smart money, not just what the media wants you to see.
Conclusion
Fake news rallies are designed to trigger your emotions — especially FOMO. Stay grounded in data and structure. Let the charts confirm the story , not the headline.
Have you ever been trapped in a fake rally before? Share your experience and let’s learn together!

VWAP+Trendline+Option OI – Deadly Intraday Setup You Must Learn!Hello Traders!
Want a setup that combines price action + smart money data + intraday structure ? This is one of my go-to setups for intraday trading that aligns logic with real market strength. If you’re struggling with random entries or early stop-loss hits, this VWAP + Trendline + OI Setup could change the game for you.
Why This Combo Works?
VWAP: Shows intraday average price where volume is traded — a key level institutions watch.
Trendline: Identifies dynamic support/resistance and the structure of the market move.
Option Chain OI: Reveals where the big players are writing or exiting positions in real-time.
How to Use This Setup Effectively
Mark Trendline on 5–15 min Chart:
Plot rising/falling trendline based on swing highs/lows.
VWAP Re-Test or Bounce:
Look for price to respect VWAP and trendline together. Avoid entries far from VWAP.
Check Option Chain for OI Confirmation:
At breakout/bounce level, check if PE (for upmove) or CE (for downmove) is getting unwound, and opposite side is building.
Entry & Exit:
Enter on candle confirmation (engulfing, breakout candle).
SL = below trendline or VWAP.
Target = next resistance/support or 1:2 RR.
When It Works Best
Between 9:30 AM – 11:30 AM and Post 1:30 PM:
Volatility is clear, and smart money flows are easier to read.
Low News Days:
Best when no big data releases are expected.
During Expiry Days (with caution):
OI shift gives clearer confirmation on trending or trapping moves.
Rahul’s Tip
Let VWAP guide you, trendline frame you, and OI validate you. When all 3 align, it’s no longer a guess — it’s precision.
Conclusion
This deadly combo of VWAP, Trendline, and Option OI shift gives you structure, strength, and confirmation — everything a smart intraday trader needs. Backtest this setup, follow your rules, and stop trading blindly.
Have you tried combining VWAP and OI in your trading? Share your tweaks in the comments below!

How I Find the Best Intraday Index Option Trades in Nifty?Hello Traders!
Intraday index option trading, especially in Nifty, BankNifty, and FinNifty , offers huge opportunities — but only if you know where to look. Many traders get stuck in random trades with no direction or clarity. So today, I’m sharing my personal step-by-step process to filter high-probability intraday trades using logic, price action, and data — not guesswork.
Step-by-Step Process to Find the Best Trades
Step 1: Pre-Market Range Marking
Mark the previous day’s high, low, close, and CPR levels . These zones are crucial for early directional bias.
Step 2: First 15-Min Candle Clue
Watch how the first 15-min candle forms. Break above/below with strong volume? Possible breakout trade setup. Inside range? Wait for confirmation.
Step 3: Track OI Changes in Live Market
Monitor real-time Open Interest build-up and shift on strikes near current price. If PE buildup rises and price sustains, it’s bullish. CE buildup with resistance? Bearish.
Step 4: Volume + Price Confirmation
Enter only when volume supports the breakout or reversal — especially around key levels like VWAP, PDH, PDL, or CPR .
Step 5: Entry, SL & Target
Entry: After confirmation candle (e.g., bullish engulfing above resistance)
SL: Below the candle or technical level (not random)
Target: Based on next resistance/support or 1:2 RR minimum
Bonus Tips for Index Option Trading
Avoid Mid-Day Chop: The best trades usually come between 9:30–11:30 AM or post 1:30 PM.
Avoid Buying Options in Low VIX: Use ATM options when VIX is low. Go slightly OTM only if momentum is strong.
Always Respect Trend Days: Don’t fight the trend. Use 5min + 15min structure to confirm bias.
Rahul’s Tip
Don’t chase price. Let it come to your level, show volume + structure, and then strike with confidence. Smart intraday trading is about planning, not reacting.
Conclusion
The key to finding great intraday index trades is structure + confirmation . Avoid impulsive trades, rely on price action, OI data, and volume analysis , and execute with proper risk management. That’s how consistent profits are built — not on luck, but logic.
Do you have a personal rule for selecting intraday index trades? Let’s share and grow together in the comments!

How Algo Bots Target Retail SL – Learn to Beat Them!Hello Traders!
Have you ever seen your stop-loss get hit by just a few points and then the market moves in the direction you expected? That’s not a coincidence — it’s often the work of Algo Bots and big players trying to trap retail traders . These bots are designed to trick traders by moving prices to hit SLs before starting the real move.
Let’s understand how these bots work — and how you can avoid getting trapped.
How Algos Hunt Retail Stop-Losses
They Target Common SL Zones:
Algo bots look for areas where many traders place their stop-loss — like just below support or above resistance.
They Trick with Fake Breakouts:
You may see a fast move above or below a level — but it’s just to hit SLs and then reverse. This is called a stop hunt .
They React Fast:
Bots can place thousands of trades in a second. They use their speed to catch traders off guard.
How to Beat the Bots – Pro Tips
Avoid Obvious SL Levels:
Don’t keep SL right at support or resistance. Place it a little beyond where bots won’t expect it.
Use Structure-Based SLs:
Look at price structure and place SLs based on key swing highs/lows — not just round numbers.
Wait for Confirmation:
Don’t enter as soon as a level breaks. Wait for retest or a strong candle signal.
Mark Smart Zones:
Learn to spot liquidity areas and imbalance zones — that’s where big players usually trade after bots do their job.
Rahul’s Tip
The market isn’t cheating you — it’s just smarter. Learn how it works and you’ll trade with more confidence and better results.
Conclusion
Algo bots are fast and smart — but not unbeatable. If you place SLs wisely, trade with structure, and wait for confirmation, you’ll stop being trapped and start trading like the smart money.
Has your SL ever been hunted like this? Let’s talk in the comments and help each other grow!

XNGUSD - Natural Gas SHORTNatural Gas - Reverse from resistance line
Next target will be 3.170
Keep stoploss at 3.3.50
Good Luck, Traders!

Buy opportunityThis chart sees trend reversal recently along with inclined triangle pattern. Today it tries to break the pattern with volume but couldn't. Those who want to swing trade can enter at current level or wait for some more price drop as triangle pattern is not yet broken.
Once resistance break, price may move up and give 12% gain in short term.
Please vote for this idea if you like it.
NOTE: This is just for educational purpose only. Please do trade on your own risk.

Indusind BankAfter Down Move stock went in consolidation so one can trade this stock on support and resistance basis

SIS Ltd 5YR TREND BREAKOUTSis Ltd, has shown a breakout in its 5-year trend. Currently, it is trading between 465 to 490. If you decide to buy, it is recommended to set a stop loss below 450. Additionally, the company has considered and approved a proposal for buying back its shares. The buyback will be done at a price of 550 rupees per share and the approved amount for the buyback is up to 900 million rupees.

Triangle pattern breakout in PIDILITINDPIDILITE INDUSTRIES LTD
Key highlights: 💡⚡
✅On 1Hour Time Frame Stock Showing Breakout of triangle Pattern .
✅ Strong Bullish Candlestick Form on this timeframe.
✅It can give movement up to the Breakout target of 2725+.
✅Can Go short in this stock by placing a stop loss below 2610-.

Rising wedge pattern reversal in RAMCO CEMENTRAMCO CEMENT
Key highlights: 💡⚡
✅On 1Hour Time Frame Stock Showing Reversal of Rising Wedge Pattern .
✅ It can give movement upto the Reversal final target of above 967+.
✅There have chances of Breakout of resistance level too.
✅ After Breakout of resistance level this stock can gives strong upside rally upto above 1010+.
