Buy opportunityThis chart sees trend reversal recently along with inclined triangle pattern. Today it tries to break the pattern with volume but couldn't. Those who want to swing trade can enter at current level or wait for some more price drop as triangle pattern is not yet broken.
Once resistance break, price may move up and give 12% gain in short term.
Please vote for this idea if you like it.
NOTE: This is just for educational purpose only. Please do trade on your own risk.
Priceactionstrategy

Indusind BankAfter Down Move stock went in consolidation so one can trade this stock on support and resistance basis

SIS Ltd 5YR TREND BREAKOUTSis Ltd, has shown a breakout in its 5-year trend. Currently, it is trading between 465 to 490. If you decide to buy, it is recommended to set a stop loss below 450. Additionally, the company has considered and approved a proposal for buying back its shares. The buyback will be done at a price of 550 rupees per share and the approved amount for the buyback is up to 900 million rupees.

Triangle pattern breakout in PIDILITINDPIDILITE INDUSTRIES LTD
Key highlights: 💡⚡
✅On 1Hour Time Frame Stock Showing Breakout of triangle Pattern .
✅ Strong Bullish Candlestick Form on this timeframe.
✅It can give movement up to the Breakout target of 2725+.
✅Can Go short in this stock by placing a stop loss below 2610-.

Rising wedge pattern reversal in RAMCO CEMENTRAMCO CEMENT
Key highlights: 💡⚡
✅On 1Hour Time Frame Stock Showing Reversal of Rising Wedge Pattern .
✅ It can give movement upto the Reversal final target of above 967+.
✅There have chances of Breakout of resistance level too.
✅ After Breakout of resistance level this stock can gives strong upside rally upto above 1010+.

Triangle pattern breakout in GODREJ PROPERTIESGODREJ PROPERTIES
Key highlights: 💡⚡
✅On 1Hour Time Frame Stock Showing Breakout of triangle Pattern .
✅ Strong Bullish Candlestick Form on this timeframe.
✅It can give movement up to the Breakout target of 1635+.
✅Can Go short in this stock by placing a stop loss below 1525-.

Falling wedge pattern reversal in MAHANAGAR GAS LTDMAHANAGAR GAS LTD
Key highlights: 💡⚡
📈On 1Day Time Frame Stock Showing Reversal of Falling wedge Pattern .
📈 It can give movement upto the Reversal Final target of above 1065+.
📈There have chances of breakout of Resistance level too.
📈 After breakout of Resistance level this stock can gives strong upside rally upto above 1145+.

EMA and price action support at hourly chart of RAILTELThe HOURLY chart picture is pretty self explanatory.
As you can see RAILTEL took first resistance near 133,
then it broke the Resistance, after that the resistance became support.
First it took support near 13 then made a Higher HIGH, then again it is came to the support of 133.
The sloping up 200 EMA is at 130 (Will probably provide additional support).
RSI indicator is also near oversold zone.
It might be a high probability trade. Please Do your own research before taking any Trades.
Entry should be 133
SL should be 129.25
Target should be 145.

IRB INFRASTRUCTURE - LongINFRA sector is on breakout verge. Stock has given good breakout with huge vol on 1D time frame

Tata steel stock is good for swing tradeTATA STEEL stock is good for swing trade.
TATA STEEL stock resistance is broken
buy 113.90 and sp is 108 and 1st target is119 2nd target is 125

LIC Housing Finance Buy SignalThis stock has formed Falling Wedge pattern with good intensity of volume . One can go Long when 346.80 level is broken and start accumulating quantities in systematic way. After it breaks the channel and retest the channel, invest your entire capital per stock that you have allotted as per your total capital.

The Ultimate Price Action Breakdown Strategy Preface
Alright, the operation started after creating an extreme low at 120.20. Price has created an upward channel from the extreme low, where the equilibrium has occurred between bull and bear traders. Control line has given eleven touches, which shows the strong gravitation at the middle.
Here, we can see four reversals on the upper band, and three reversal points occurred on the lower band.
We have two opportunities:
1. Now, the price is on the H-line, and the breakout of the h line indicates the lower band touch.
2. Bull can buy at excess, or they can enter at reappearing in the value area for the target of the control line.
Every beginner who wants to start trading with naked strategy (without indicator) can use this method because the price is the thing that will pay you.
Let me explain to you important aspects of the breakdown strategy.
Value area:
A zone in which bulls and bears both are satisfied to stay within it.
In this zone, supply and demand equally exist.
Ascending Value area:
Range-Bound Value area:
Descending Value Area:
Value area has two bands:
Upper band:
Upper band indicates demand-supply.
In this chart, the price has taken four reversals from the upper band to maintain the equilibrium.
The upper band put a stop to the bull power.
Lower Band:
The lower band indicates demand pressure.
In this chart, the price has taken three reversals from the lower-band to maintain the equilibrium.
The lower band put a stop to bear power.
------------------------------------------
No trading zone:
In order to respond to either bull or bears initiative, the price creates an area. In which no trading activities have taken.
It helps to find the weakness of any particular move.
------------------------------------------
H Line:
After completing the last share move, the price creates the bulk trading activities, where bulls' power becomes dull.
Breakout of the H-line indicates the cease of the particular move.
------------------------------------------
Excess:
Excess is regret and fake-out.
In simple words , price breaks the upper band and again re-enter into the parallel channel.
Buying or selling at the excess is the perfect deal. An excess is a signal of reversal.
The psychology behind the control line :
Price is forming in the parallel channel, but bulls are not satisfied with the current trend. That's why bulls increase demand pressure to break the upper band of the value area. After breaking the upper band, bulls face some problems with profit booking. Now, bulls realize that the price is not going up. Bulls give up on the thought of trend change. Bears were watching this patiently. And after they realize that prices are too high, they increase supply pressure above the upper band of the channel. Now bulls are out of the market, and the seller has maintained the equilibrium & Vice versa.
------------------------------------------
Control line:
The Control line is the gravitation point of any value area. We can draw by connecting the reversal points in the middle.
The more the points are available, the higher the effectiveness.
Please note that the price can not stay away from the control line of the value area. We can use it as a price target or breakout trade.
Here, the price has given eleven touches on the control line.
------------------------------------------
Breakout or breakdown of the channel:
Bulls and bears both disagree with the current price trend.
Either bulls or breaks out the value area by giving consistent closing.
It often happens after a complex correction or trend change.
I will upload practical work on this idea. Kindly wait for the implementation.
Thank you for your support.
To be continued.....

WIPRO is ready to Run Entry / Targets / Stop Loss is mentioned as per the Risk-Reward Ratio Tab
Right now it is on Demand zone and can go to the Supply Zone in a few weeks
The global situations are not so good, so please be cautious while trading. Mention your Risk Reward Ration in your proper Discipline.
Enjoy!

V Guard Industry will take Guard of your ProfitsThe Entry, Target, and SL are mentioned as per the Risk-Reward ratio tab / The price hV Guard Industry will take Guard of your Profitsas just gone through the Demand Zone and will go up to the supply zone
The Chart shown is the Weekly Chart (Higher Time Frame Chart)
So, make your entry as per your own followed rules in (Lower Time Frame Charts)
The Global Situations are also not so good and nifty is going down, but this stock has some potential to go up to the Supply Zone, so be cautious with the Risk-Reward Term
Enjoy your Profits

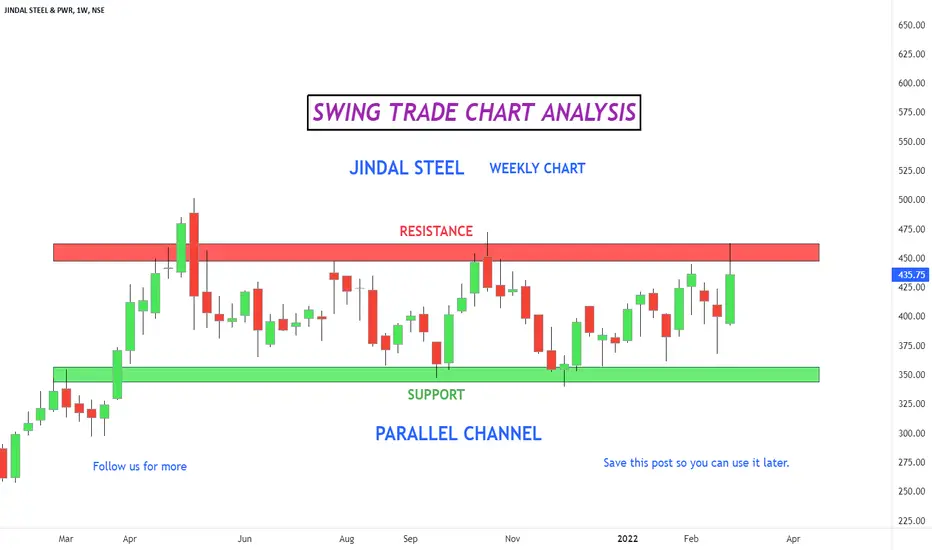
Jindal Steel : Parallel channel (Time frame - 1 Week )Chart of - Jindal Steel
Stock is trading in a range by forming a parallel channel .
You can enter in this stock after proper breakout.
Leave us a comment or like to keep our content for free and alive.
Have a great day everyone!
Disclaimer: All charts are purely for educational and information purpose only. I am not a SEBI registered Investment advisor. Please Trade and invest based on your knowledge and risk profile.
LIC BuyLIC Housing Finance Buy Signal
This stock has formed Falling Wedge pattern with good intensity of volume . One can go Long when 346.80 level is broken and start accumulating quantities in systematic way. After it breaks the channel and retest the channel, invest your entire capital per stock that you have allotted as per your total capital.

How to better time your entry and exit in Swing Trading?This charts shows the possible areas where one can look for trading opportunities (through Price Action Strategy) and be profitable from it. Swing Trading is better for beginners in Stock Market and Price Action is one of the ways to approach Stock Market. Through Price Action, one can identify the current market structure (uptrend/downtrend/sideways) and so better trading decisions can be made, which will pave way to better time entry and exit. Drawing trendlines, patterns, support and resistance and reading candlestick patterns are some of the ways in Price Action Trading. A good price volatility of a stock is essential especially from the traders perspective, as traders tend to make profit from the market using its volatility. Another important thing in taking up a trade is choosing the right Time Frame because in terms of volatility many of the stocks would fit into 1 Day time frame, some stocks would fit into 1 hour time frame, 4 hour time frame or 30 mins time frame etc. With all this in consideration, one can be expected to make entry in breakouts and shorting in breakdown. One should manually go through as much charts as possible and add to their watchlist that fits into their strategy. This roadmap is one of many ways to approach trading in Stock Market. This is just for Educational purpose. Thank You

NIFTY BullishWhy this Trade..??
1. Price formed Doji @ Support
2. Fibonacci 38.2% Retracement
Buy or Sell based on the Support Break with Volume
Disclaimer:This view is purely for educational purpose and it's my personal.Please consult your financial advisor before attempting any trade.We're not responsible for any loss or profits.

SWING & IntradayWhy this Trade..??
1. DOUBLE BOTTOM
2. Broadening Triangle
3. Fibonacci 50% Retracement
Buy or Sell based on the Support Break with Volume
Disclaimer:This view is purely for educational purpose and it's my personal.Please consult your financial advisor before attempting any trade.We're not responsible for any loss or profits.

INFO EDE - NAUKRIINFO EDGE
1- INFO EDGE is a range from last few days, most of the time whenever the stock comes out of range, They move like crazy
example - You may check PolyCab ( 13th Jan Chart)
2- Once Point B is broken then the Harmonic Pattern will get activated
3- It is making a perfect Flag and pole Patterns which itself again one of the bullish Patterns
- All these are my personal thoughts and understandings
in case you wish to trade on the same, Do your own analysis, Chart is made only for Educational Purpose
Thank you very much for giving your time to the Chart

NIFTY Rejection at 0.382 Fibonacci LevelWhy this Trade..??
1.Rejection at 0.382 Fibonacci Level
2.Profits Booking may happen
Buy or Sell based on the Support Break with Volume
Disclaimer:This view is purely for educational purpose and it's my personal.Please consult your financial advisor before attempting any trade.We're not responsible for any loss or profits.

GodrejCP breakoutGodrej CP breakout of TL in D time frame. Swing traders can plan with proper risk management.

Ginni filaments on breakoutGinni filaments on verge of breakout .
it forms a cup & handle pattern and following a price action of U pattern from the chart when compare with the previous chart history
