HDFC, Swing/PositionalHDFC has given a breakout from falling wedge and has been taking support from 50 EMA . Even after the falling wedge breakout, 2605 seems to be a rejection region where one or two gap up openings could not sustain. A closing above 2605 with good volume can be traded for a swing or positional trade for first target of 2768 and second target of 2888. Some good indicators of HDFC possibly achieving target is support of 50 EMA , RSI above 50 suggesting a buy signal and if you look closely you can see a rounding bottom pattern forming which i haven't highlighted in my idea, but it can be seen.
If you enter after a breakout from the 2605 region. Stop loss can be set just below 50 EMA for swing.
Make sure to trade what happens and not what you expect :)
Note: Please do not follow my idea blindly, please analyze yourself as well. I just share my idea so that people can build upon the same. The idea I share is open to healthy criticism and feedback :)
Pullback

Pullback after a VCP Pattern Hindustan Copper had given a breakout after forming a VCP.. Now, it's pulled back and is reversing. It has broken the upper trend line on the 75 min. chart. Offers a good, low risk entry option at this level.

Successful Pullback Apcotex had posted fantastic results and the stock made a significant move. Now it has cooled down a bit and the price is appearing to be making a successful, simple pullback at around 23.6% Fib retracement.


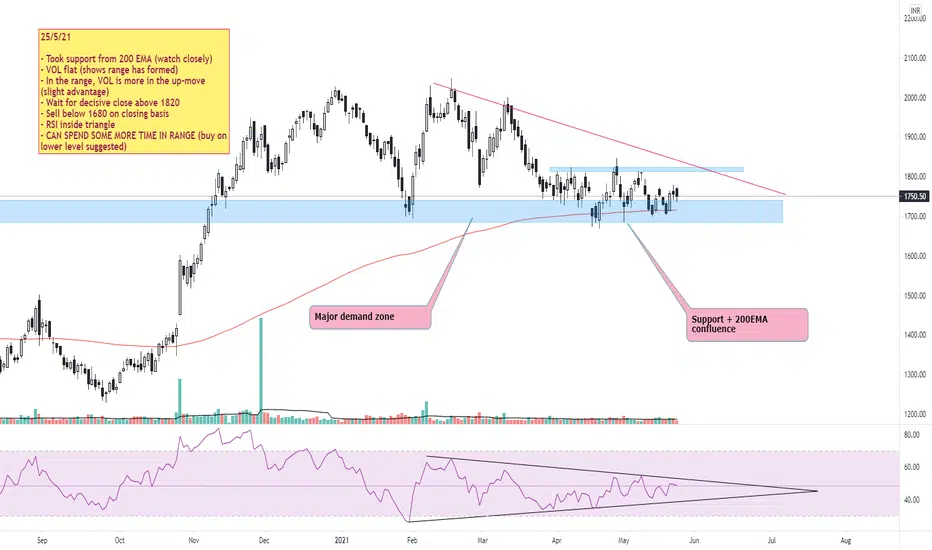
KOTAKBANK | Support + 200EMA confluence | Trading in range25/5/21 (BUY ON DIP)
- Took support from 200 EMA (watch closely)
- VOL flat (shows range has formed)
- In the range, VOL is more in the up-move (slight advantage)
- Wait for decisive close above 1820
- Sell below 1680 on closing basis
- RSI inside triangle
- CAN SPEND SOME MORE TIME IN RANGE (buy on lower level suggested)
*Will again post chart when break accours

CEATLTD | Trendline + RSI divergence + 200 EMA + Pivot SupportCEATLTD | Trendline Support + RSI divergence + 200 EMA + Pivot Support
CMP : 1298
SL : 1170
Target : 1650
1:4+ risk reward setup

Canara bank trendline breakdownThis is an hourly time frame of CANARA BANK showing the clear breakdown of the trendline and today it also retested and started the continuation towards the downside. So it can be a good fall for upcoming days in Canara Bank. Please like the post if you agree with my idea.

LICHFBullish above 426 today close
Target : 437, 472, 526
SL: 375
Risk is yours and Reward is too yours totally

Pullback after breakout with low volume* This stock Pullback after breakout with low volume and also promoter buying 62 lakhs share average price of 118 to 120.00


COFORGE expanding channel We can expect a pullback and the demand zone can become a supply zone and stock can move upwards or else we can expect the range of 2800-2900

TRENT - Technical AnalysisUsing the concept of Support and Resistance one can understand the chart. Additionally, RSI going above 60 with some good volumes suggest the buyers interest in the stock, once can enter with a positional target of 800 - 900.


JK Paper : 5th WaveTarget levels: 160-163 and 180, Entry price : 150 - 152. Duration : 15-20 Days, Stoploss :144

ACC uptrend consolidation breakoutACC : daily chart upward channel consolidation breakout with retest done ready for big move keep it on radar


Hindustan Unilever BreakOut or PullbackHindustan Unilever #HUL
Expecting some pullback(ideal entry around 2216 in this case)
If 2456 resistance breaks then wait for a retest of support

Pullback Stock AB Capital !! 22 March 2021 !!* After breakout with high volume now the stock is pullback to its support zone with low volume .Thats the sign of accumulation .Now the stock is ready for Upmove .
Note - Promoter buying 62 lakhs share at avg. price of 120.00 .

Ashokley - Fibo + Demand zone + Multi-time frame In 1 day stock is nearby its lower trendline, Currently closed 20Daily and 50Daily EMA as shown on 1st chart. Also standing on Demand zone.
In 2Hrs timeframe it has completed 38.20% retracement and also nearby 100 ema.
The Indicator Used:
PANEL 1:
1) Daily Lines Plots Daily 20 (BLACK) & 50 EMA (GREY), BLUE (200 DAILY EMA ) On Lower Time Frame Charts.
2) Valuation band
KEYS: Red Faded Cloud: Over Valuation.
Grey Faded Cloud: Proper Valuation.
Green Faded Cloud: Under Valuation.
PANEL 2:
1) TE-REKAB - Proprietary Indicator
KEYS:
PB: Pullback
Blue Candle: Selling Divergence
Yellow Candle: Buying Divergence
If you like the analysis, do leave a like and follow for more such content coming up.
The analysis is my POV, hope you got bucks in your pocket to consult a financial advisor before investing :P :)
HAPPY TRADING!!!


Sail Fibo+Triangle+EMAs. Breakout??Formed a triangle + Nearby Fibo level + Also got supported by EMAs
The Indicator Used:
PANEL 1:
1) TE-REKAB - Proprietary Indicator
KEYS:
PB: Pullback
Blue Candle: Selling Divergence
Yellow Candle: Buying Divergence
If you like the analysis, do leave a like and follow for more such content coming up.
The analysis is my POV, hope you got bucks in your pocket to consult a financial advisor before investing :P :)
HAPPY TRADING!!!

Bajaj Auto Fibo+ Falling wedge+ Demand zone+ Multi time frameIn 15 mins stock is nearby its lower trendline, Currently closed to proper valuation as shown by the valuation band in 1st chart. Also standing on Demand zone .
In 2Hrs timeframe it has completed 61.80% retracement and also nearby 100 ema .
The Indicator Used:
PANEL 1:
1) Daily Lines Plots Daily 20 (BLACK) & 50 EMA (GREY), BLUE (200 DAILY EMA ) On Lower Time Frame Charts.
2) Valuation band
KEYS: Red Faded Cloud: Over Valuation.
Grey Faded Cloud: Proper Valuation.
Green Faded Cloud: Under Valuation.
PANEL 2:
1) TE-REKAB - Proprietary Indicator
KEYS:
PB: Pullback
Blue Candle: Selling Divergence
Yellow Candle: Buying Divergence
If you like the analysis, do leave a like and follow for more such content coming up.
The analysis is my POV, hope you got bucks in your pocket to consult a financial advisor before investing :P :)
HAPPY TRADING!!!
