RADICO KHAITAN LIMITES : RADICORADICO KHAITAN (NSE: RADICO) | Breakout Setup | Swing Trade Idea
Radico Khaitan has been displaying impressive relative strength after reclaiming its previous resistance zone. The stock has formed a strong base above ₹3,423 and is now approaching a fresh breakout above its recent swing high.
A powerful lifting candle accompanied by sustained buying interest suggests that institutional participation may be increasing. A decisive close above ₹3,840 could trigger the next leg of the uptrend.
📌
Radicokhaitan
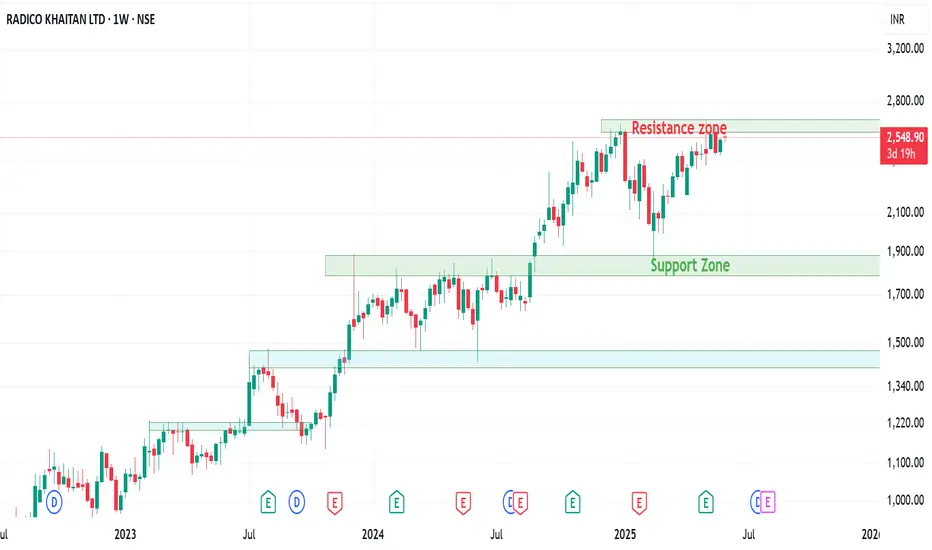
Radico Khaitan at a Crossroads: Support, Resistance & MomentumThe stock is in a bullish trend and is forming a box consolidation and break outs.
On the weekly charts the stock is trading around the resistance zone and there are chance of either breaking out or retesting to the lower levels.
Stock seems strong bullish on the charts but indicators are suggesting a bearish move as the stock is around the resistance zone.
Short sell can be initiated in the stock with a strict SL.
On the bullish side the stock is respecting the monthly 20 EMA and has retes
Radico Khaitan, Long Base BreakoutRadico Khaitan, a major alcohol manufacturer in a very long base(~200 days)
Long base = Big Breakout (check recent example Gravita India)
-Kind of Inverted Head n Shoulder too
-Good shakeout of 200 dema too
-Recovered fast from 4th june fall with good vol and price action.
Bullish Breakout Potential for Radico Khaitan Above 2040Radico Khaitan has been showing signs of a strong bullish trend, and the recent price action suggests a potential breakout above the 2040 level. If the stock sustains above this channel resistance, we could witness a significant upmove.
Technical Indicators: The stock is currently trading at ₹1,732.10, with a recent high of ₹1,744.401. The 52-week high stands at ₹1,885.10, indicating room for growth.
Volume Analysis: A surge in trading volume could accompany the breakout, confirming the strengt
RADICO - Bullish Momentum with VolumesNSE: RADICO is closing with a bullish momentum candle supported with volumes.
Today's volumes and candlestick formation indicates strong demand and stock should move to previous swing highs in the coming days.
The stock has been moving with bullish momentum for the past few days which is indicating demand.
One can look for a 8% to 12% gain on deployed capital in this swing trade.
The view is to be discarded in the event of the stock breaking previous swing low.
#NSEindia #Trading #StockMark
RSI DIVERGENCE - RADICO KHAITANNSE:RADICO - DAILY CHART ANALYSIS
The price was heading down, making lower lows.
Initially, the RSI indicator was following the price too.
on daily chart its seen that the RSI starts making higher lows while the price is still heading down.
That’s when divergence pattern appears.
After a bullish divergence, the price will tend to change from a downtrend to an uptrend.
PLEASE NOTE THAT:
This chart analysis is only for reference purpose.
This is not buying or selling re
Radico Khaitan LimitedRADICO:- The stock has given a breakout by forming a cup and handle pattern, keep an eye on the stock
Hello traders,
As always, simple and neat charts so everyone can understand and not make it too complicated.
rest details mentioned in the chart.
will be posting more such ideas like this. Until that, like share and follow :)
check my other ideas to get to know about all the successful trades based on price action.
Thanks,
Ajay.
keep learning and keep earning.
RADICO - Ichimoku Bullish Breakout Stock Name - Radico Khaitan Limited
Ichimoku Cloud Setup :
1). Today's close is above the Conversion Line
2). Future Kumo is Turning Bullish
3). Chikou span is slanting upwards
All these parameters are showing bullishness at Current Market Price
and more bullishness AFTER crossing 1032.
#This is not Buy and Sell recommendation to any one. This is for education purpose and a helping hand to learn trading in Market.
# Cloud Trading
# Ichimoku Cloud
# Ichimoku Followers
I hope you all like m
Target 3 (144%) achieved in Radico Khaitan. Target 4 is ON...This is follow-up on Radico Khaitan. Can check link to related ideas.
Target 3 achieved. More than 144%. Target 4 is ON.
Chart is self explanatory. Entry, Targets and Trailing Stop Loss are mentioned on the chart.
Disclaimer: This is for demonstration and educational purpose only. This is not buying or selling recommendations. I am not SEBI registered. Please consult your financial advisor before taking any trade.