box breakout creates a channel with its bands based on the highest and lowest values for the last X bars (X is the value of the 'Length' setting). The strategy enters long if the high of the current bar is higher than the upper channel band of the previous bar.
Rectangle

Kopran Cmp 273 Rectangle BO, VolumeKopran Cmp 273 dated 20-11-2023
1. Rectangle Consolidation BO @ 255 (done)
2. Price Rise with Volume Rise
3.. RSI on verge of BO
Buy above 275 target 285-310-325-335-350-370-400 SL 225
It is just a view, please trade at your own risk.

Bharti Airtel Big Bucks time. Bharti Airtel about to break
heading towards new All time high
volume spikes are clearly visible in the chart
can be a good deal.

Cadjpy short possible Cadjpy sell now @108.795
Stop loss 109.702
Target 106.868
Trade based on pure price action follow me for more updates from now onwards if i get followers i will post many ideas daily and daily just try this setup and thanks me later✌️✌️✌️✌️

Nykaa Cmp 168 Rectangle BONykaa Cmp 168 dated 17-11-2023
Positional View:
1. Rectangle BO @ 170
2. Price Rise with Volume Rise
3. RSI BO
Buy above 170 target 180-190-200-210-225 SL 140
It is just a view, please trade at your own risk.

Escorts Cmp 3076 Reverse from SupportEscorts Cmp 3076 dated 3-11-2023
1. Rectangle Consolidation, taken support @ lower
end & at support.
2. 10% correction from top.
3. Hammer kind Candle
Buy above 3100 target 3150-3190-3240-3280-3340 SL 3010
It is just a view, please trade at your own risk.

NMDC Cmp 160 dated 13-10-2023NMDC Cmp 160 dated 13-10-2023
Weekly Chart (Investment Idea)
1. Rectangle Consolidation of 12 years BO @ 165
2. Ongoing Rounding Pattern & H&S Pattern
3. Volume Surge
Buy above 165 tgt 175-200-215-225-235-245-270
SL 120
It is just a view, please trade at your own risk.

CAMS - Breakout CandidateNSE:CAMS is a mutual funds transfer agency. It provides investor services, distributor services, and asset management companies (AMC) services.
TTM EPS: 60.49
TTM PE: 44.36
P/B: 18.10
Mkt Cap (Rs. Cr.): 13,180
Dividend Yield: 1.41
Sector PE: 29.31
Book Value Per Share: 148.24
Positives:
Strong Momentum: Price above short, medium and long term moving averages
New 52 week high today
Growth in Net Profit with increasing Profit Margin (QoQ)
Company with No Debt
Increasing Revenue every Quarter for the past 4 Quarters
Increasing profits every quarter for the past 4 quarters
Book Value per share Improving for last 2 years
Company with Zero Promoter Pledge
FII / FPI or Institutions increasing their shareholding
NOT A RECOMMENDATION. JUST FOR EDUCATION PURPOSE. Thanks

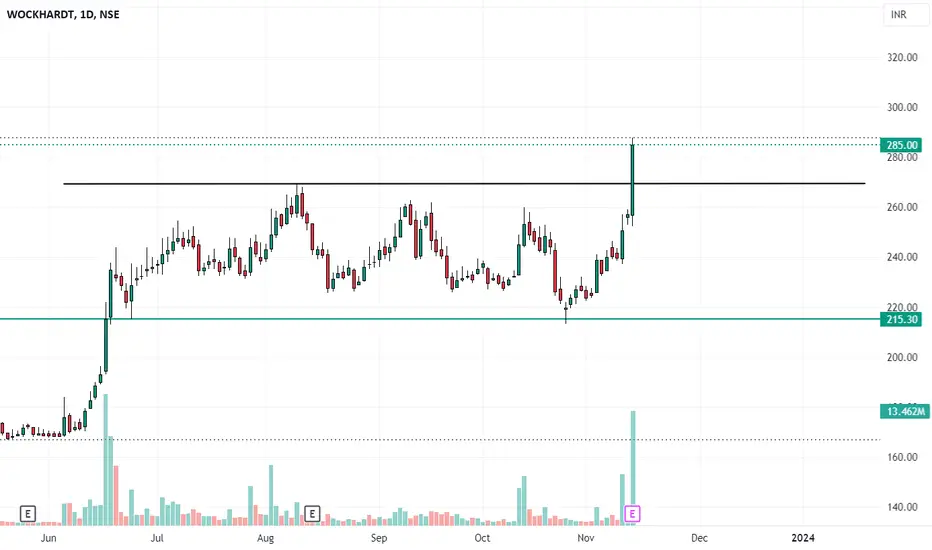
Rectangle pattern Breakout - WOCKPHARMAPlease look into the chart for a detailed understanding.
Consider these for short-term & swing trades with 2% profit.
For BTST trades consider booking
target for 1%-2%
For long-term trades look out for resistance drawn above closing.
Please consider these ideas for educational purpose
Please note that, if there are some big targets, those are drawn thinking for long term.
BANKNIFTY 2 Nov, 2023Range-bound Market with Bullish Market Sentiments?
NSE:BANKNIFTY
On November 1st,2023, Bank Nifty opened with a slight gap-down and remained range-bound throughout the session, obeying the support-resistance levels. The wicks of the candles moved creating some bull-bear traps, and the market ended in a flat note with no surprises on the expiry day.
I have plotted new support and resistance levels, and new positions should be taken only if there is a clear breakout in the 15-minute time frame. The market sentiment looks bullish, but it is important to wait for new surprises before taking any positions.
Technical Analysis is not a fool-proof tool, and market sentiment plays a good role in trading, especially indices. Take positions after observing if the market sentiment and charts align.
PS: Please like and support the idea if this helps. Follow me for daily pre-market analysis.

ChainLink ($LINK) Analysis: Ready for a Breakout?Trading Range: BINANCE:LINKUSDT has been oscillating between $5 and $9.5 for the past 1.5 years.
Today's Surge: LINK is up 17% today, hinting at a possible bullish momentum.
Bitcoin ETF Impact: With potential Bitcoin ETF approval, a break above the $10 resistance for LINK could be on the horizon.
Volume & Potential Play: A breakout should ideally be backed by high volume. After $10, the next resistance level would be at $12 with a potential stop loss at $8 would give a solid 1:1 risk-to-reward ratio. I'm also going to be adding some to my long-term portfolio in preparation for the next bull run. 🤑
Disclaimer: This is for informational purposes only, not financial advice. Always do your research before investing.
Happy trading! 🚀

PRISM Johnson : Breakout Candidate Weekly Chart#prsmjohnsn #flagpattern #breakout
Prism Johnson (Weekly) : Breakout Candidate
>> Short term (1-3 Months)
>> Good Consolidation after a Impulsive Move
>> Flag Structure Visible, Breakout will give Good Upmove
>> Good Weekly Volumes Spurt
>> Good Strength
Swing Traders can lock 10% profit & keep trailing
Please Like or comment if u r Liking the analysis & Learning from it. Keep showing ur Love
Disclaimer : This is not a Trade Recommendations & Charts/ stocks Mentioned are for Learning/Educational Purpose. Do your Own Analysis before Taking positions.

TATA Chemical : Consolidation Breakout with VolumesBreak out of all previous resistance
ATH is at 1182 far from current levels
Can be added on retracement
DISC: Please do your own research before making any research.

ShreePushk : Good Breakout and retestShreepushk Has given a good consolidation breakout with volumes
It has confirmed its intend to go up by making a Bullish Engulfing candle at retest zone.
It may move up to 320 levels to complete its round bottom structure.
DISC: Not a buy or sell advice. Please consult your financial advisor before investing.

Escorts: Rectangle repeating patternEscorts is repeating its long term pattern on DTF.
Consolidation and Breakout. It may move upward and showing good RR ratio.
DISC: Only for educational purposes.

Head and Shoulder Bullish pattern formation in CheviotWeekend Pick 2: Cheviot
Fundamentals : Strong, Consistent growth on Sales, Profits and EPS. Strong Reserves vs almost debt free. Healthy dividends !
Technicals : Bullish HNS pattern formation.
R 1: 1340
R 2: 1490
R 3: 1650+
SL : 1100

Gold Swing Trade IdeaHi All - swing trade opportunity in Gold.
Timeframe - 1H
Key Highlights:
1. Long entry on range breakout
2. Consolidating in range
3. Bouncing off good volume

Bajaj Healthcare looks very BullishWeekend Pick 2: Bajaj Healthcare
Fundamentals : Average, Stable on Sales and Profits. Increasing Reserves but little higher on debt!
Technicals : Bullish Trendline after good consolidation. *Big Volume Blast* .
R 1: 550
R 2: 610
R 3: 680+
In case of fall, avg small btw 430-400 SL : 360

GALAXYSURF Swing Trade IdeaHi All - Swing trade idea to go long for GALAXYSURF.
Key Highlights:
1. Accumulating and consolidating in tight range
2. Good relative strength
3. Bouncing off support line

MFSL Simple Price Action Analysis NSE:MFSL
Company Overview
Max Financial Services Ltd. operates as a holding company. The firm engages in the provision of advisory services. It operates through the following segments: Business Investments and Life Insurance. The Business Investments segment deals with treasury investments. The Life Insurance segment offers private life insurance products and services. The company was founded by Analjit Singh on February 24, 1988, and is headquartered in Noida, India.
Technical analysis
1. Flag Breakout + Horizontal Resistance Breakout
2. Forming 2nd Swing High Which Has a Higher Probability Of Trend continuation.
3. Price is trading above 200 Ema
4. Entry Logic
5. Target forecasting.
hope you found this helpful.
Please comment your views.
Keep Learning,
Happy Trading!

VIP INDS CMP 663 Reversed from supportVIP INDS CMP 663 dated 27-9-2023
1. Rectangle Consolidation
2. RSI reversal
3. Reversed from support
Buy above 668 target 685-705-725-740-760-775-810
SL 635
It is just a view, please trade at your own risk.

ACE Cmp 695 Rectangle & Price actionACE Cmp 695 dated 4-10-2023
1. Rectangle Consolidation.
2. RSi Divergence
Buy above 700 target 710-730-740-750-765-780-800 SL 660
It is just a view, please trade at your own risk.

HUL FORMING RECTANGLE AND IS NEAR SUPPORT ZONEThe stock has formed a rectangle and it has tested the support many times which i think will touch again in few takes and will rebound strong
