Kirloskar Oil Engines - Swing TradeKirloskar Oil Engines Limited - Technical Analysis Report
Current Market Price: 1,005.70
MARKET BIAS: BULLISH RECOVERY IN PROGRESS
Kirloskar Oil Engines is currently trading at 1,005.70, showing signs of bottoming out after a significant correction from its all-time highs of ₹1,450+. The stock is now forming a potential reversal pattern.
KEY TECHNICAL OBSERVATIONS:
1. Major Support Zone - HOLDING STRONG ✅
The stock has found solid support in the 900-950 zone, which coincides with:
- Multiple moving average convergence (EMA 20/50/100/200)
- Previous resistance-turned-support from mid-2025
- Psychological round number support at 900
The price has bounced decisively from this zone, suggesting accumulation by institutional investors.
2. Consolidation Rectangle Pattern (Daily/Weekly)
A clear *rectangular consolidation box* :
- Upper Range: 1,016 - 1,050
- Lower Range: 900 - 950
This sideways movement indicates Distribution completion and potential energy buildup for the next directional move.
All major EMAs are converging in the 890-910 zone, creating a strong support cluster.
TARGET ANALYSIS:
Immediate Resistance Targets:
Target 1: 1,180 - 1,200 (First Major Resistance)
- Previous consolidation high from December 2025
- 61.8% Fibonacci retracement of the recent decline
Target 2: 1,334 (Secondary Target)
- Major swing high marked on weekly chart
- Psychological resistance zone
Target 3: 1,450 (Extended Target)
- Previous all-time high zone
- Final resistance before new highs
Critical Support Levels:
- 1,000: Immediate psychological support
- 900-920: MAJOR SUPPORT (EMA cluster + pattern base)
BULLISH BREAKOUT (Higher Probability - 65%)**
CONCLUSION:
Kirloskar Oil Engines is at a Critical juncture with strong technical setup favoring a Bullish breakout. The stock has:
- ✅ Successfully held major support zones
- ✅ Maintained position above all key moving averages
- ✅ Formed higher lows indicating accumulation
- ✅ Built a strong base for the next upward move
Disclaimer: This analysis is for educational purposes only. Please consult with your financial advisor before making investment decisions. Past performance does not guarantee future results.
Rectangle

Indonesia flag n pole ready for breakoutIDX:IDX30
everybody knows what to do now.
start your money-making machine with full throttle
please do your own research before taking any trade.
i am not financial advisor
risk is real stay practical
please feel free to ask any questions

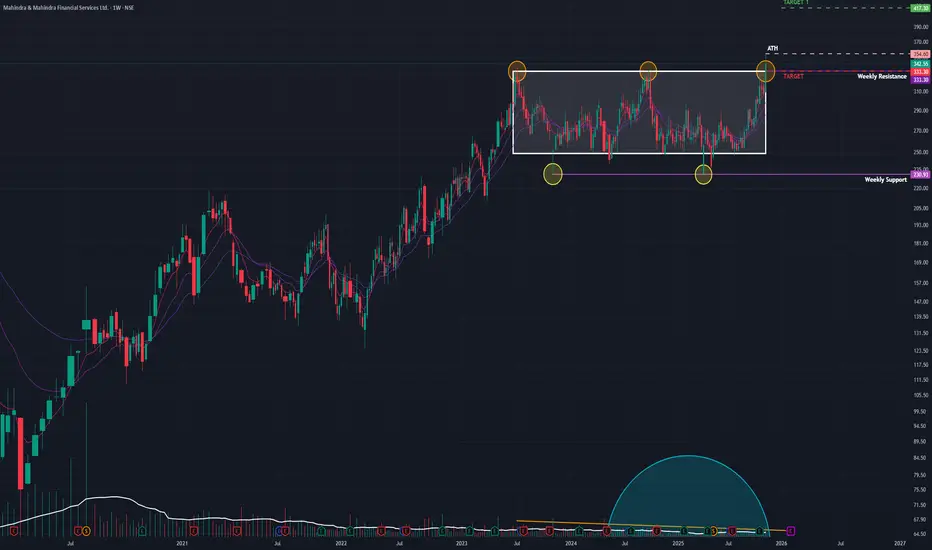
M&M Fin (W): Bullish, Breakout with Short-Term Rejection(Timeframe: Weekly | Scale: Logarithmic)
The stock has confirmed a major multi-year breakout, moving into "Blue Sky" territory. However, the daily price action suggests a temporary pullback (re-test) is imminent before the uptrend resumes.
📈 1. The Breakout Structure (The "Big Picture")
- The Setup: The stock has been trapped in a consolidation phase since its July 2023 peak. The ₹330–₹335 zone acted as a rigid "ceiling" for over two years.
- The Breakout: The week of Nov 17 was decisive. The stock surged 10.98% , closing above this multi-year resistance for the first time.
- Volume: The move was backed by 29.74 Million in volume —a significant expansion compared to the "dry" consolidation phase, confirming institutional participation.
🕯️ 2. The "Shooting Star" Warning (Daily Chart)
- The Pattern: The last daily candle (Friday) formed a Shooting Star . It opened high, rallied to a new peak (~₹354), but faced heavy selling pressure to close near the lows (~₹342).
- Implication: This "long upper wick" shows that sellers are aggressively defending the ₹350+ level. It strongly suggests that the breakout is "tired" and a re-test of the breakout zone is likely next week.
🚀 3. The Fundamental Catalyst (The "Why")
This technical move is supported by strong fundamentals, which adds confidence to the long-term bullish view:
- Earnings: The breakout is a delayed reaction to strong Q2 FY26 results, where Net Profit surged ~54% YoY and asset quality improved.
- Outlook: This fundamental strength suggests that any dip (re-test) will likely be bought by smart money.
📊 4. Indicators & Trend
- RSI & EMAs: RSI is rising (bullish momentum) and EMAs are in PCO state (trend alignment) across Monthly and Weekly charts. This confirms the primary trend is UP.
🎯 5. Future Scenarios & Key Levels
The "Shooting Star" dictates the immediate game plan: Wait for the Re-test.
🐂 The Bullish Case (Buy the Dip)
- The Strategy: Watch for the stock to pull back to the ₹333 – ₹335 zone (the resistance-turned-support).
- Confirmation: If the price stabilizes or forms a bullish candle (like a Hammer) at this level, it is a high-probability entry.
- Target 1: ₹417
- Target 2: ₹475
🐻 The Failure Case (Fakeout)
- Trigger: If the selling pressure from the Shooting Star intensifies and the stock closes back below ₹333.
- Consequence: This would confirm a "fakeout" (bull trap), and the stock could slide back toward the consolidation midpoint around ₹300.
Conclusion
The breakout is genuine, but the Shooting Star signals a short-term pause. The ideal approach is to wait for the re-test at ₹335 to confirm that the "ceiling" has truly become a "floor."
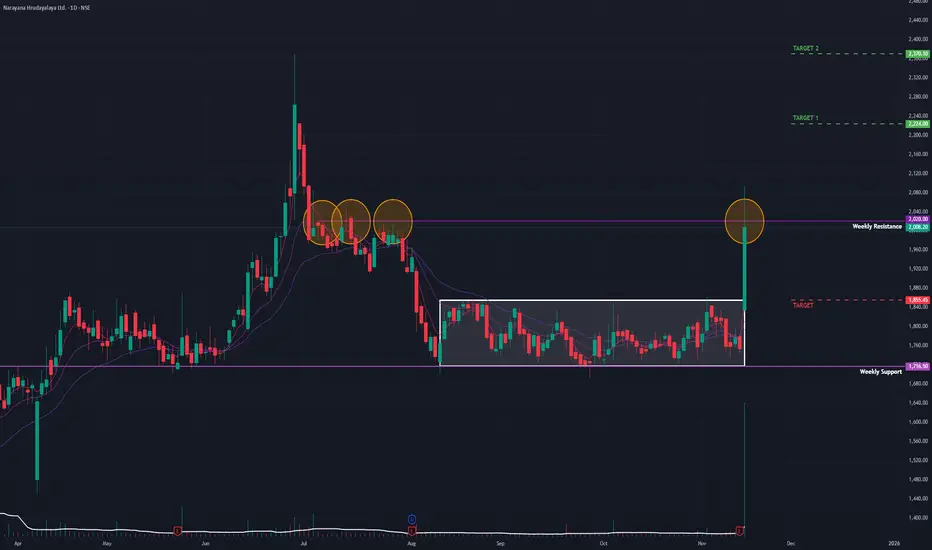
Narayana Hrudayalaya (D): Earnings-Driven BreakoutThe stock has decisively broken out of a 3-month consolidation phase. This technical breakout is powered by a strong fundamental catalyst (Q2 earnings), validating the surge and the high volume.
🚀 1. The Fundamental Catalyst (The "Why")
The breakout is a direct reaction to the company's Q2 FY26 Earnings announced today:
- Net Profit: Jumped 30% YoY to ₹258 crore.
- Revenue: Grew 20% YoY to ₹1,644 crore.
- Market Reaction: This stellar performance triggered the massive gap-up and volume spike, confirming that institutional money is chasing the stock.
📈 2. The Chart Structure (The "Setup")
- The Correction: After the June 2025 peak, the stock saw a healthy ~27.5% correction into August.
- The Consolidation: Since August, it formed a classic Rectangular Consolidation Pattern (a "box" range).
- Drying Volume: Volume dried up during this sideways phase—a textbook sign that sellers were exhausted and the stock was being accumulated.
💥 3. The Breakout (Today's Action)
- The Surge: The stock surged 14.53%
- The Volume: The move was backed by massive volume of 13.33 Million shares, the highest in months.
- The Resistance Break: The stock has decisively broken but not closed above the key horizontal resistance from July 2025 (the ₹2,020 level).
📊 4. Technical Indicators
- RSI: The Relative Strength Index is rising across Daily, Weekly, and Monthly timeframes , showing aligned bullish momentum.
- EMAs: Short-term EMAs are in a PCO (Price Crossover) state , signaling a fresh uptrend.
🎯 5. Future Scenarios & Targets
With the rectangular base now broken, the path of least resistance is up.
- 🐂 Bullish Target 1: ₹2,225 (Immediate technical extension).
- 🐂 Bullish Target 2: ₹2,370 (Retest of the All-Time High).
- 🛑 Support (The Safety Net): If the stock pulls back to digest these gains, the top of the rectangle at ₹1,850 should now act as strong support.
ASIANPAINTS RECTANGLE BREAKOUTAsianpaints breaking rectangle pattern weekly basis
huge volume this week,bullish RSI
breaking 20 week ema,above all key ema
strong q2earnings,crude oil cooling off
target 3400 sl 2600
NO BUY/SELL RECOMENDATION

Short term swing on Jyoti CNCWith the earnings flattening out , EPS seems to have bottomed out and recent CEO statements clearly indicate strong order book and positive cash flow in Q3 leading upto Q4.
Along with these fundamental view , it formed a base between 878 - 924 range. Entererd the trade on breakout and pull back in to base.
Entry : Entry 912
SL : 875 ( I usually dont keep a hard SL, I exit if the price sustains under 875 for 2 successive trading sessions - thats how I've found success )
Target : 1035
Current entry does look for slightly longer term hold in which case I would add more qty if the price drops under 870 ( hold for 6-12 months ) . The hold would make sense if the company delivers on the time while sustaining a strong order book and cash flow as predicted which would eventually elevate the EPS and price should go up n beyond the previous ATH.
Note: Personally , I have a long term position which I opened at 411 so currently this is just a swing but yes a substantial drop under 870 and I'll add to my long term position.

InoxGreen (Weekly) - Major Breakout, Potential New UptrendInox Green Energy has shown significant bullish strength, breaking out of a key long-term horizontal resistance trendline last week. This crucial move was powered by a substantial +13.61% price surge and supported by decent trading volume, signaling a potential continuation of its upward trajectory.
This breakout follows a period of sideways consolidation that began in May 2025. The prior resistance had capped the stock's progress after its trend reversed in April 2025, following a downtrend from its All-Time High in September 2024.
Bullish Confirmation Signals 👍
The positive outlook is reinforced by key technical developments:
- Breakout Volume: The price surge was accompanied by **healthy volume**, indicating conviction behind the move.
- Momentum: Short-term Exponential Moving Averages (EMAs) also completed a positive crossover this week, a strong indicator of building upward momentum.
Future Outlook and Key Levels
The price action in the coming week will be critical for confirming the breakout's sustainability.
- Bullish Case 📈: If the upward momentum continues with strong volume, the stock could be on track to reach the next potential resistance level at ₹224 .
- Bearish Case 📉: However, if the stock fails to sustain the breakout momentum, it could pull back to find support near the ₹149 level.

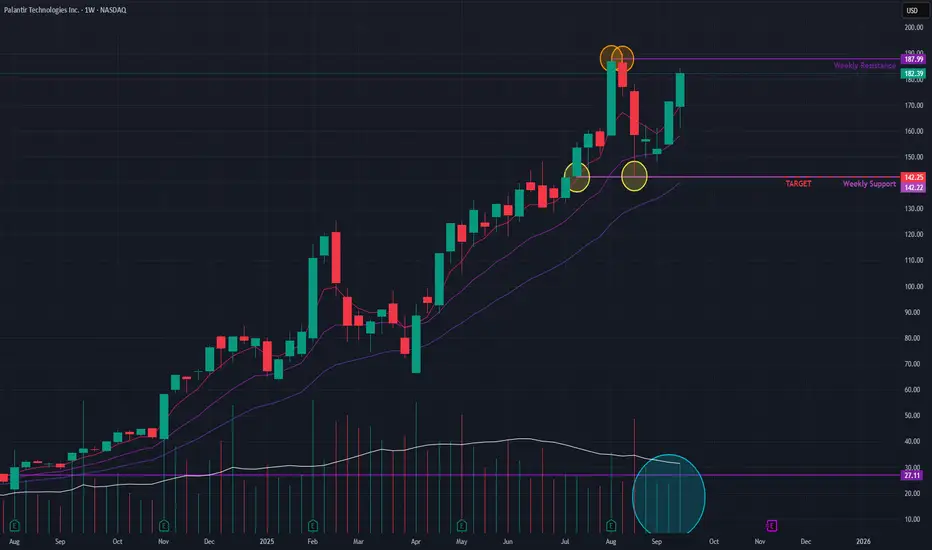
Palantir (Weekly) - Consolidation Near All-Time HighAfter reaching a new All-Time High (ATH) in recent weeks, Palantir has entered a period of consolidation. The stock has since been trading in a sideways range, struggling to break past the newly established resistance level.
Emerging Bullish Signals 👍
Despite the sideways movement, several indicators suggest that buyers are showing renewed interest:
- Momentum: Short-term Exponential Moving Averages (EMAs) have formed a positive crossover , a technical signal indicating that upward momentum is building.
- Volume: Trading volume has been noticeably increasing , which suggests growing accumulation and buyer interest at the current price levels.
Future Outlook and Key Price Levels
The stock is currently positioned for a potential move, with two clear scenarios:
- Bullish Case 📈: A decisive breakout above the short-term horizontal resistance would signal a continuation of the uptrend. If this occurs, the next potential price target could be USD 234 .
- Bearish Case 📉: If the stock fails to overcome the resistance and momentum fades, it may decline to the lower boundary of its consolidation range, with a potential support level near USD 142 .
Watchout for the next moves !!
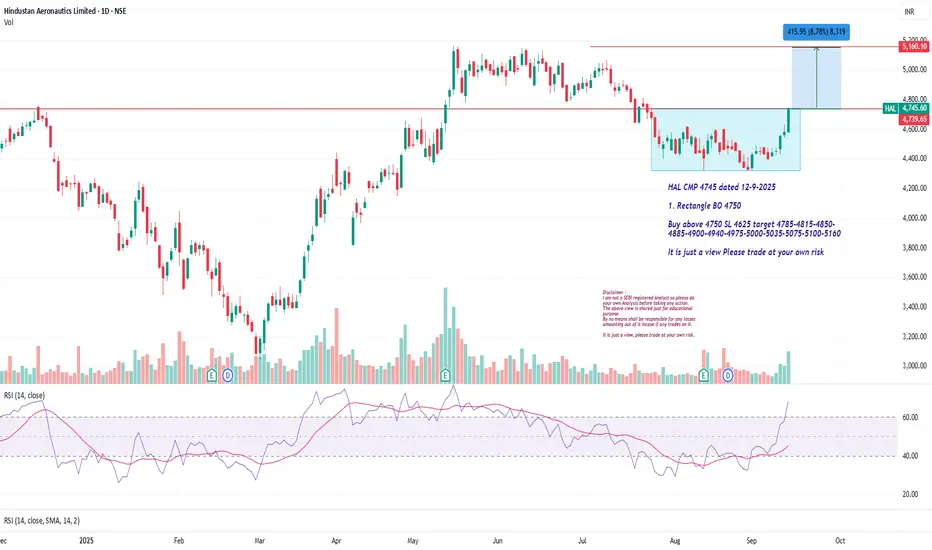
HAL CMP 4745 Rectangle BOHAL CMP 4745 dated 12-9-2025
1. Rectangle BO 4750
Buy above 4750 SL 4625 target 4785-4815-4850-
4885-4900-4940-4975-5000-5035-5075-5100-5160
It is just a view Please trade at your own risk
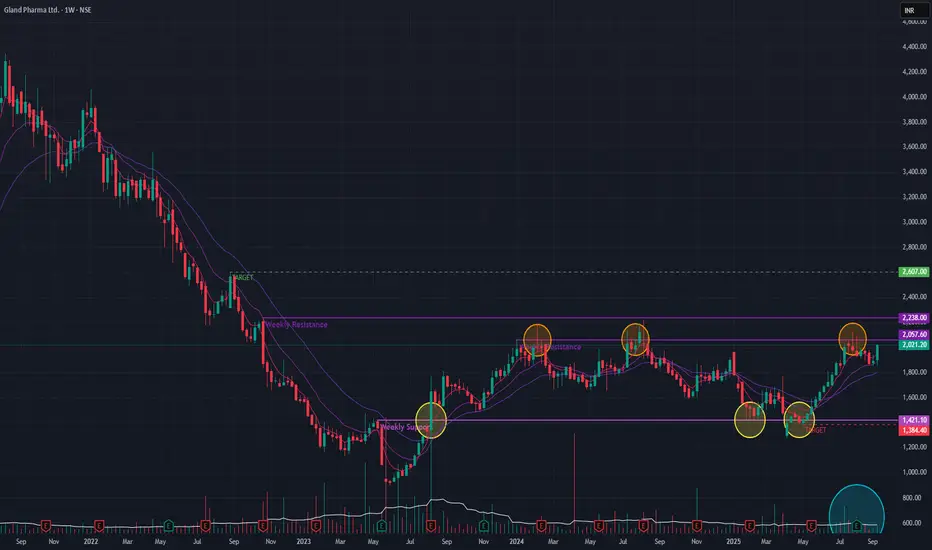
Gland Pharma (Weekly Timeframe) - Breakout of Sideways trend ?After a prolonged downtrend from its all-time high in August 2021, Gland Pharma has been trading in a sideways consolidation range since August 2023. Recent price action suggests that the stock is building momentum for a potential breakout, signaling a possible end to its bearish phase.
## Bullish Developments 📈
Recent Momentum: The stock showed significant buying interest last week, surging +6.82% accompanied by a decent spike in trading volume .
Technical Posture: The short-term Exponential Moving Averages (EMAs) have entered a Positive Crossover (PCO) state , a classic bullish signal indicating that near-term momentum is shifting upwards.
Breakout Potential: This renewed strength positions the stock to challenge its long-term horizontal resistance trendline. A decisive break above this level would confirm a bullish trend reversal.
## Key Price Levels to Watch
Immediate Resistance: The first major hurdle is at the ₹2,238 level. A sustained move above this is required to confirm the breakout.
Upside Target: If the resistance at ₹2,238 is breached, the next potential target for the stock is ₹2,607 .
Downside Support: If the upward momentum fails to continue, the stock could find support near the ₹1,384 level.
Price-action is key !!
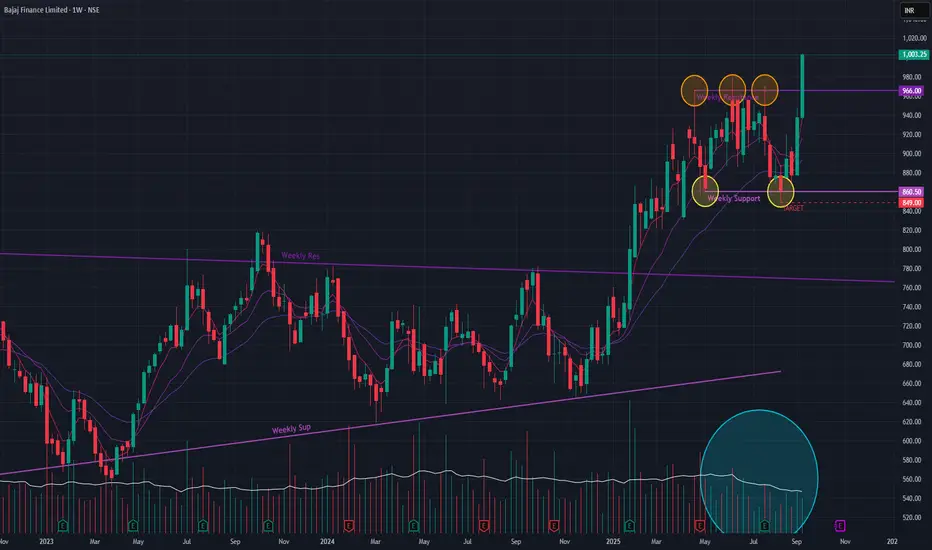
Bajaj Finance (Weekly Timeframe) - Making new ATHAfter a multi-month sideways consolidation from April to September 2025, Bajaj Finance has signaled a potential resumption of its primary uptrend. This recent price action mirrors a similar pattern seen from October 2021 to January 2025, which was followed by a powerful rally to new all-time highs.
## Recent Bullish Developments 📈
Pattern Breakout: The stock decisively broke out of its recent sideways range last week, surging +7% on strong volume & a new ATH. This move indicates a shift from balance to imbalance, with buyers taking firm control.
Sustained Momentum: The buying pressure has continued, resulting in a rally of over 14% in the past two weeks.
Technical Confirmation: The short-term Exponential Moving Averages (EMAs) are in a Positive Crossover (PCO) state, a classic bullish indicator that supports the case for continued upward momentum.
## Outlook and Key Levels
The breakout suggests that the stock is poised to challenge its previous highs.
Upside Potential: If the current momentum is sustained, the next logical price target in the near term is the ₹1,077 level.
Downside Risk: Should the breakout fail and momentum wane, the stock could pull back to test the support zone around ₹849 .
The key factor to watch is trading volume. While the initial breakout volume was good, sustained buying interest is needed to fuel the next leg of the rally.
Mazagaon Dock Cmp 2925 Rectangle BOMazagaon Dock Cmp 2925 dated 12-9-2025
1. Rectangle BO done @ 2910
2. Rise in Volume
Buy above 2930 SL 2840 target 2950-2970-2985-
3000-3025-3040-3065-3095-3125-3140-3175-3200-
3225
It is just a view, please trade at your own risk.

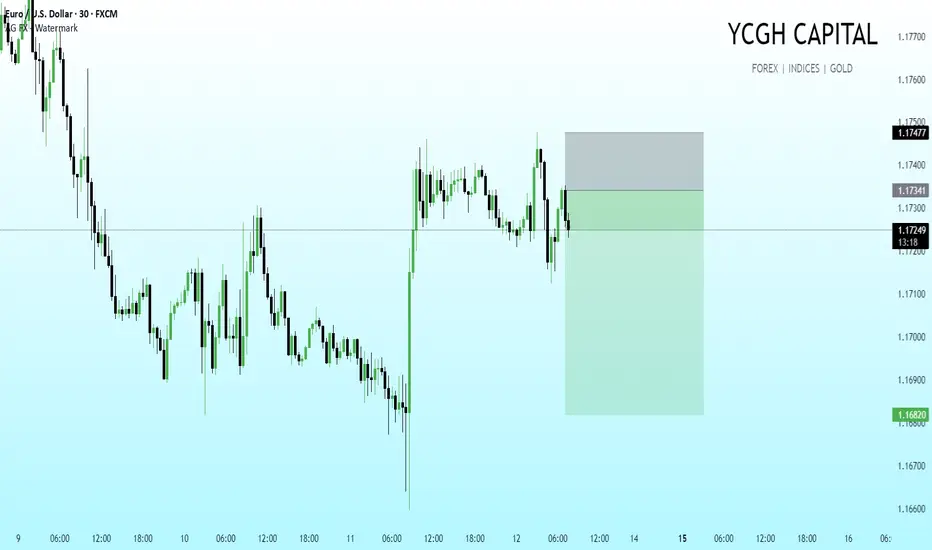
EUR/USD | 30M | Live Execution Zone
We’ve marked out our trade zone post-CPI. Price tapped into our supply pocket at 1.1747 and is now reacting as anticipated. Position structured with:
Entry at the rejection from supply
Stop above the sweep zone
Target the lower liquidity pool near 1.1680
Key narrative: Market took out liquidity on both sides, confirmed displacement, and is now showing signs of delivering south before the next structural shift.
This is a clean setup aligning with the higher-timeframe bias — patience and discipline doing the work.
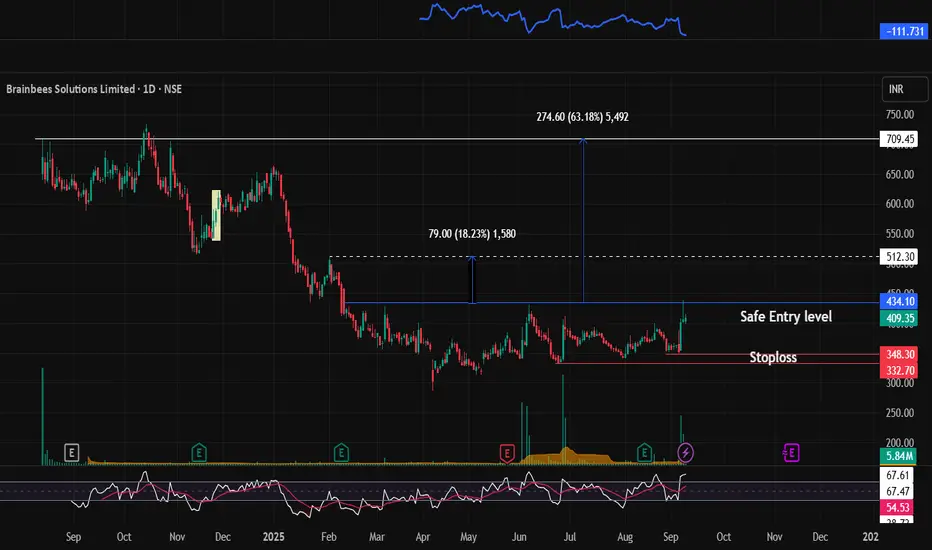
FIRSTCRY (Breakout Candidate) - Swing Pick#FIRSTCRY #stage1stock #breakoutstock #Trendingstock
FIRSTCRY : Swing / Short term (1-3 months)
>> Ready for Stage 1 breakout
>> Momentum stock
>> Volumes Spike Visible
>> Good strength in stock
>> Swing Traders can target 18% move, short term traders can look for Higher Targets
Swing Traders can lock profit at 10% and keep Trailing
Please Boost, comment and follow us for more Learnings
Disc : Charts shared are for learning purpose only, not a Trade recommendation. Do your own research and consult your financial advisor before taking any position.
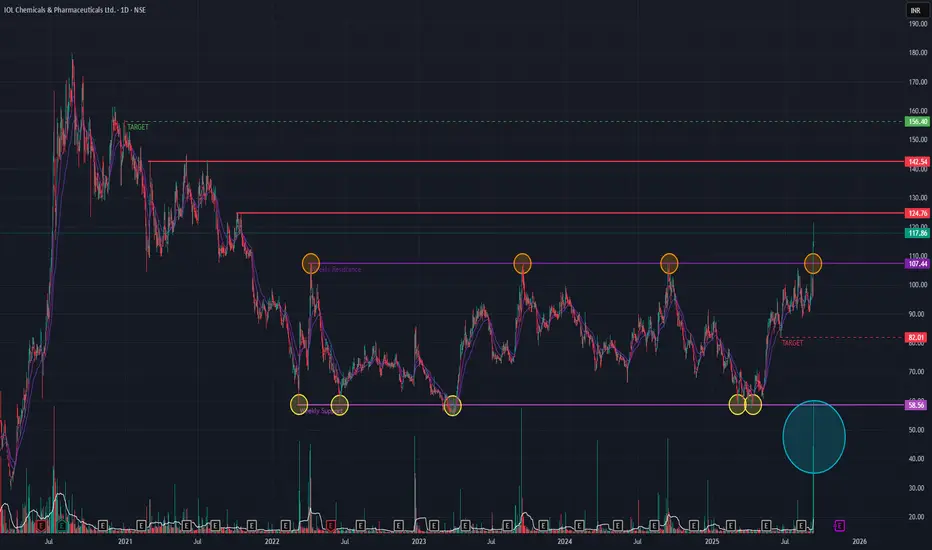
IOL CP (Daily Timeframe) - Has the Sideways Trend BrokenOut ??IOL CP in the past two sessions have BrokenOut of the sideways trend that it was in since Mar 2022. Several attempts in the past to BreakOut of this trend has failed as indicated. The past two days, the stock was able to BreakOut as well as maintain it with huge volume. Short-term EMAs are in PCO state as well as a Golden Cross-over has formed few days back indicating bullishness.
If upside momentum continues then we may see 156 levels provided few resistances are breached. The stock may see 82 levels if the momentum is not sustained.
Keep monitoring the price-action !!
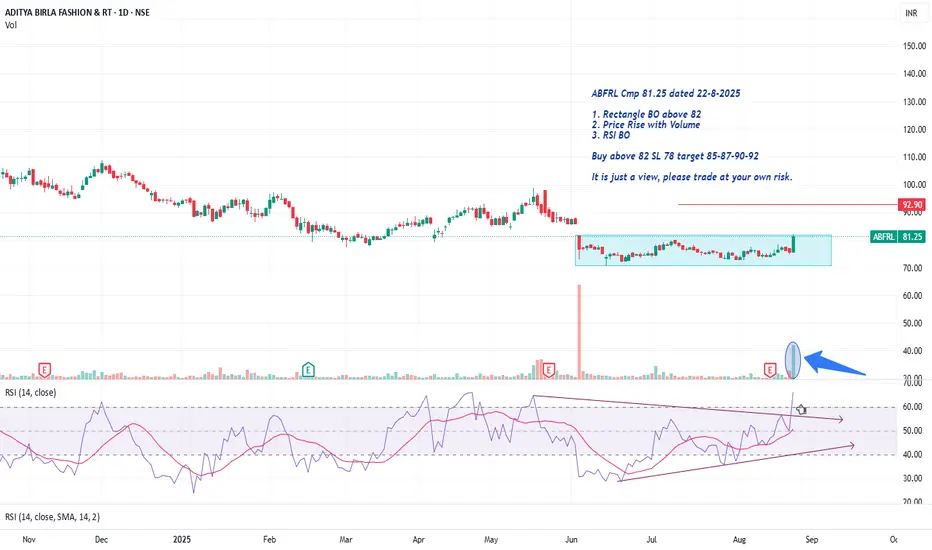
ABFRL Cmp 81.25 Price Rise with VolumeABFRL Cmp 81.25 dated 22-8-2025
1. Rectangle BO above 82
2. Price Rise with Volume
3. RSI BO
Buy above 82 SL 78 target 85-87-90-92
It is just a view, please trade at your own risk.
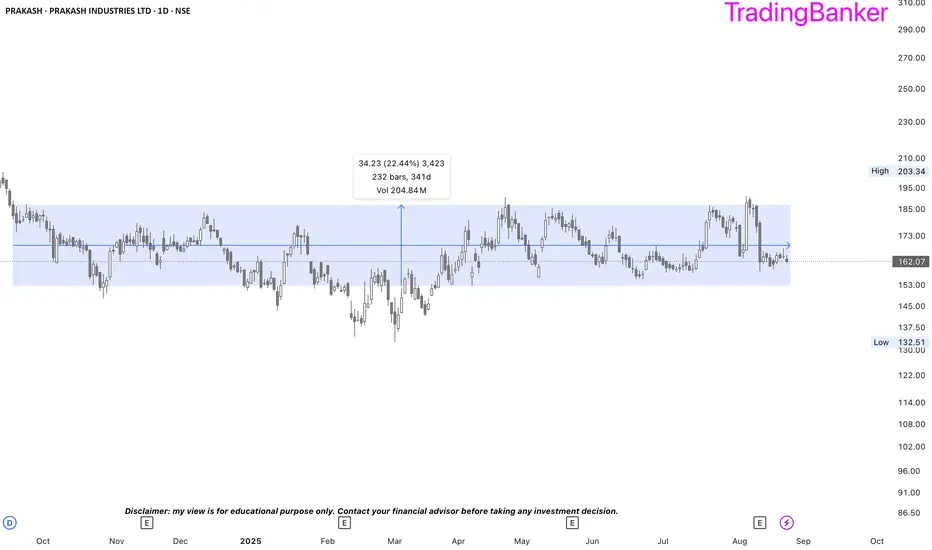
PRAKASH: range breakout soon?➡️script stuck in a range for almost a year and coiled up like a spring in the rectangle pattern.
➡️highest margins in last 5 years and an extremely low PE of 8 against the industry PE of 23.
➡️capex should bear fruit soon.
➡️highest promoter holding in last 6 years.
➡️not a matter of if, it’s a matter of when.
HDFCBANK | Result analysis |Support and resistance 🔍 Quick Summary: What’s Priced In?
Despite a solid PAT beat (₹18,160 Cr, +12% YoY), NII missed expectations (only +5% YoY) and margins fell. The profit beat was largely driven by non-core gains (₹9,130 Cr stake sale in HDB Financial). This signals:
Core operations slightly underwhelming
Market may not reward the PAT beat aggressively
Bonus + Dividend is already priced in (price rallied earlier)
📉 Technical & Derivatives Outlook:
🧱 Price Action:
Cup & handle breakout recently happened ✔️
Price is stuck in a channel (as seen on the chart)
Consolidation breakdown on friday -target 1918.75
Facing strong resistance around ₹2000–2040 (High Volume Nodes + OI buildup)
Immediate support: ₹1918–1840 (Volume cluster + previous breakout retest)
🔍 OI Data (as of July 18):
PCR: 0.6 → Bearish bias
Highest Call OI: 2000–2040 CE → Acts as resistance ceiling
Strong Put OI only around 1900–1920 → Weak support zone forming
🔮 Expected Price Action Next Week:
🔻 Bearish to Sideways Bias:
Given weak core NII and resistance zone near ₹2000, stock might consolidate or correct slightly.
If ₹1918 breaks, can test ₹1840 again.
Only a breakout above ₹ 1988 and ₹2040 with volume will revive bullish momentum.
🛡️ Key Levels to Watch:
Direction Key Level Action
Resistance ₹1988–2027 Selling pressure(OI + HVN)
Support ₹1918 Breakdown -₹1840
Strong Sup ₹1840 High volume node + previous breakout
🎯 Conclusion (1-week view):
📉 Slightly bearish / sideways expected
📌 Likely range: ₹1918 – ₹2000. Cmp- 1957
🎯 Bulls need a close above ₹2040 for further upside

North East is booming and transport of cement is not easyThese are locally made ingredients
They cant be moved from far off places
Transportation increases cost
I feel that this stock can be in a big bull run into this decade

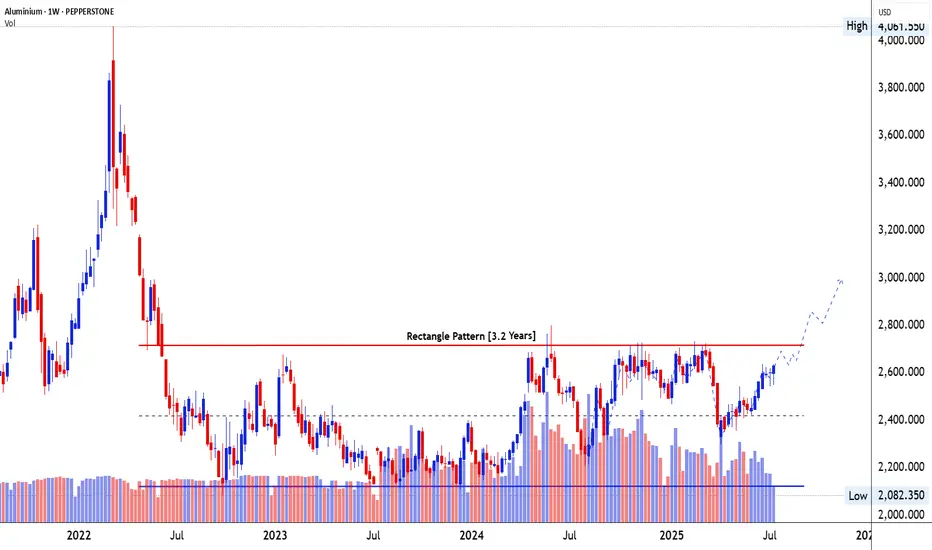
Big Breakout Soon in Commodity Chart similar to Silver Chart- 🚀 ALUMINIUM - $2631
Date: 18-07-2025
Price: $2,631.05
Volume: 37.12K
1⃣ Pattern Structure & Breakout Development 📈
📐 Pattern Identification: A Rectangle Pattern has been forming over 3.2 years, acting as a large-scale accumulation base. This is a continuation pattern typically seen in commodities post major corrections, where price builds energy for the next directional leg.
⏳ Time Taken in Formation: Over 166 weeks (~3.2 years), price has remained within a defined range. This extended time reflects long-term accumulation and the absorption of supply by institutional players. Such long bases often precede explosive breakouts.
📊 Price Trend Before the Pattern: The trend leading into the rectangle was a sharp downtrend from 2022 highs. The drop was vertical, indicating panic or macro stress, followed by multi-year stabilization inside the rectangle.
📦 Price Movement Inside the Pattern: The range has been defined by $2,080 on the lower side and $2,710 on the upper side. Inside this range, the price has respected support and resistance with multiple bounces, forming higher lows since early 2024, hinting at underlying strength and diminishing seller strength.
🚀 Breakout Zone & Behavior: The resistance level at $2,710 is a multi-tested zone, tested over 5–6 times. This increases its significance. Current price is approaching this zone with momentum, and a breakout above it would activate the 3.2-year base, unleashing a possible long-term trend.
2⃣ Volume Behavior & Breakout Validity 🔍
📉 Volume During the Pattern: Volume was consistently high during the early phase of the rectangle, especially near the bottoming area, suggesting accumulation. It gradually tapered off during consolidation — classic sign of supply exhaustion.
📈 Volume Before the Breakout: Recent price candles show expanding volume near higher lows and bullish follow-through candles. This reflects smart money buildup before the expected breakout.
💥 Volume on Breakout Candle: The breakout is not yet confirmed, but once $2,710 is taken out on weekly closing basis, we expect a clear volume spike, validating the breakout.
🔮 Volume After Breakout – What to Expect: Post-breakout, volume must remain above average to sustain momentum. Low volume on breakout would increase false breakout risk. Watch for weekly candle closes above $2,710 with volume expansion for confirmation.
3⃣ Candlestick Dynamics & Trap Awareness 🕯️
🔥 Candles Formed Before Breakout: Recent weekly candles include strong bullish engulfing and hammer candles, especially near the $2,400–2,450 zone. These are reliable reversal signals when formed after higher lows.
💎 Breakout Candle Characteristics (Expected): Ideally, we want a large-bodied bullish candle, closing decisively above $2,710, with minimal upper wick and expanding volume.
⚠️ Impact of the Breakout Candle: A clean breakout with follow-through would invalidate the rectangle resistance and invite fresh breakout buyers. But a failed breakout or long upper wick near $2,710 without volume may lead to a bull trap — especially if price falls back below $2,600.
4⃣ Trade Setup – Entry, Exit & Risk Strategy 🛍️
🛡️ Safe Entry: Wait for weekly close above $2,710, then enter on retest near $2,700–2,720, confirmed by a bullish reversal candle.
⚡ Aggressive Entry: Enter now near $2,630–2,650, with tight SL below the recent higher low at $2,480, anticipating the breakout.
🎯 Target Zones:
Target 1: $3,000 – round number and psychological barrier
Target 2: $3,400 – historical consolidation zone and pattern-measured move (rectangle height projected upward)
🚩 Stop-loss Placement:
Conservative SL: Below $2,600 (minor swing)
Structure-based SL: Below recent higher low – $2,480
5⃣ SEBI Disclosure – Educational Purpose Only 📜
“This report is for educational purposes only and does not offer investment advice. Mr. Chartist (Rohit Singh) is a SEBI Registered Research Analyst under the Investology (INH000012376). Please consult a SEBI-registered advisor before taking any investment decisions. All investments carry risk. Past performance is not a guarantee of future results.”
#Trading #Investing #Stocks #TechnicalAnalysis
EURUSD SELL IDEA FOR DAY TRADINGHere We Could Sell On Trendling and Immediate resistance basis for EURUSD to gain 1:2 RR Ratio

A strong upside momentum Silver is the commodity to be in
Goutham Shah of Goldilocks
Many on CNBC TV18
YouTube legends like Mile Maloney

SOLARA |Box Breakout 📦 NSE:SOLARA | Box Breakout Alert 🚨
Tight range for 6 months ➡️ explosive breakout above ₹590
Volume surge = big money move 💰
Target: ₹729
RSI confirms strength 📈
Classic base breakout — the longer the base, the stronger the move! 🔥
#BreakoutStocks #NSEIndia #VolumeSpike
