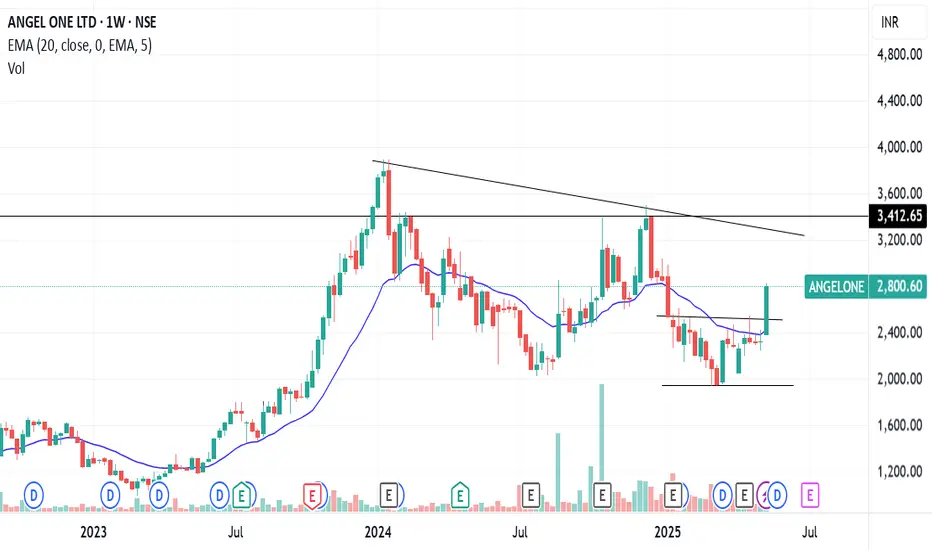
ANGELONE RANGE BREAKOUTAngelone breaking a range weekly basis
with good volume ,strong rsi
#target1 3200
#target2 3400
DO YOUR OWN RESEARCH BEFORE INVESTING
Rectangle
SARDAEN - Breakout WatchlistWhy This Stock?
✅ Base Breakout – Breaking above ₹526.2 with strong volume confirmation (4-5x past trading sessions).
✅ Trading Above Key DMAs – Strong price structure with good RSI.
✅ No Left-Side Resistance – Clean chart structure with potential for an uptrend.
✅ Formation of W Pattern + VCP – Classic bullish continuation setup.
✅ Resisted Market Fall – Showcasing relative strength despite overall weakness.
Safe traders wait for a weekly close above the break-out level ₹526.2.
Key Levels
📌 Entry: ₹538.50
📌 SL (Closing Basis): ₹423.10
📌 Breakout Level: ₹526.2
Fundamentals (Key Metrics)
Market Cap: ₹18,979 Cr.
Stock P/E: 27.9
ROCE: 15.3%
ROE: 14.1%
Sales Growth (YoY): Improving
OPM % YoY Improving
EPS YoY: Improving.
What Could Go Wrong?
⚠️ Overall Market Trend is Bearish – Any weakness in broader indices can drag the stock down.
⚠️ Sectoral Index is Weak – Lack of sectoral strength may limit upside potential.
⚠️ High SL Probability – Strong pullbacks can invalidate the breakout; hence, buy test quantities only.
⚠️ Deep SL
Why This is Worth Watching?
📈 Stocks that Fell Less in Correction – Often become early movers when the market stabilizes.
📈 Volume Picking Up – A good sign that institutional interest might be present.
🚨 Disclaimer: This is not a trade recommendation but a watchlist alert. Do your own research before making any trading decisions. 🚨

BDL – Weekly W-Pattern + Sector Strength + Volume Surge 📈 BDL – Weekly W-Pattern + Sector Strength + Volume Surge = High-Potential Positional Setup
BDL is showing textbook technical confluence at the right time:
Sector: Defence index at all-time highs
Stock: BDL forming a clear double bottom (W-pattern) over several months
Weekly breakout underway with strong green candle and volume confirmation
Structure: Rounded base, higher lows, long support holding strong
Price just broke key levels with momentum — setup for multi-leg positional rally
🧠 Technical Highlights
✅ W-pattern (double bottom) over weekly chart confirms accumulation & reversal
✅ Price breakout from neckline zone around ₹1,525+
✅ Clean structure with support zone holding for 8+ months
✅ Volumes rising with the breakout — early signs of trend continuation
✅ Defence sector tailwind active
🧮 Setup Overview
Entry Zone ₹1,530–₹1,540
Stop Loss (SL) ₹1,293.95
ATH Resistance ₹1,799.45
Target (Positional) ₹2,363.55
SL % −15.38%
Target % +54.34%
Risk : Reward 1 : 3.5
📊 Strategy Recommendation
Add 30–40% position now
Add more on clean ATH breakout or base retest with volume
Avoid full position in one shot — shakeouts possible on weekly charts too
Let volume lead the move — don’t pre-empt full size
⚠️ Cautionary Note:
While the setup is structurally strong, remember:
Markets are still volatile
Sudden sector pullbacks or macro headlines may affect entries
Stick to position sizing and respect your stop loss
📌 Summary
BDL is setting up for a high-reward positional breakout fueled by a confirmed W-pattern, sector momentum, and volume surge. Structure is tight, risk is defined, and the upside potential is significant.
📉 Disclaimer:
This is not a buy/sell recommendation. For educational purposes only. Do your own research and manage risk as per your capital and style.

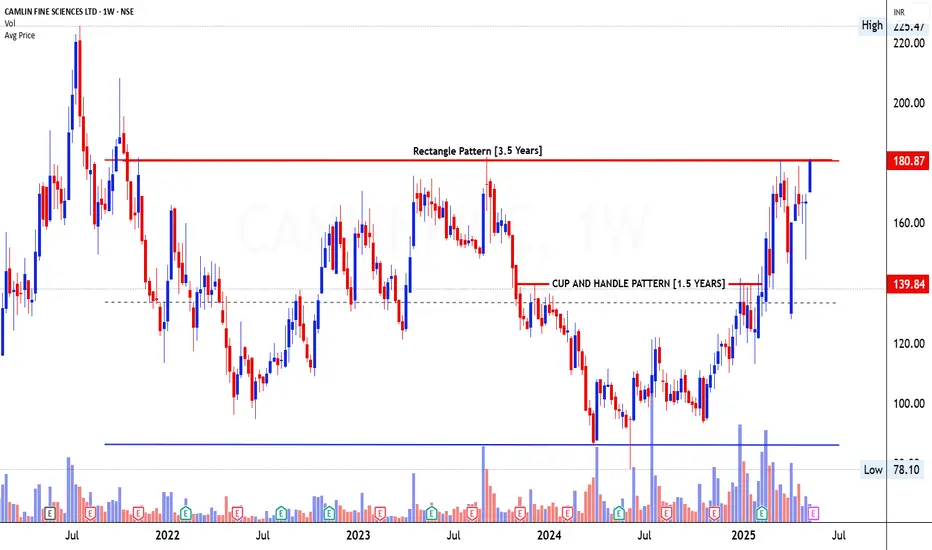
CAMLINEFINE- Rectangle Pattern🚀 Breakout Stock Alert: Camlin Fine Sciences Ltd (CAMLINFINE)
📌 Price: ₹179.00 📊 Volume: 2.91M 📅 Date: 13-05-2025
① Pattern Name, Timeframe, Structure & Explanation
Rectangle Pattern (3.5 Years) on Weekly Chart
The stock of Camlin Fine Sciences Ltd has been coiling inside a broad Rectangle Pattern for over 3.5 years, bounded by a solid support near ₹78 and resistance near ₹181. This long consolidation phase indicates prolonged accumulation, marked by multiple failed attempts to cross the ₹180 zone, creating a horizontal ceiling.
Price behavior has been extremely constructive:
* Compression near the resistance zone signals absorption of supply
* The stock is now testing the upper resistance of ₹180.87 with strength
② Volume Formation (During Pattern, Breakout, and Retest)
* Volume dried up during the handle phase, confirming lack of aggressive selling
* Breakout rally saw multiple weekly spikes in volume, particularly near ₹140 and again as price approached ₹180
* Volume this week stands at 2.91M, above the 20-week average (approx. 2M), indicating accumulation by smart money
* Volume clusters on rallies and fades on corrections = institutional footprint
③ Breakout Candlestick, Follow-Through & Trap Behavior
* The breakout candle is a strong full-bodied bullish bar, closing near high of week, with no upper wick — a sign of conviction
* Previous week was an inside bar showing hesitation, but no breakdown, which has now been invalidated
* No visible trap or shakeout on breakout — the trap happened earlier in the handle dip around ₹130-140, where weak hands were shaken out
* Clean follow-through over past 3 weeks with higher closes
④ Trade Explanation (Entry, Target, Stop-loss, Risk\:Reward)
* Entry Zone: ₹180–183 (Breakout zone)
* Stop-loss: ₹139 (Base of handle and prior breakout resistance)
* Target Zone: ₹250–265 (Measured move from rectangle height: ₹180–₹78 = ₹102. Add ₹102 to breakout = ₹282 max potential. Conservatively ₹250–265)
* Risk\:Reward: Approx 1:2.5+
→ Risk: ₹40, Reward: ₹70–85
The breakout from a multi-year range, backed by strong volume and constructive price action, gives high conviction. Ideal for positional swing traders.
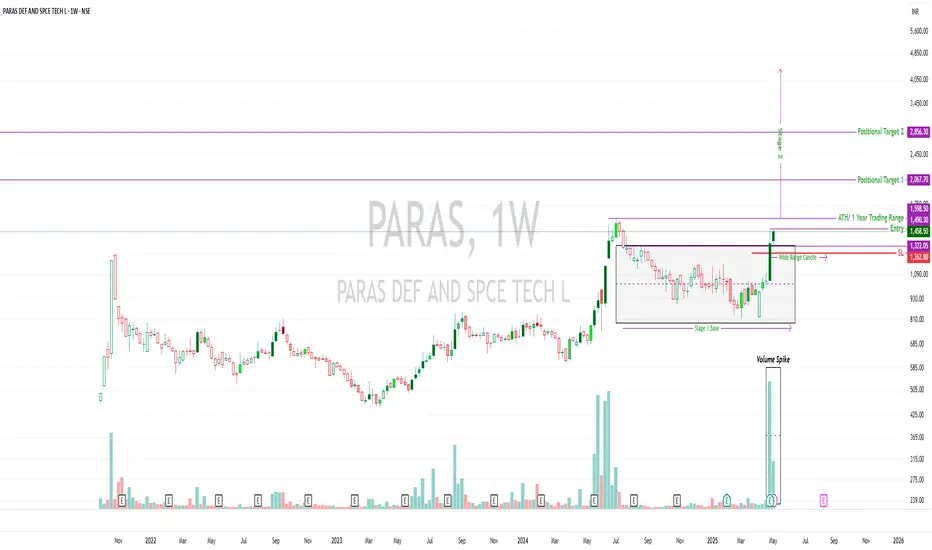
PARAS | Stage 2 Setup in Motion | ATH Watch🚀 PARAS | Stage 2 Setup in Motion | ATH Watch
Paras Defence & Space Tech Ltd | Weekly Chart
🔍 Technical Overview:
Stock has broken out of a Stage 1 base spanning nearly a year 📦
Printed a wide-range breakout candle with a massive volume spike – signs of institutional accumulation
Currently trading above all key DMAs, including the 50D, 200D, and 30W averages
Cleared the ₹1,490–₹1,598 zone (1-year range high), but...
⚠️ ATH Not Yet Broken
₹1,598.5 remains the all-time high (ATH)
A clean breakout + retest + continuation beyond this ATH will offer stronger confirmation for positional targets
Until then, it’s a high-potential but early breakout — watch follow-through closely
📊 Trade Levels
Entry: ₹1,458.5
SL (Closing Basis): ₹1,262.8
Positional Target 1: ₹2,067.7
Positional Target 2: ₹2,856.3
📐 Risk:Reward
Risk = ₹195.7
Reward to T1 = ₹609.2 → R:R = 1 : 3
Reward to T2 = ₹1,397.8 → R:R = 1 : 7
🧠 Notes for Traders:
This is a technically strong breakout from a deep base
But ATH is a major psychological level — wait for confirmation or follow-up strength
No early entries without defined risk, especially in a high-volume breakout
Retests can offer better entries with lower risk exposure
🛡️ Risk Management First
No matter how clean the chart looks, position sizing and stop-loss discipline are non-negotiable.
Trade only what aligns with your system and tolerance. Protect capital first, chase profits second.
📜 Disclaimer: This is a personal technical view. Not investment advice. Always do your own research or consult a SEBI-registered advisor before taking any trade.
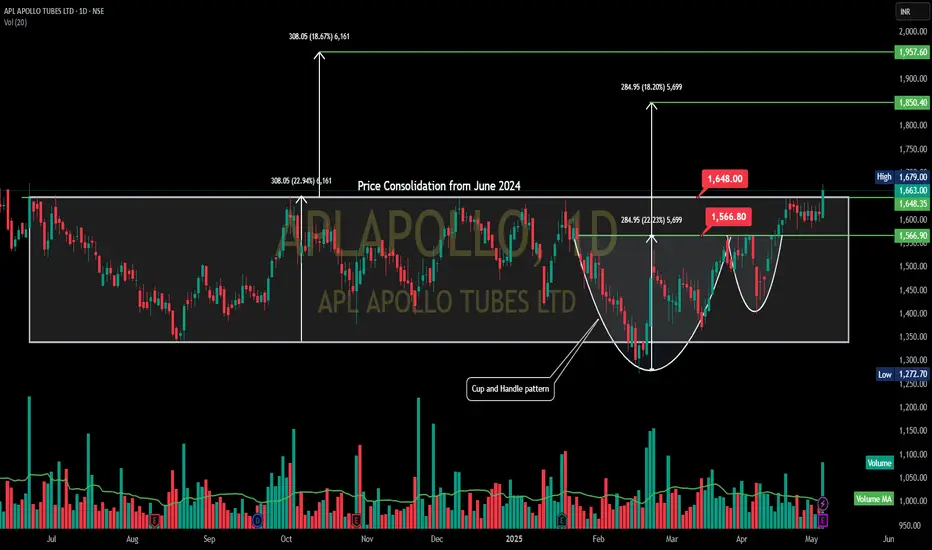
APL APOLLO TUBES LTD - Consilidation- Cup and HandleAPL APOLLO TUBES LTD - Daily Chart
Pattern: The chart shows a period of Price Consolidation from June 2024 within a broad range, roughly between 1,300 and 1,640. Within this larger consolidation, a "Cup and Handle" pattern has formed more recently.
Cup: Formed from approximately mid-February 2025 to mid-April 2025, with the low around 1,272.70.
Handle: A smaller consolidation (handle) formed in late April/early May 2025.
Neckline/Breakout Level: The price is attempting to break out above the neckline of this Cup and Handle, which also coincides with the upper resistance of the broader consolidation range, around 1,640.00 - 1,648.00.
Volume: Volume appears to be increasing on the current breakout attempt from the handle and the larger consolidation.
Target:
The depth of the more recent cup (approximately 284.95 points) projected from the breakout (around 1,586 - which seems to be the C&H neckline) gives a target around 1,850.40.
The height of the larger consolidation (from Oct 2024, approx 308.05 points) projected from the upper boundary breakout (around 1,648) gives a target around 1,957.60. The chart uses both.
Support: The breakout level around 1,640.00 - 1,648.00 is the key immediate support. The low of the cup (1,272.70) is a more significant long-term support.
Resistance: The immediate resistance is the current breakout zone. The projected targets of 1,850.40 and 1,957.60 are the next resistance levels.
Interpretation: APL Apollo is attempting a significant breakout from both a recent Cup and Handle pattern and a longer-term consolidation range. If successful, this could lead to a strong upward move towards the projected targets. The increased volume supports the bullish case. Confirmation above 1,648.00 is key.
SRF LTD - Weekly
Pattern: The chart shows a very long period of Box Consolidation or a Rectangular Range. The price has been trading within a broad range roughly between 2,060 and 2,700 from late 2021/early 2022 until early 2025.
Breakout: In early 2025, the stock has decisively broken out above the upper boundary of this multi-year consolidation range (around 2,700).
Volume: There's a significant increase in volume accompanying the breakout, which is a strong bullish confirmation.
Target: The height of the consolidation box (approximately 658.50 points) is projected upwards from the breakout point. This suggests a target of around 3,358.60.
Support: The upper boundary of the consolidation range (around 2,700) is now a very strong support level.
Resistance: The immediate resistance is the recent high around 3,060.35. The primary target is 3,358.60.
Interpretation: The breakout from a multi-year consolidation on a weekly chart is a very significant bullish development. This suggests the beginning of a new, potentially strong uptrend. The stock is likely to head towards its target of 3,358.60, with the 2,700 level acting as a robust base.

GODREJPROP - Rectangle -BO -DailyGodrej Properties Ltd (GODREJPROP) has recently released its Q4 FY25 results, revealing a mixed performance.
📊 Financial Highlights (Q4 FY25)
Net Profit: Declined by 19% year-on-year to ₹382 crore, compared to ₹471 crore in Q4 FY24.
Revenue: Increased by 49% year-on-year to ₹2,122 crore.
EBITDA: Slightly decreased by 2% to ₹634 crore.
Expenses: Overall expenses rose by 54%, primarily due to increased material consumption costs.
Bookings: Achieved record-high quarterly bookings of ₹10,163 crore, marking a 7% year-on-year increase.
FY26 Guidance: The company anticipates new bookings of ₹32,500 crore for FY26, slightly lower than FY25 projections.
Market Cap: Approximately ₹65,011 crore.
P/E Ratio (TTM): 43.66.
P/B Ratio: 3.86.
Debt-to-Equity Ratio: 1.25.
The chart **Godrej Properties Ltd (GODREJPROP)** shows a **bullish breakout** from a **rectangle base consolidation pattern**, suggesting a potential uptrend continuation. Here's the technical breakdown:
---
### 🧠 **Chart Pattern Analysis**
- **Pattern:** Rectangle base (accumulation zone) between ~₹1,900 and ~₹2,212
- **Breakout Level:** ₹2,212.50 (horizontal resistance)
- **Breakout Candle:** Strong bullish candle with volume spike (confirmation)
- **Target Projection:**
- Rectangle height: ₹2,212.50 - ₹1,900 ≈ ₹312.50
- Target: ₹2,212.50 + ₹312.50 = **₹2,525** (matches chart projection)
---
### 📌 **Key Levels**
- **Immediate Resistance:** ₹2,249.30 (current price), next at ₹2,525.55
- **Immediate Support:** ₹2,212.50 (breakout level), then ₹1,901.50
- **52-Week High:** ₹3,387.10 (far resistance)
---
### 📊 **Volume Confirmation**
- Noticeable volume spike on the breakout candle.
- Volume > 20-period moving average volume — supports breakout strength.
---
### 🧭 **Outlook**
- **Bullish bias** in the short to medium term.
- A sustained close above ₹2,212.50 with increasing volume favors the target move toward ₹2,525+.
- If price re-tests the breakout zone and holds (₹2,212 area), it would be a healthy sign of support.
---

ICICI Bank-Aiming for Double Bottom Breakout?ICICI Bank – Technical Analysis & Trade Plan
📈 Trend Analysis:
Stock is in a strong uptrend with a higher high, higher low (HH-HL) structure intact.
Consolidating since September 2024, forming a base.
Double bottom formation visible, with a potential VCP (Volatility Contraction Pattern) at play.
Trading above key DMAs, confirming strength.
Sectoral strength: Finance & banking showing momentum and could lead the next market move.
📊 Market Context:
Broader market is showing slight improvement but still in a lower low, lower high (LL-LH) structure.
Index closed above 50 DMA, gaining some momentum, but another round of correction cannot be ruled out.
The main reason for selecting this stock is strong sector movement.
🔍 Trade Plan:
✅ Entry: Above ₹1,328
🚨 Immediate Resistance: ₹1,363
📌 Add more: If ₹1,363 is broken with strong volume
🎯 Positional Target: ₹1,555
❌ Stop Loss (SL - Closing Basis): ₹1,180.45
📉 Risk & Reward Calculation:
Risk (SL to Entry): ₹1,328 - ₹1,180.45 = ₹147.55 (~ 11.11% downside risk)
Reward (Entry to Target): ₹1,555 - ₹1,328 = ₹227 (~ 17.1% upside reward)
Risk-to-Reward Ratio (R:R): 1:1.54 (Moderate reward vs. risk)
⚠️ Risk Considerations:
Overall market still in LL-LH structure → Could just be a pullback within a broader downtrend.
Position Sizing Key:
Consider entering only 30% of the usual position size.
Gradual accumulation near ATH (All-Time High) levels is a wise approach.
📢 Disclaimer: This is not financial advice. Trading involves risk, and past performance does not guarantee future results. Always do your own research and use proper risk management .

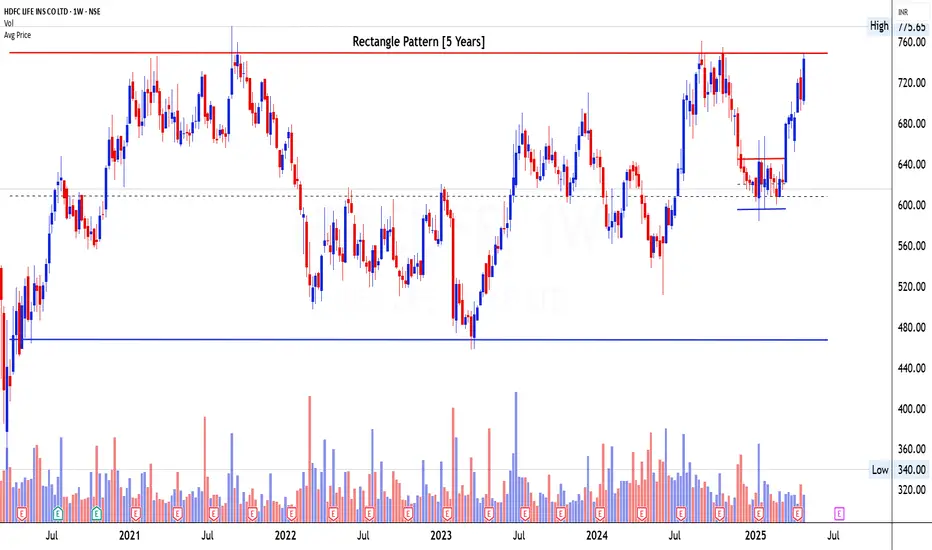
HDFC LIFE INS CO LTD – Rectangle Pattern at All TIme High
1. Pattern Analysis
The chart exhibits a Rectangle Pattern that has been developing over the last 5 years, making it a valid and high-conviction structure. The price has moved within a well-defined horizontal range, with resistance at around ₹775 and support near ₹475. This long consolidation zone indicates a prolonged phase of accumulation, where buyers and sellers have been in equilibrium. The price is currently hovering just below the upper boundary of the rectangle, and a breakout from this zone could mark the beginning of a multi-year bullish trend.
2. Volume Analysis
Volume activity throughout the pattern has remained consistent, with notable surges during rallies from the lower boundary. Recently, the stock has shown an increase in volume alongside a rally towards the resistance zone, indicating active participation from buyers. This uptick in volume is essential as the price approaches the breakout zone, hinting at potential bullish strength building up. The base volumes have not deteriorated, reflecting long-term investor interest.
3. Candlestick or Price Analysis
Recent candlestick formations are predominantly bullish, marked by strong-bodied candles with relatively small wicks, showing buying dominance. There has been a sharp move from the ₹600 level toward the current resistance, and the strength of the move suggests buyers are preparing for a test of the breakout zone. There have been no signs of exhaustion candles near the resistance so far, and price rejection from the lower boundary in early 2025 adds further strength to the bullish case.
4. Validation of Signal
Although the price is yet to conclusively break out of the ₹775 resistance level, the combination of strong volume, bullish price structure, and a 5-year-old base confirms that this is a valid bullish setup in its final stage of confirmation. A clean weekly close above ₹775 on strong volume would be the final trigger for confirmation. Until then, traders should prepare for a breakout but not pre-empt it. If the stock fails to break out and gets rejected, the pattern remains valid unless the lower end is breached.
5. Tradable Points Determination
Entry Point Determination: The optimal entry would be above ₹775 on a confirmed weekly breakout with strong volume. Pre-breakout entries can only be considered on intraday dips with small quantities for high-risk players, but conservative traders should wait for a breakout candle.
Target Point Determination: The rectangle height is approximately ₹300 (₹775 - ₹475). Upon a breakout, this height can be projected from the breakout zone, giving a medium-term target of ₹1,075. This aligns with historical volatility potential.
Stop Loss Placement and Trailing SL Follow-Up: A logical stop loss should be placed below the breakout candle or last swing low (₹720 zone) for breakout traders. Once price sustains above ₹800, traders can shift to a trailing stop-loss method, locking in profits gradually as the move unfolds. Trail based on weekly closing lows or use a 20-period EMA for medium-term trend capture.
F MEC INTERNATIONAL FINANCIAL LTD – Penny Stock- Rectangle Patte1. Pattern Analysis
The stock has formed a textbook Rectangle Pattern at All-Time High spanning approximately 1.6 years. This long-term rectangle represents a classic consolidation phase after a sharp price expansion seen earlier in 2023. The price oscillated between a strong resistance near ₹120 (marked in red) and support near ₹70 (marked in blue), establishing a broad sideways base. The current breakout from this consolidation zone, especially at all-time highs, signals a powerful continuation pattern which aligns perfectly with the principles of breakout trading around supply exhaustion at upper resistance levels.
2. Volume Analysis
Volume behavior adds strong conviction to the breakout. The recent sessions have witnessed an explosive rise in volume, particularly during the breakout candle, which closed at ₹121.05 with a 20% gain. This is a clear sign of renewed participation and accumulation after a long consolidation. Notably, volume during the sideways range remained modest and spiky but saw significant expansion right before and during the breakout, validating institutional interest and the legitimacy of the breakout.
3. Candlestick or Price Analysis
The breakout candle is a large bullish bar that closes near the high of the day and decisively clears the all-time high resistance zone. Prior to the breakout, the price showed strength with a sequence of higher lows, signaling compression against the resistance—a reliable precursor to breakout attempts. The breakout itself leaves behind no upper wick, demonstrating buyer dominance throughout the day. Additionally, price spent weeks near the upper half of the rectangle, indicating bullish bias even before the breakout occurred.
4. Validation of Signal
The pattern is now validated as a genuine breakout from a long-term rectangle. The breakout is accompanied by a significant volume surge and a clean technical structure. There was no overhead supply, given it was a breakout to fresh all-time highs, which gives this setup even more potential. The breakout confirms a shift in supply-demand dynamics and opens the door for a fresh leg higher. Any short-term pullbacks or retests of the breakout zone (₹115–₹120) can be considered healthy consolidations rather than weakness.
5. Tradable Points Determination
Entry Point Determination
The ideal entry point is either near the breakout close at ₹121.05 or on a slight retracement towards ₹115–₹118 if the price consolidates. This offers a favorable entry with lower risk.
Target Point Determination
The rectangle height is approximately ₹50 (₹120 resistance minus ₹70 support). Adding this to the breakout level at ₹120 projects a target of ₹170, which is the first logical objective. If the broader trend continues and volume sustains, extended targets can also be considered toward ₹200+ in the medium term.
Stop Loss Placement and Trailing SL Follow-Up
A protective stop loss can initially be placed below the breakout level, around ₹105. As the price sustains above ₹125 and begins the follow-through move, the stop can be trailed higher using swing lows or the 21-day EMA. A tight trailing stop loss strategy will help in capturing extended upside while managing risk proactively.

Cochin Shipyard Ltd bullish breakout -COCHINSHIP The chart of **Cochin Shipyard Ltd** shows a **bullish breakout from a consolidation zone**, with the following technical insights:
### 🔍 Key Observations:
1. **Rectangle Consolidation Breakout**:
- Price was trading in a sideways range between **₹1,180 – ₹1,520**.
- A strong breakout occurred above ₹1,520 with a close at **₹1,652.40** (▲+10.01%).
2. **Volume Confirmation**:
- Breakout is backed by **very high volume**, clearly indicated on the chart – a strong bullish sign.
3. **Target Projection**:
- Measured move from the rectangle suggests a target near **₹1,835–₹1,930** (based on 313-point range).
- Resistance zone near ₹1,730 might act as an interim hurdle.
4. **Support Zone**:
- ₹1,518.95 now turns into a support level (previous resistance).
---
### 🟢 Summary:
This is a classic **range breakout with volume confirmation**, typically signaling the beginning of a fresh uptrend. As long as the stock holds above ₹1,520, the bullish outlook remains intact.

Cochin Shipyard Ltd - Rectangle Pattern at Support1. Pattern Analysis
Cochin Shipyard is currently exhibiting signs of a strong structural setup on the daily timeframe. A broad Rectangle Formation is visible, where price has been oscillating between two key horizontal levels for the past 7 to 8 months. The lower base has consistently provided support near ₹1,200–₹1,250 levels, while the upper boundary near ₹1,700 has acted as a resistance cap for multiple attempts.
The most critical observation is that price had approached the upper resistance zone sharply in the recent sessions, indicating bullish momentum attempting to push through the rectangle's upper wall. The fact that this consolidation spans over multiple quarters makes this a high-quality accumulation pattern. A confirmed breakout above ₹1,700 can initiate a major move towards higher price targets, while failure could lead to retesting of intermediate supports.
2. Volume Analysis
Volume expansion is clearly accompanying the current move towards resistance, which is a very positive technical development. The last few trading sessions saw a significant increase in traded volumes, reaching their highest levels since the consolidation began. High volumes near resistance zones generally indicate the presence of institutional activity and smart money preparing for a breakout.
The surge in volume is not isolated; it is synchronized with bullish price candles, suggesting genuine accumulation. This is critical because a breakout accompanied by volume expansion stands a much higher probability of sustaining than a low-volume breakout. Thus, the volume behavior firmly supports the bullish thesis.
3. Candlestick / Price Analysis
Price action analysis on the daily chart reveals a series of strong bullish candles with wide bodies and minimal upper wicks, showing clear intraday dominance by buyers. However, the most recent candle shows a large volatile move, with some intraday rejection from higher levels, signaling that while bullish momentum exists, sellers are still active near the ₹1,700 zone.
Prior to this, the stock staged a clean higher low structure within the rectangle, rising sharply from the ₹1,300 support area. This strong impulsive move upward, without deep retracements, demonstrates the underlying strength and willingness of buyers to absorb supply. The large volume candles along with higher closes validate this aggressive buyer control.
4. Validation of Signal
The overall technical setup favors a bullish breakout scenario. The combination of a multi-month rectangle pattern nearing completion, supportive volume behavior, and strong price action confirms that the stock is preparing for a potential strong move.
However, the last volatile session highlights the importance of waiting for a proper breakout confirmation. A daily close decisively above ₹1,700 with sustained volumes would validate the bullish signal. In such cases, the breakout would be a high-probability trade setup backed by structure, momentum, and volume. Until then, some cautious optimism is warranted.
5. Tradable Points Determination
Entry Point Determination
The ideal entry would be on a confirmed breakout above ₹1,710 with a strong daily close backed by high volumes. Aggressive traders may pre-emptively initiate positions above ₹1,680 with strict risk management, but conservative positioning post-breakout would be safer.
Target Point Determination
The rectangle's height is approximately ₹500 (₹1,700 resistance minus ₹1,200 support). Adding this height to the breakout zone gives a primary target of ₹2,200.
Target 1: ₹1,900 (psychological round number and minor resistance)
Target 2: ₹2,200 (measured move based on pattern height)
Target 3: ₹2,450–2,500 (extended momentum targets if breakout sustains)
Stop Loss Placement and Trailing SL Follow-up
Initial stop loss should be placed below ₹1,600 or the immediate swing low once breakout happens. A trailing stop-loss strategy can be employed:
Move SL to ₹1,670 after price crosses ₹1,800.
Move SL to ₹1,750 once price crosses ₹2,000.
Keep trailing the SL higher along minor swing lows as price advances.
This dynamic approach ensures that gains are protected while allowing the trader to ride the trend for maximum reward.

GODREJAGRO – Base Breakout Attempt | Sector Tailwind📈 GODREJ AGROVET (GODREJAGRO) – Base Breakout Attempt | Sector Tailwind
🔍 Technical Overview:
Attempting a breakout from a broad base structure.
Entry: Above ₹814 only if accompanied by strong volume.
Current volume is picking up, but a decisive spike is still awaited for confirmation.
A VCP (Volatility Contraction Pattern) was forming earlier, but recent market volatility disturbed the structure — hence, wait for a clean breakout.
📊 Price Levels:
📍 Entry Trigger: ₹814+
📍 Stop Loss: ₹734.50 (around 10% risk, on closing basis)
📍 First Resistance / Target: ₹879.50 (previous ATH)
🎯 Strategy:
Position Sizing is crucial. Risk 1–1.5% of your capital depending on your style.
Gradual buying is advised. Avoid full allocation on a single entry.
Add on strength if price crosses ₹879.50 cleanly with strong volume.
🌾 Sector Outlook:
Agro / Fertilizer / Agrochem sectors are showing early strength amid broader market uncertainty.
Tailwinds include food security, rural demand, and government focus on the agri sector.
🌐 Macro View:
2025 remains highly unstable globally (geopolitical tensions, macro uncertainty).
Shakeouts and pullbacks are common — hence, disciplined risk management is imperative.
"In unstable markets, discipline is your best edge. Protect your capital, let opportunities come to you."
⚠️ Disclaimer: This analysis is for educational purposes only and not a recommendation to buy or sell. Always do your own research or consult your financial advisor before investing. Manage your risk as per your trading style.

No clear trend on the daily thoughThis is the fast-growing NSE:M&MFIN stock
This has -ve WC days
The RoCE is huge
Almost trading at Graham Value which means it's cheap

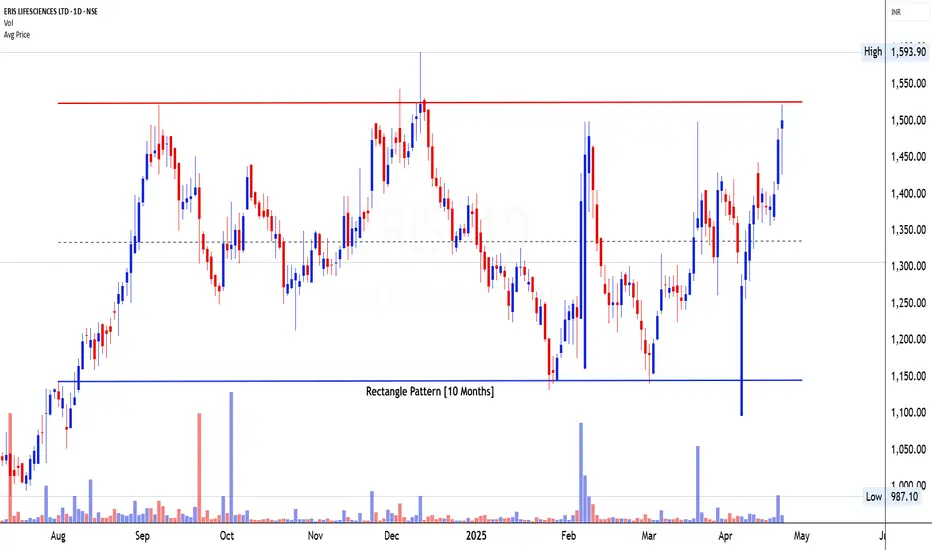
ERIS Life Science - Rectangle Pattern near All Time High1. Pattern Analysis
ERIS Lifesciences is currently presenting a compelling bullish structure through the formation of a Rectangle Pattern that has evolved over a 10-month period. This horizontal consolidation structure is formed by consistent reactions from the upper resistance zone around ₹1,510 and lower support near ₹1,130. These two parallel horizontal levels have served as critical price barriers over the past several months, indicating a phase of accumulation and range-bound action.
The price has now approached the upper boundary of the rectangle, currently testing the resistance zone. The significance of this pattern lies in its duration—10 months—which makes it a tradable setup per technical analysis standards. Once the breakout from the ₹1,510 level is confirmed with strong volume, it would mark the beginning of a fresh leg higher, signaling the end of the consolidation phase and the start of a trend continuation pattern.
2. Volume Analysis
Volume behavior over the course of the pattern formation has played a confirming role. During the earlier part of the rectangle, volume remained muted and cyclic. However, as the price approached the upper resistance in recent weeks, a noticeable surge in volume has occurred. This volume increase during the upside movements is particularly bullish, as it suggests that institutional players are beginning to participate and potentially accumulate positions ahead of a breakout.
The most recent daily candles, especially those pushing toward the ₹1,510 resistance, are supported by high volume bars. This indicates that the breakout attempt is being driven by genuine demand rather than speculative movement. Volume expansion during a resistance test is typically considered a positive sign and often precedes a successful breakout when followed by follow-through price action.
3. Candlestick / Price Analysis
The candlestick structure on the daily timeframe shows a series of strong bullish candles with wide ranges and minimal upper wicks. These candles demonstrate persistent buying strength and strong intraday follow-through. The consistent presence of bullish marubozu and long-body candles with strong closes near daily highs suggests that buyers are in firm control.
Notably, the recent price move has been sharp and vertical from the lower support of the rectangle, forming a “V-shaped recovery” within the pattern. This kind of price response typically indicates aggressive buying interest at lower levels, building toward a potential breakout above the established resistance. The price structure shows strength not just in momentum but in the conviction of buyers who are stepping in earlier in the session and holding their positions through to the close.
4. Validation of Signal
The alignment between price action, volume behavior, and candlestick structure provides a strong validation for the potential bullish breakout from the rectangle pattern. The pattern’s 10-month duration gives it weight in terms of technical reliability. With price currently less than 1% away from the resistance zone at ₹1,510, a confirmed breakout above this level—especially if supported by another strong volume spike—would signal a transition from consolidation to a new trend phase.
The lack of supply near the upper edge of the rectangle and the steep momentum behind the recent rally further strengthen the case for a breakout. If price sustains above ₹1,510 on a closing basis, it would not only complete the rectangle breakout but also create fresh bullish territory with no major overhead resistance until higher levels.
5. Tradable Points Determination
Entry Point Determination
The ideal entry point would be on a confirmed breakout above the ₹1,510 resistance level. A daily close above this zone with follow-up buying in subsequent sessions will act as confirmation. Conservative traders may wait for a retest of the breakout zone to enter, while aggressive traders can consider pre-breakout positioning above ₹1,500 with a tight stop.
Target Point Determination
Based on the height of the rectangle pattern (₹1,510 - ₹1,130 = ₹380), we derive our breakout target by adding this height to the breakout level:
Target 1: ₹1,620 – minor target for quick swing traders.
Target 2: ₹1,750 – the projected pattern breakout target based on rectangle height.
Target 3: ₹1,900 – a long-term target derived from the previous swing high region and momentum extension zone.
Stop Loss Placement and Trailing SL Follow-up
An initial stop loss should be placed just below ₹1,440, which marks the last minor consolidation zone and is close to the average price level seen within the rectangle. For position traders, a wider stop at ₹1,390 (just below the recent rally base) can be considered for higher confidence.
Once price sustains above ₹1,550–₹1,570, traders should consider trailing their stop loss higher. A logical step would be:
Move SL to ₹1,480 after the first 5% move
Then trail to ₹1,510 after price touches ₹1,620
Finally, lock in profits as the move toward ₹1,750 and ₹1,900 unfolds.
POLYCAB RANGE BREAKOUTPOLYCAB breaking a range with good volume
RSI divergence ,RSI bullish
as soon as breaks 5750
will reach to #target 6000
NO BUY/ SELL RECOMENDATION

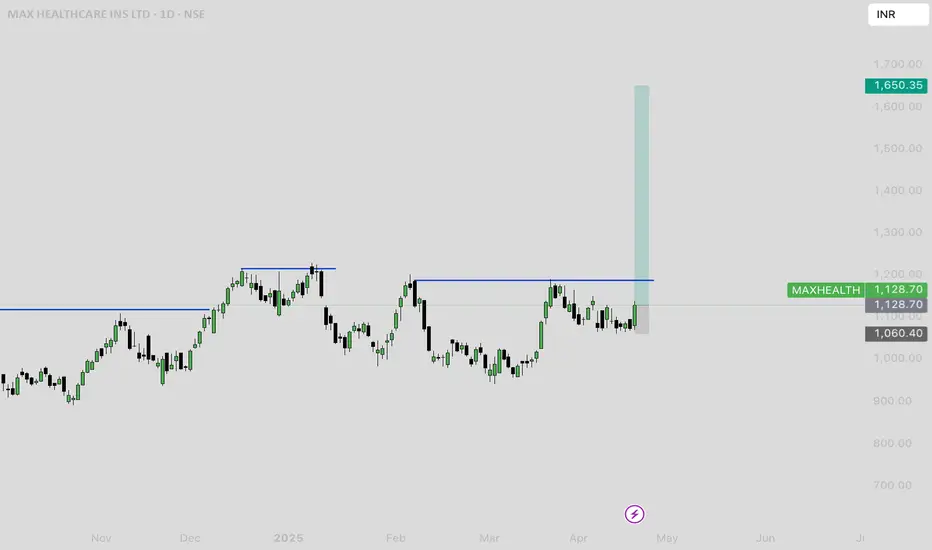
MAXHEALTH Price Chart Analysis**Current Price and Recent Performance**
- As of the latest available data, Max Healthcare Institute Ltd (MAXHEALTH) is trading around ₹1,084.40, showing a 0.64% increase in the past 24 hours
- The stock hit a high of ₹1,095.00 and a low of ₹1,066.50 in the most recent trading session, with an average traded price of ₹1,075.13
- Over the past week, the stock is down by 0.97%, but it has risen 8.23% over the past month and 30.78% over the last year
**Historical Price Levels**
- MAXHEALTH reached its all-time high of ₹1,227.95 on January 8, 2025
- The all-time low was ₹97.15, recorded on November 12, 2020
**Analyst Forecasts and Valuation**
- Analyst price targets range from a minimum of ₹615.00 to a maximum of ₹1,390.00
- The stock is trading at a price-to-earnings (PE) ratio of 100.12 and a price-to-book (PB) ratio of 12.59, which is higher than the sector averages (sector PE: 47.87, sector PB: 6.12)
- Dividend yield is low at 0.14%
**Technical and Volatility Insights**
- MAXHEALTH is 2.61 times as volatile as the Nifty index, indicating higher price swings.
- The 50-day moving average (DMA) is at ₹1,062, suggesting the current price is above this technical support level.
MAXHEALTH's valuation is high compared to peers, reflecting strong investor expectations
**Fundamental Performance**
- Revenue has grown at a compound annual rate of 27.47% over the last five years, outpacing the industry average of 10.01%
- Net profit for FY 2023-24 was ₹687 crore, with a slight decline of 1.02% compared to the previous year, despite a 22.93% rise in revenue.
- Promoter and institutional holdings have remained stable in recent quarters
**Summary**
MAXHEALTH has demonstrated robust long-term price appreciation and revenue growth, with a recent pullback from its all-time high. The stock trades at a premium valuation relative to sector peers, reflecting high growth expectations. Technicals show the stock is above key moving averages, and volatility remains elevated. Analyst targets suggest a broad range of possible outcomes, with the consensus leaning toward further upside, but caution is warranted due to the high valuation and recent profit stagnation
Breakout from RectangleThe Finance space is moving
Banks>NBFC>Financials other than those
MSME financer like this can do well in Economic upturn
With Tariffs, MSME's might do well overall
Expansion cycle and rate cuts by RBI are +ve
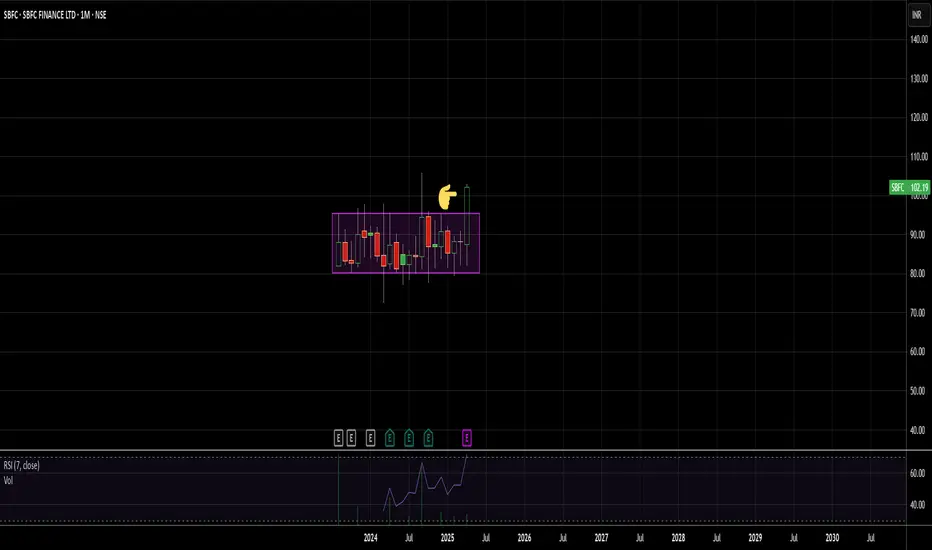
SBFC Finance Ltd – Breakout Watch (Positional Setup)🟩 SBFC Finance Ltd – Breakout Watch (Positional Setup)
📈 Price: ₹102.42 | 🏛 Market Cap: ₹10,970 Cr
🔍 Sector: NBFC | 📆 Timeframe: Daily
🧱 Structure Overview
Consolidating in a tight range since listing (Aug 2023), forming a solid base box between ₹77–₹106.
Approaching All-Time High zone (₹106.5) again.
Stock is trading above all key DMAs, showing strength relative to broader market.
📌 Entry Criteria (Breakout Plan)
🟢 Buy only on breakout above ₹106.50, if and only if:
✅ Volume spike — minimum 4x avg volume of recent sessions
✅ Wide-bodied green candle
✅ Minimal upper wick — clean breakout confirmation
✅ Broader index context supportive (Nifty above 200/50 DMA)
📊 Nifty 50 has broken out of a W-pattern; Nifty 500 yet to clear its 200 DMA — so maintain caution.
💰 Position Sizing Plan
📦 Add 30–40% of the intended quantity on breakout day if criteria are met
🌀 Add rest on retest of breakout zone (~₹106–₹108)
🎯 Targets & Stop Loss
SL: ₹95.80 (Closing basis)
🔻 Approx. 10% below breakout
Target Zone: Trail for 1:2 R:R minimum (~₹128–₹135+ depending on strength)
📊 Key Fundamentals Snapshot
Metric Value
P/E 33.8
ROE 10.5%
ROCE 10.9%
Book Value ₹27.4
Dividend Yield 0.00%
High/Low ₹114 / ₹77
➡️ Fundamentals indicate a young but stable NBFC — with scope for growth but not a deep-value play. Technicals currently lead the setup.
⚠️ Risk Management Note
Markets are recovering but not fully out of danger. Volatility can return fast. Respect SL. Avoid oversized bets. Trade only if the breakout is decisive and clean.
📌 Watchlist This Setup
Add alert above ₹106.5 with volume filter. Let the trade come to you. Patience + risk management is 🔑.
🧾 Disclaimer: This is an educational breakdown, not a stock recommendation. Please do your own research or consult a registered financial advisor before investing. 📉📈

TVSMOTORS RANGE BREAKOUTTVSMotors breaking a range weely basis
with good volume last few weeks
bullish rsi,trading above all key ema
after 2750 may reach to 2950
NO BUY/SELL RECOMENDATION

Bajaj Finserv Cup & Handle at Play! Will It Break Out?📌 Setup Overview:
Stock in a 4-year trading range 📊 and currently trading just below this range.
Cup and Handle formation ☕ along with a potential VCP setup (Volatility Contraction Pattern).
No left-side resistance—unlike stocks that fell 40-50%, there are fewer trapped buyers here.
Volume gradually increasing 📈, a necessary condition for a strong breakout.
Finance sector showing strength 💰—index is trading above key DMAs and broke out of a base first.
Stock is trading above key DMAs, adding technical confluence.
🎯 Trade Plan:
✅ Entry: Above ₹1,941 🔼
✅ Immediate Resistance: ₹2,035 (Watch Price Action at this level)
✅ Stop-Loss (SL - Closing Basis): ₹1,547.80 (20.29% below entry)
✅ Target (Tentative Positional): ₹2,510.30 🎯
📌 Risk-to-Reward (R:R) & Percentages:
SL Percentage: ~20.29%
Target Percentage (from ₹1,941): ~29.34%
R:R Ratio: 1:1.44
⚠️ Key Risks & Considerations:
1️⃣ Immediate Resistance at ₹2,035 – Monitor price action here. If rejected, wait for a re-entry after confirmation.
2️⃣ Deep Stop-Loss (~20%) – Adjust position sizing accordingly. Do not go all-in at once.
3️⃣ Market Structure: If broader markets remain weak, reassess if Bajaj Finserv is showing relative strength or struggling.
📌 Final Thoughts:
Wait for breakout confirmation above ₹1,941 with volume. 🚀
Monitor PA at ₹2,035—strong close above this strengthens the setup.
Stick to SL discipline and trail as stock moves higher.
📢 Disclaimer: This is for educational purposes only. Not financial advice. Always manage risk and do your own research before making any trades.
🚀 Trade smart & stay disciplined!

ICICIBANK RANGE BREAKOUT WEEKLYICICIBank breaking a range weekly basis
with good volume building last few weeks
trading at new ATH,RSI bullish
trading above all key ema
sizzling q4 result
#niftybank trading at ATH
NEAR #target 1470
EDUCATIONAL IDEA
