Reliance - Stuck in the ZoneWith downside support at 1270 & 1235
and upside resistance at 1300 & 13301
Reliance currently is stuck in the zone
Though trend has been broken with a force
it still needs to fill the gap created before moving ahead
Expecting it to remain sideways for a brief period of time til it breaks strong resistance or strong support
Reliancestock

Reliance Inds cmp 1267.60 by Weekly Chart viewReliance Inds cmp 1267.60 by Weekly Chart view
- Stock has formed Bearish Rounding Bottom
- Support Zone seen at 1050 to 1100 Price Band
- Support Zone 1250 to 1300 Price Band turning into Resistance Zone
- Stock might probably show more downside by the Technical Chart setup
- Weekly Basis : Support at 1195 > 1100 > 995 with Resistance at 1360 > 1445 >1535 > ATH 1608.80
- Stock Price gone well below the crossover of both the Falling Resistance Trendline and also the Rising Support Trendline been broken down

RELIANCE #RELIANCE
Daily Chart
Stock is trading near good accumulation zone
• Strong support zone technically and fibonaccically Bookmark it

Reliance - Strong support areaStock standing at strong support area
2710-2750 support zone
2900-2925 resistance zone
Stock may go sideways first then may start the journey towards upside again
wait for at least 1 HH HL of a good buying candle in this time frame recommended

Reliance Trend line breakout##Reliance at Trend line resistance in Daily Time Frame if give breakout then it can lead to upper levels & also help Nifty too.
Target will be 3044, 3111, 3155 & 3211 with Stoploss of 2955.
Thank you & Trade with proper Risk Management. Happy Trading#

Reliance Industries Ltd - Breakout OpportunityDate : 20-Aug-2024
LTP : Rs. 2,991.90
Targets: (1) Rs. 3,217 --> (2) Rs. 3,434
SL : Rs. 2,768 on daily close basis
Technical View:
• NSE:RELIANCE is in it's primary uptrend and was recently going through it's secondary downtrend.
• After touching the high of 3,217.60 on 8-Jul-2024, it has retraced 11% to 2,866.50 level.
• On 19-Aug-2024, NSE:RELIANCE has broke out from its secondary down trend with higher than average volume and closed above 20 DMA.
• On 20-Aug-2024, RSI has entered the buy zone and trading at 50.78.
• On 20-Aug-2024, MACD has crossed over it's signal line.
• Looking good to start a new swing from here.
Like the analysis? Boost/Like the idea and follow my ID.
Disclaimer : I am not a SEBI registered analyst/consultant and not recommending anyone to take any BUY or SELL position in stock market. Investing in stock market is risky and one should do a self analysis and validation before investing in stock market. My ideas are published for learning purpose only and are available to everyone at no cost/charge.

FALL EXPECTED IN RELIANCEReliance industries in trading in a channel and taking a short trend near upper channel with SL above the resistance zone has potential of giving good profits.
Sell - 2750 - 2740
SL - 2800
Targets - 2635, 2585
Please like the idea If you agree with the analysis, your like will motivate us to share more ideas on Tradingview.
Happy Trading!
InvestPro India

BUY RELIANCE @ 2395 - 2400Reliance has given a breakout of a falling trend line and sustaining above that and looking good towards marked target on the chart.
To motivate us, Please like the idea If you agree with the analysis.
Happy Trading!

Reliance chart analysis - Day time frame -> buyReliance is currently positioned at a favorable support level within an upward trend line. The stock is presently undervalued, as its trading price remains in a similar range to that of two years ago, and it has not yet surpassed its all-time high (ATH). Based on its recent price action, there is a potential for a 10% upward movement in the next two months. Additionally, with a price-to-earnings (PE) ratio of 25, the valuation of this premier stock appears to be in an attractive buying range.
It's worth noting that despite the financial demerger of Jio from Reliance, the stock has delivered relatively low ROI compared to other high-cap stocks over the past two years. With the current positive market sentiment we can hope it will break all resistance and reach new ATH

Reliance - Formation of Bullish hammer at supportNote: This is for educational purpose only. I am not SEBI registered. So please consult your Financial Advisor before investing.
There seems to be formation of bullish hammer in Reliance at support levels. Moreover, the RSI and Relative strength indicates bullish momentum as well.

RELIANCE is expected to reach 2420 in 2 hours chartAs per my analysis, Reliance reaches 2420 as per 2 hours chart.
As per Daily chart,, if the value breaks 2300, then we can expect down trend upto 1800.

RELIANCE NEAR DEMAND ZONEReliance is consolidating near it's previous demand zone @ 2300 - 2250 and looking a good buy for a bounce.
To motivate us, Please like the idea If you agree with the analysis.
Happy Trading!
InvestPro India Team

RELIANCE INTRADAY TRADE | 30TH DEC 2022Buy Reliance if sustains above 2550 for the targets of 2565 and 2580.
To motivate us, Please like the idea If you agree with the analysis.
Happy Trading!
InvestPro India Team

RELIANCE COMING IN BUY ZONEReliance gave a great move from 2500 level towards 2750 and again retracting towards demand zone, go long for marked targets on the chart until 2500 is intact on the down side.
To motivate us, Please like the idea If you agree with the analysis.
Happy Trading!
InvestPro India Team

Reliance near the trend line on 1D timeframeRELIANCE near the trend line.
There can be an entry for Intra-day traders for both long and short position.
For Swing traders, wait for the price action to be formed. Buy calls if you find a green candle breaking the trend line. First target can be 2672 ~ for swing traders and the second target can be ~2800 if the market sustains the momentum.
For Intra-day traders you can short puts if you see a red candle tomorrow or go long if the trend line breaks in 1st hour of the session tomorrow.
Cheers. Happy Trading...

Reliance Chart analysis | Result DayReliance Chart analysis
Wait for perfect time to buy / short at right time
levels provided....
Gaps we can see as well....

idea for education prepose only Stock Reliance for Shortthe Disclaimer for all is only for Education prepose only stock will show two to three day down trend side but the hit to support so u can cut or book profit on that time only it will return to uptrend is stock in bluechip stock

Reliance Chart analysisPrice & Volume relationship
----------------------------------
Daily & Weekly: Both volumes support price decline.
The RED trendline is deciding factor for reliance.
If that breaks than we will see a further downfall.

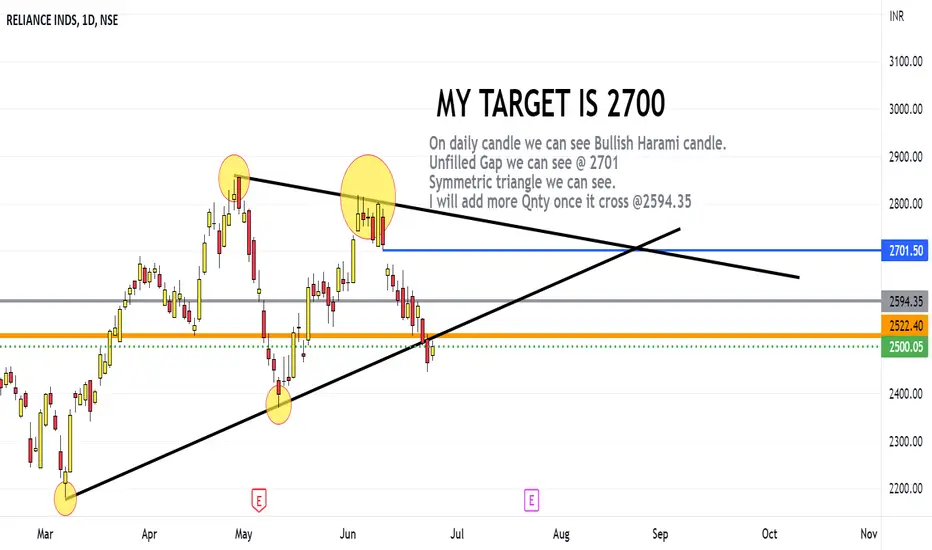
Reliance Chart analysisOn daily candle we can see Bullish Harami candle.
Unfilled Gap we can see @ 2701
Symmetric triangle we can see.
I will add more Qnty once it cross @2594.35
Reliance long Look look..... breakout plus retest... retracement pending.... upto 0.618 level... where i draw red horizontal line...

RelianceReliance at near support 2461
This is just for education don't try any trade
Without your fin.advisor......thanks

Reliance Analysis !! Broke Out📈 Reliance Industries Ltd. 📉
This broke out from a Resistance Zone of downtrending Trendline and closed above previous swing high of 2450 .
On Buy Side I am looking for Targets of 2552, 2600 and 2730.
StopLoss should be kept below 2350 zone.
It offers 1:2.5 Risk To Reward.
All Important Supports and Resistances are drawn in chart. All levels are on closing basis.
Please have a look and revert back if you need some more study on it.
Disclaimer : Consult Your Financial Advisor Before Taking Any Decision On This Analysis.

