BTCUSD | 4H | Breakout → Retest → Continuation SetupBitcoin has delivered a strong impulsive breakout from a previous consolidation range, indicating bullish strength and fresh demand entering the market.
Price is now retesting a key demand / support zone, which previously acted as resistance. This support-flip-resistance (SBR) structure increases the probability of a trend continuation move to the upside.
Technical Confluence
Higher-timeframe bullish structure intact
Strong impulsive leg → healthy pullback
Retest of prior resistance turned support
Clear risk-to-reward setup
Trade Idea
Bias: Bullish continuation
Entry: After confirmation at demand zone
Stop-loss: Below the demand / structure low
Targets: Next higher resistance / liquidity zone
As long as price holds above the reclaimed support, the bullish scenario remains valid. A clean rejection with strong candles would confirm continuation.
⚠️ This is a technical idea based on price action. Always manage risk.
Retest

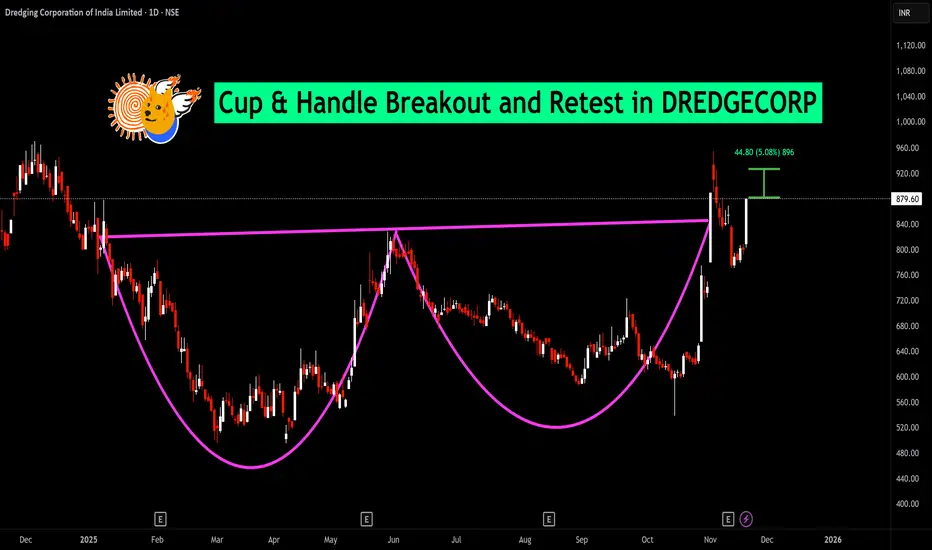
Breakout and Retest | 1000 + Soon Breakout reistance level of 950 which is now retest level of of this stock .Retest is now going good and stock is ready for four digit move and more after the new high .

BUY TODAY SELL TOMORROW for 5%DON’T HAVE TIME TO MANAGE YOUR TRADES?
- Take BTST trades at 3:25 pm every day
- Try to exit by taking 4-7% profit of each trade
- SL can also be maintained as closing below the low of the breakout candle
Now, why do I prefer BTST over swing trades? The primary reason is that I have observed that 90% of the stocks give most of the movement in just 1-2 days and the rest of the time they either consolidate or fall
Cup & Handle Breakout & Retest in ASHAPURMIN
BUY TODAY SELL TOMORROW for 5%
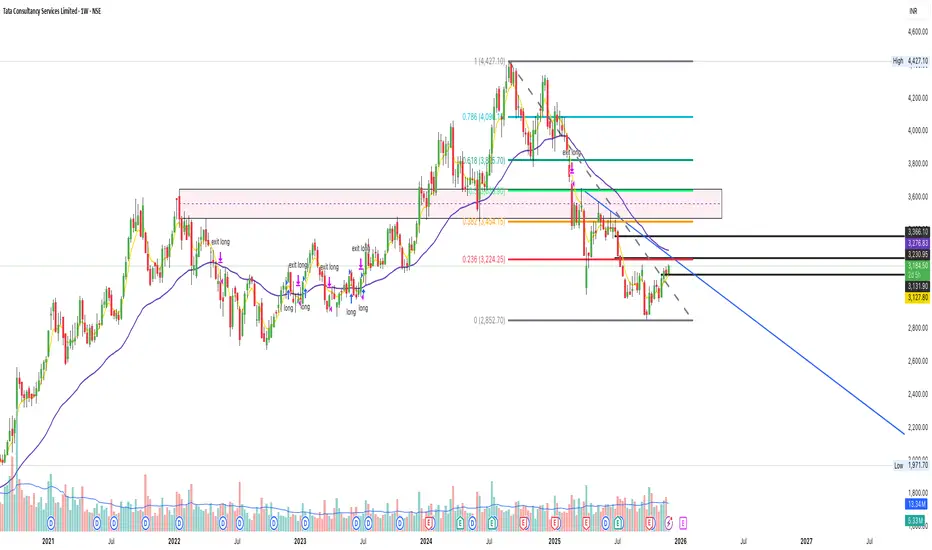
TCS Chart Update – Fibonacci + Breakout LevelsTCS – Retest Breakout Trading Setup with Price Action + Fibonacci Strategy
TCS is approaching a key breakout zone around ₹3,280. A retest entry can offer a high-probability trade setup.
How to Trade This Setup
1️⃣ Breakout Level
₹3,280 is the major resistance zone
Wait for strong breakout candle closing above ₹3,280
2️⃣ Retest Entry
📍 After breakout, price may pull back to ₹3,280–₹3,260
📍 Look for bullish rejection candle (Pin bar / Hammer / Engulfing)
👉 Entry on bullish close after retest
3️⃣ Stop-Loss (Price Action Based)
🛑 SL below ₹3,085 (strong support level)
4️⃣ Targets using Fibonacci
🎯 T1: ₹3,350
🎯 T2: ₹3,400
🎯 T3: ₹3,456 (Fib 38.2%)
Strategy Summary
Element Value
Breakout zone ₹3,280
Retest entry ₹3,280–₹3,260
SL ₹3,085
Targets ₹3,350 / ₹3,400 / ₹3,456
Direction Bullish above breakout
View
Bullish bias if price sustains above ₹3,280.
Retest entry gives the safest low-risk setup. 🚀
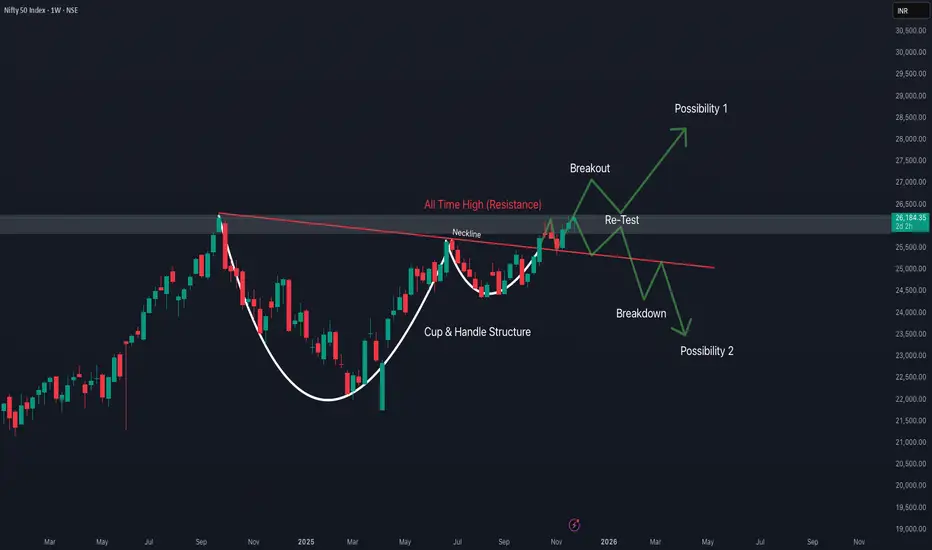
Weekly Price Action in Nifty 50The chart shows a classic Cup & Handle pattern
The cup is wide and smooth – a strong long-term accumulation pattern.
The handle is small, healthy, and formed near resistance → a sign of strength.
These patterns on the weekly chart typically lead to multi-month rallies.
The chart structure is strongly bullish unless Nifty falls below 25,500.
BITCOIN NEED BREATHE CRYPTO:BTCUSD
BTC need take relief of selling because selling is continuously happened so one little bounce is possible and that bounce works as retest of channel breakdown.
Reverse Scenario:
Formation of any bottom pattern
V shape recovery
Long consolidation after with volume brake out.
All chances is possible but there are low possibility
🧠 Always DYOR (Do Your Own Research)
⚖️ This is not financial advice or suggestion
👉 “Risk Is Real 💸 Stay Practical🚀”
💬 Please feel free to ask any questions (It's Free)

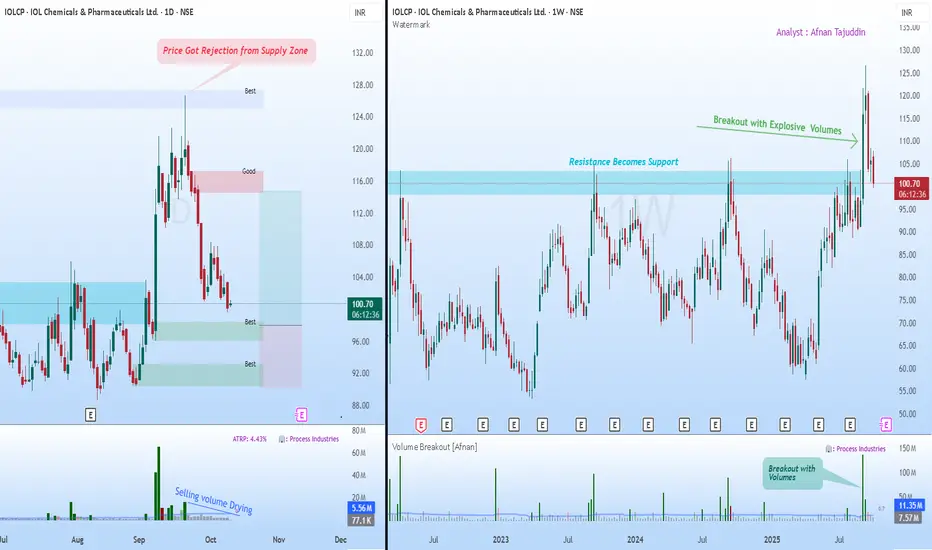
Supply & Demand Setup in IOLCP Could Signal Next Big Move📊 Supply & Demand View 📊
If you’ve been watching IOL Chemicals lately, you’ve probably noticed how cleanly it’s been respecting those key supply and demand structures. These zones aren’t random—they’re the visible fingerprints of institutions building or offloading positions in stages. When price revisits such levels, we often see sharp, almost surgical reactions.
Now, what’s catching my eye on the daily chart is the recent rejection from a supply zone. The pushback was clear, triggering a short-term decline. But here’s where it gets interesting: the selling volume has been steadily tapering off. That usually suggests the aggressive sellers are stepping aside, hinting that downside momentum could be losing steam.
Meanwhile, we’ve got multiple untested demand zones forming below—areas where buyers have shown conviction before. If price drifts into one of these regions again, I wouldn’t be surprised to see a fresh wave of institutional buying step in.
🚀 Breakout Retest View 🚀
Zooming out to the weekly chart tells a complementary story. After grinding under a major resistance for months, the stock finally broke through with explosive volume —the kind that only big money typically leaves behind. That breakout wasn’t just a blip; it reset the broader structure.
Now, the same resistance level has flipped into support—a textbook case of the law of polarity . As long as price continues to respect that zone, the larger trend remains firmly constructive.
What I find compelling is the combination of elements here: strong breakout volume, a healthy pullback, and structure alignment across timeframes. All signs point to this being a typical retest phase rather than a reversal.
✨ Final Takeaway ✨
Both charts are speaking the same language. The daily timeframe is hinting at exhaustion from sellers, while the weekly view reinforces the idea of a bullish continuation once demand reasserts itself. Should price stabilize around those lower demand zones, we could be looking at the next leg of the trend unfolding from there.
💡 Risk Management Reminder 💡
It’s easy to get carried away when the setup looks clean, but the market doesn’t owe certainty to anyone. Stick to your stop-loss, size your positions with care, and remember that discipline—more than any indicator—is what protects your capital.
“Charts reveal opportunities, but discipline secures profits.”
🔄 Stay patient, stay consistent — the market rewards preparation, not prediction. 🔄
This breakdown is shared purely for educational purposes and shouldn’t be taken as a trading or investment recommendation. I’m not a SEBI-registered analyst.
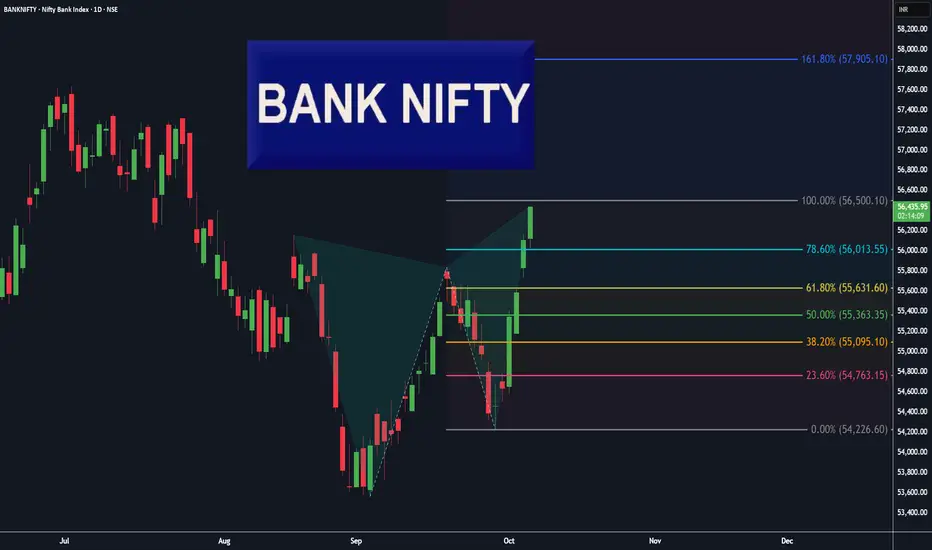
BankNifty Daily, Butterfly pattern completed!Beautiful Butterfly 🦋 pattern has completed on Daily chart of BankNifty.
Expect some profit booking or neutral trend in coming days up-to 55840 level.
Most near level is the re-test of 78.6% level ( 56013 ), for a new UP trend ( investors ).
" Buy 🟢 " above 56013 with the stop loss 🔻 of 55840, for the
🎯 Target 1: 56300
🎯 Target 2: 56500
🎯 Target 3: 57000
🎯 Target 4: open.
" Sell 🔴 " below 55631with the stop loss 🔺 of 55843, for the
🎯 Target 1: 55363
🎯 Target 2: 55095
🎯 Target 3: 54763
🎯 Target 4: open.
Smart Levels is Smart Trading. 👨🎓
⚠ RISK DISCLAIMER :
All content provided by "TradeWithKeshhav" is for information & educational purposes only.
It does not constitute any financial advice or a solicitation to buy or sell any securities of any type. All investments / trading involve risks. Past performance does not guarantee future results / returns.
Always do your own analysis before taking any trade.
Regards :
@TradeWithKeshhav & team
Happy Trading and Investing!
Nifty 50 Daily, Trend Based Fibonacci Extension (Natural levels)Hey Traders, I hope you all are doing well in your life.
Market is nature's response and Price is the God.
Let's check the market with the help of natural levels tool : Trend Based Fibonacci Extension .
After forming a ' W ' pattern on Daily chart, Nifty50 has given a pull-back ( base for Fib-Extension level tool, 24587 ).
Most near level is the re-test of 38.2% level ( 24980 ), for a new UP trend ( investors ).
" Buy 🟢 " above 25110 with the stop loss 🔻 of 24980, for the
🎯 Target 1: 25402
🎯 Target 2: 25650
🎯 Target 3: 26260
🎯 Target 4: 26500.
" Sell 🔴 " below 24960 with the stop loss 🔺 of 25110, for the
🎯 Target 1: 24880
🎯 Target 2: 24780
🎯 Target 3: 24680
🎯 Target 4: 24500.
Smart Levels is Smart Trading. 👨🎓
⚠ RISK DISCLAIMER :
All content provided by "TradeWithKeshhav" is for information & educational purposes only.
It does not constitute any financial advice or a solicitation to buy or sell any securities of any type. All investments / trading involve risks. Past performance does not guarantee future results / returns.
Always do your own analysis before taking any trade.
Regards :
@TradeWithKeshhav & team
Happy Trading and Investing!

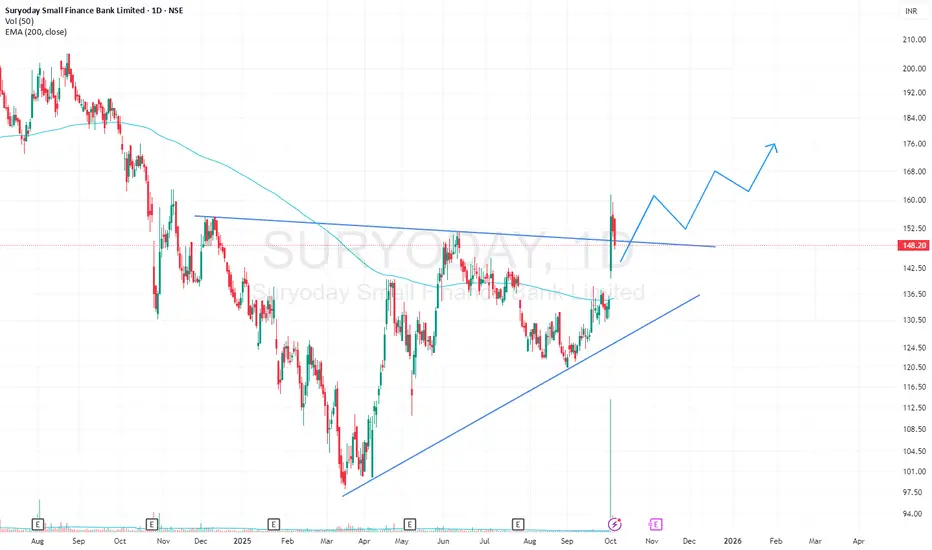
SURYODAY SFB Triangle BreakOutSuryoday SFB has given a breakout from a Triangle pattern with high volumes on 1D timeframe. The stock is apparently retesting its resistance trendline. The stock is also trading above its 200EMA.
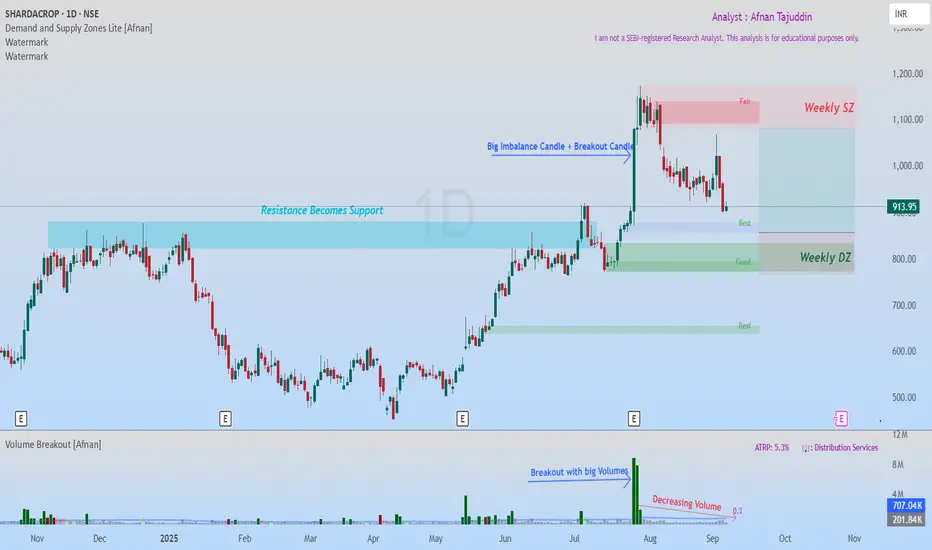
SHARDACROP: Smart Money Demand Zones Align with Classic BreakoutI've been tracking SHARDACROP, and what I'm seeing is honestly one of those setups that doesn't come around too often. There's something brewing here that caught my attention—and it's not just one signal, but two completely different analytical approaches pointing to the exact same conclusion.
Today, I'm breaking down this chart using the modern supply & demand approach that tracks institutional footprints, and the classic technical analysis. When these two methodologies start singing the same tune? That's when you know it's time to pay attention.
What makes this SHARDACROP setup special? Both methods are screaming the same message. And in my experience, that's usually when the big moves happen.
💡 Supply & Demand Analysis - Reading the Smart Money Trail 💡
Let's start with the supply and demand zones. Think of these as crime scenes—they're where the big players left their fingerprints. These aren't random levels; they're areas where massive institutional orders are sitting, waiting to be filled.
🎯 How the Big Players Play 🎯
Here's what most retail traders don't get: when institutions want to buy or sell millions of dollars worth of stock, they can't just hit the market buy button like we do. They'd move the price against themselves instantly. Instead, they layer in orders over time, creating these demand and supply zones.
So when price comes back to test a demand zone, we're betting that the same smart money players who were buying there before still have unfilled orders waiting. It's like they've set a trap—and price is walking right into it.
🔥 What Jumped Out at Me with SHARDACROP 🔥
Solid Weekly Foundation : There's a weekly demand zone that's been acting like a fortress
Stacked Daily Zones : Inside that weekly zone, we've got 1 daily demand zone and another demand zone is latest layered on top of each other.
Leg-out Candle Signature : That leg-out candle? Breaking to new highs, Pure smart money. The size of that imbalance tells me this wasn't retail traders getting excited
📈 The Setup That's Unfolding 📈
Now here's where it gets interesting. Price is drifting back toward our demand zone, and everything's lining up perfectly:
Entry Sweet Spot : Right within that established demand zone
Clean Risk Level : Stop goes below the zone—simple
Clear Target Path : Measured move up to the next supply zone
What I love about this risk-reward setup is the clean path to our 1:2.5 target. There's no major supply zone standing in our way, and the weekly trend is up.
⚡ Traditional Technical Analysis ⚡
Now let's flip the script and look at this through classic technical analysis. And you know what? The story gets even better.
🏗️ The Resistance That Finally Cracked 🏗️
This chart's telling a story I've seen a thousand times, but it never gets old:
The Struggle Phase : Price kept banging its head against the same resistance level, over and over
The Explosion : When it finally broke, it didn't just break—it demolished that level with a massive candle and huge volume
Volume Don't Lie : That breakout volume spike? That's confirmation the move was real
The Polarity Play : Now that old resistance is getting ready to flip into support—textbook price action
📊 Volume Tells the Real Story 📊
What really caught my eye is how volume's behaving on this pullback. As price drifts down toward our support zone, volume's drying up. That's not weakness—that's actually bullish. It means the selling pressure is fading, and when volume contracts like this during a retest, it often sets the stage for the next leg higher.
🎯 When Two Worlds Collide - The Confluence Magic 🎯
Here's where things get really exciting. I'm not just seeing one good setup—I'm seeing two completely different analytical methods pointing to the exact same opportunity:
Supply & Demand Says : Smart money demand zone with layered institutional support
Technical Analysis Says : Classic breakout retest with polarity support and volume confirmation
The Bottom Line : Both methods identify the same zone as the high-probability entry point
When this happens, I call it a "confluence setup." It's like having two different GPS systems both telling you to take the same route—you can be pretty confident you're heading in the right direction.
🌟 Putting It All Together 🌟
SHARDACROP's showing me: institutional footprints perfectly aligned with classic technical patterns. The Multiple Timeframe demand zones, the breakout retest setup, the volume behavior—it's all coming together in a way that makes me sit up and take notice.
But remember, even the best setups can fail. The market doesn't owe us anything, and it certainly doesn't care how confident we are. Trade smart, manage risk, and let the probabilities work in your favor over time.
💪 "The best traders aren't the ones who are right the most—they're the ones who make the most when they're right and lose the least when they're wrong." 📈
Disclaimer: This analysis is purely for educational purposes and isn't meant as trading or investment advice. I'm not a SEBI registered analyst. Always consult with qualified financial advisors before making investment decisions.
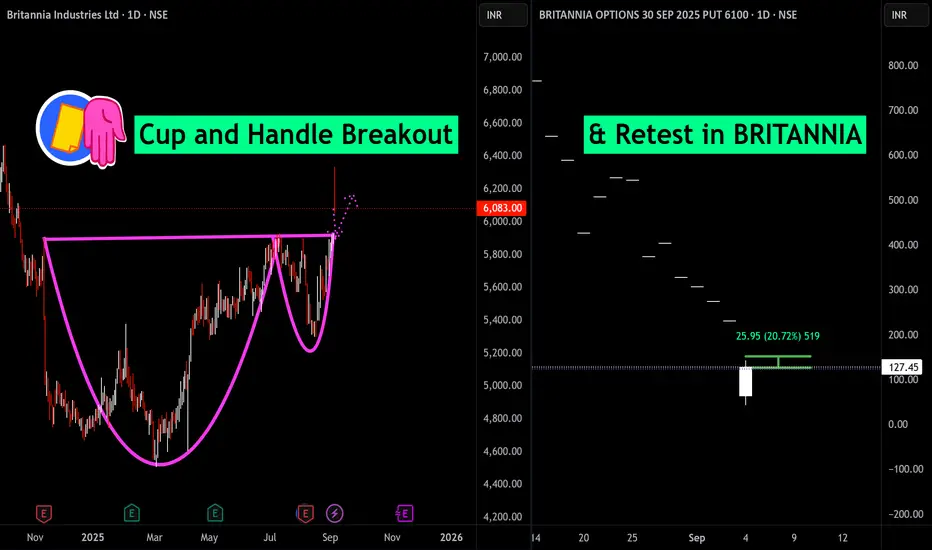
Cup and Handle Breakout & Retest in BRITANNIABritannia Industries has delivered a textbook Cup and Handle breakout on its daily chart, signaling renewed bullish momentum and the potential for higher highs ahead. After months of base-building, the stock surged above the key resistance level near ₹6,083, confirming the breakout with strong volume and a sharp price spike. This technical pattern often foreshadows continued upward movement, as buyers regain control following consolidation.
On the right, the Britannia 6100 September PUT option chart highlights a significant retest, with the PUT price dropping over 44% today, indicating strong bullish sentiment in the underlying stock. The sharp drop in the PUT’s value reinforces the breakout’s validity, since a falling PUT price typically aligns with rising equity prices.
Overall, Britannia’s decisive close above resistance and the synchronized retreat in bearish option premiums underscore an emerging uptrend. Traders may watch for continuation above ₹6,083 while managing risk near the breakout level.
B
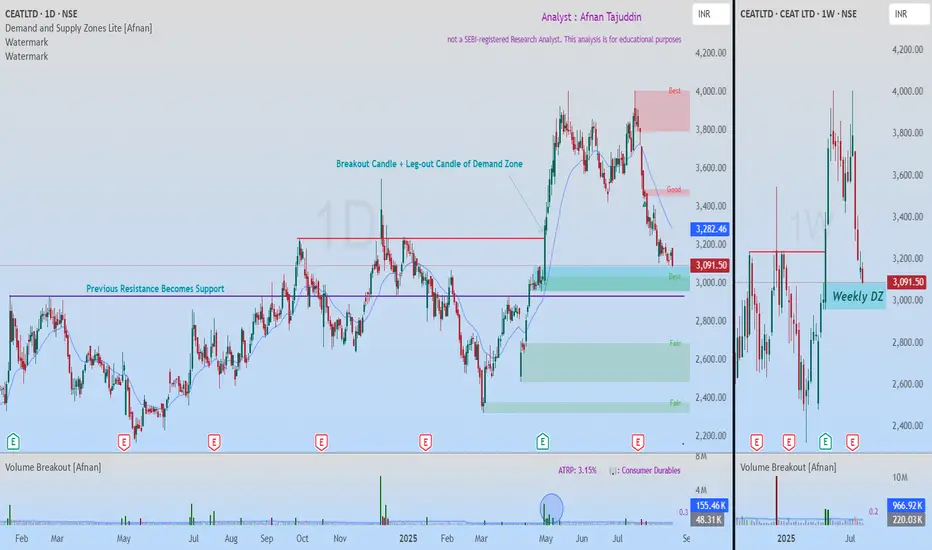
Smart Money Footprint Visible: Ceat Testing Powerful Demand ZoneBack on 24th July , I shared an idea on Ceat. That call didn’t play out and the Stop Loss (SL) got hit . No surprises there—SLs are simply the cost of doing business in this market. hitting SL is part of trading . The key is discipline – once SL is hit, we must exit without hesitation.
Now, Ceat seems to be offering us another opportunity . Let’s break it down.
📊 Why This Demand Zone Stands Out
The stock is approaching a very strong demand zone visible clearly on the weekly & Daily timeframe .
The leg-out candle that created this demand zone was powerful – it broke past previous resistance with a strong bullish move .
Follow-through from that breakout candle even took the stock to all-time highs . This tells us it’s not just an ordinary zone but one with institutional footprints.
Institutions often leave behind pending buy orders in such zones, or they may look to accumulate more here to defend their earlier positions.
This level first acted as resistance , then flipped into support —a classic price-action rotation.
📉 Volume Behavior 📉
On the breakout candle, volume was massive. But now, as price is pulling back, we can see volume exhaustion . To me, that signals a lack of real selling pressure. When supply dries up, it leaves the door open for demand to kick back in.
🔎 Confluences Adding Strength 🔎
Weekly demand zone lining up with a daily demand zone .
Traditional support level overlapping at the same price area.
Volume analysis confirming lack of strong selling.
🎯 Trading Plan 🎯
SL should be placed just below the support level to manage risk.
First target should be the nearest supply zone .
Till first target, the Risk-to-Reward (RR) ratio is about 1:3 , which makes it attractive.
If SL gets hit, simply exit the trade . No second thoughts.
What I find compelling here is the overlap: weekly demand, daily demand, and a long-tested support line all converging. That kind of alignment doesn’t come around every day. The probability of a bounce looks strong—but at the end of the day, risk management is what separates setups from disasters .
“Trading is not about being right every time. It’s about managing risk smartly and surviving long enough to catch the big moves.”
💡 The market will always offer another opportunity—our job is to stay disciplined, manage risk, and be ready when it comes. 🚀📈
⚠️ This analysis is purely for educational purposes only and is not a trading or investment recommendation . I am not a SEBI registered analyst .
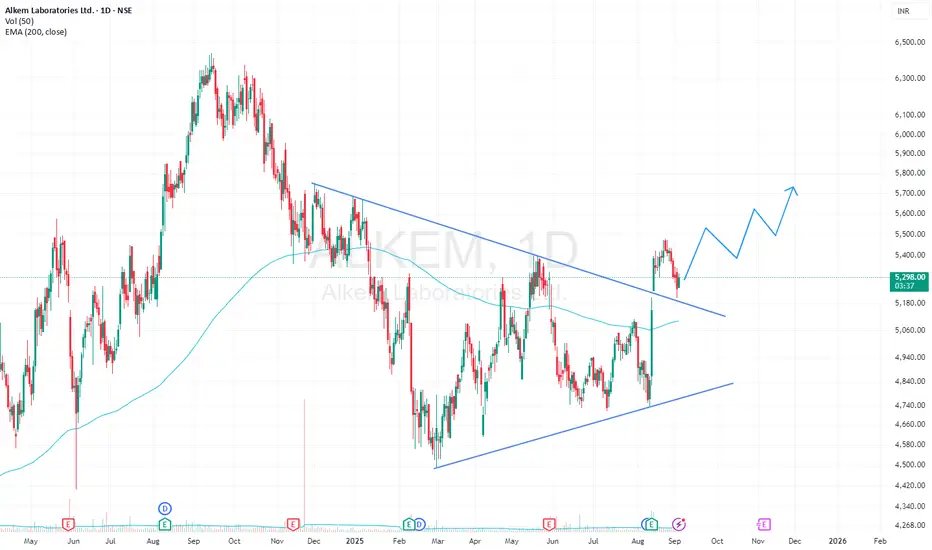
ALKEM Triangle BreakOutAlkem labs has given a breakout from Triangle pattern on 1D timeframe with high volumes. It is apparently retesting the resistance trendline. The stock is also trading above its 200 EMA.
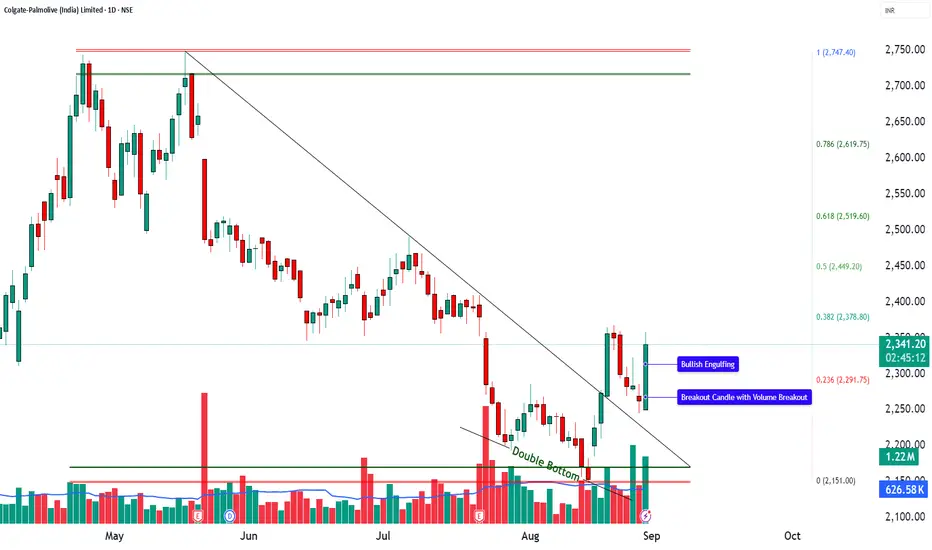
COLPAL | Double Bottom Retest + Volume Breakout🚀 COLPAL | Double Bottom Retest + Volume Breakout
📌 Pattern Setup:
🔹 Double Bottom retest spotted
🔹 Bullish Engulfing candle at support
🔹 Breakout candle with strong volume surge
📊 Technical Snapshot:
RSI: 58 → Healthy momentum
MACD: Bullish crossover
CCI: 107 → Strong positive bias
Stochastic: 89 → Overbought but strong
Volume: 1.22M vs 626k avg → ⚡ Breakout confirmed
🛠 Levels to Watch:
🔼 Long Entry: Above 2357.9
🔽 Stoploss: Below 2243
🎯 Targets: 2472 | 2587
📉 Pullback Buy Zone: 2291–2273
❌ Invalidation: Below 2207
⚡ Resistance Levels: 2382 | 2424 | 2490
⚡ Support Levels: 2274 | 2208 | 2167
🎯 Fibonacci Zones: 2378 → 2449 → 2519 → 2619 → 2747
💡 View:
COLPAL is breaking out from a Double Bottom Retest with strong volume & bullish signals. Sustaining above 2358 could open the gates towards 2472 – 2587 in the short term.
👉 Bias: Bullish till 2207 holds.
⚠️ Disclaimer – Please Read Carefully
The information shared here is meant purely for learning and awareness. It is not a buy or sell recommendation and should not be taken as investment advice. I am not a SEBI-registered investment advisor, and all views expressed are based on personal study, chart patterns, and publicly available market data.
Trading — whether in stocks or options — carries risk. Markets can move unexpectedly, and losses can sometimes exceed the money you have invested. Past performance or past setups do not guarantee future results.
If you are a beginner, treat this as a guide to understand how the market works — practice on paper trades before risking real money. If you are experienced, always assess your own risk, position sizing, and strategy suitability before entering trades.
Consult a SEBI-registered financial advisor before making any real trading decision. By engaging with this content, you acknowledge full responsibility for your trades and investments.
💬 Found this useful?
🔼 Give this post a Boost to help more traders discover clean, structured learning.
✍️ Drop your thoughts, questions, or setups in the comments — let’s grow together!
🔁 Share with fellow traders and beginners to spread awareness.
👉 “If you liked this breakdown, follow for more clean, structured setups with discipline at the core.”
🚀 Stay Calm. Stay Clean. Trade With Patience.
Trade Smart | Learn Zones | Be Self-Reliant 📊
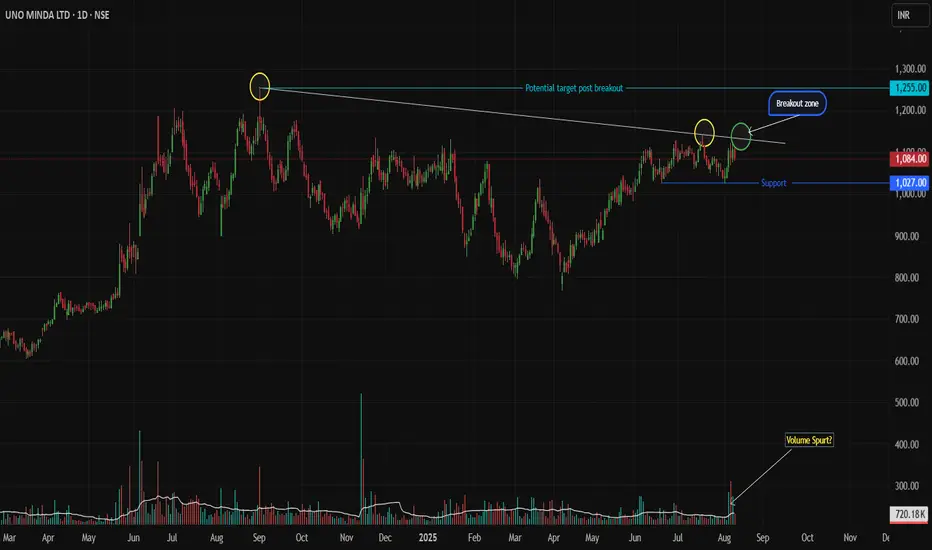
Uno Minda: Triple Trendline Test - Breakout or Pullback Setup Uno Minda Price Action Setup
(Daily Timeframe | Pure Price Action + Volume)
Key Structure
Resistance Trendline: Tested twice (02-Sep-2024 & 17-Jul-2025). Price now approaches it for the 3rd attempt.
Support Zone: Strong base at 1027 (recent swing low).
Long-Term Trend: Bullish (higher highs/lows).
Trade Scenarios
SCENARIO 1 : Trendline Breakout
Trigger:
Daily breakout candle closes above the resistance trendline.
Candle must be strong bullish (full-bodied green) with volume > 20-day average.
Entry: On confirmation of breakout (next candle open/close above breakout candle’s high).
Stop Loss: Low of the breakout candle.
Targets:
First: 1255 (take partial profits).
Trail balance with trailing SL (e.g., below recent swing lows).
SCENARIO 2 : Pullback to Support
Trigger:
Price retests 1027 support, followed by a strong bullish reversal candle (e.g., Bullish Engulfing/Hammer) with rising volume.
Entry: After reversal candle closes (confirmation).
Stop Loss: Below the low of the reversal candle.
Targets:
First: 1130 (take partial profits).
Trail balance aggressively.
Risk Management
Position Size: Risk ≤ 1% capital per trade.
Avoid chasing: Enter only on confirmed triggers.
Invalidation: Exit if price closes below SL levels.
Disclaimer
This idea is educational only. Not financial advice. Trading carries high risk. Past performance doesn’t guarantee future results. Always test strategies in a demo account. Consult a financial advisor before trading.
Boost 👍 if helpful! Comment below for other stocks you want analyzed.
Keep it price-driven. Trade safe! 💡
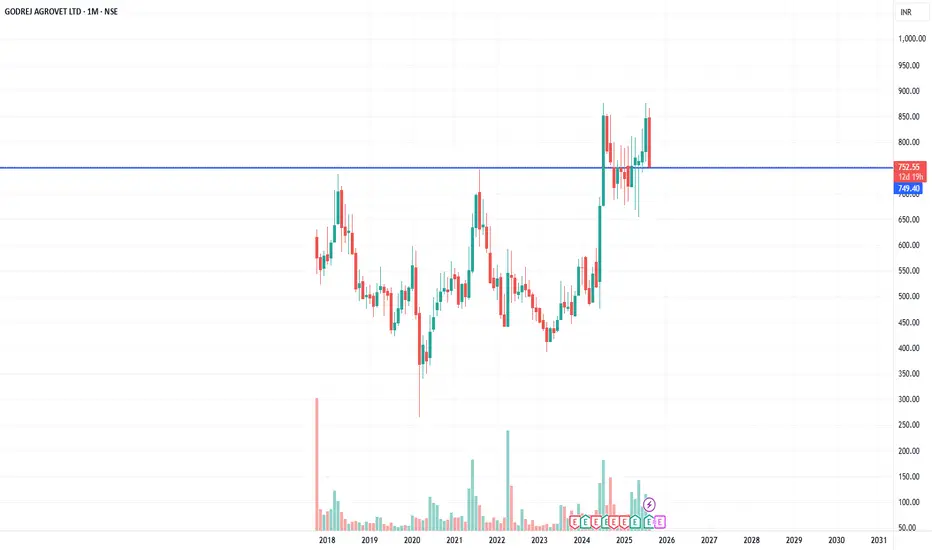
GODREJ AGROVATE RETEST ON MONTHLY CHARTChart looks good on the bigger time frame. Support is at 700 on a monthly closing basis.
CMP: 752
Support: 700
This is for educational purposes only. Please seek advice from your financial advisor before making any trade decisions. This is not a recommendation.
Stock Showdown Saturday: Can You Spot the Trade?Disclaimer:
The chart used in this video is from May 2023 (over 3 months old). It is shown only for educational purposes, to demonstrate strategy-building ideas and share trading experience. This is not financial advice and should not be considered as a recommendation to buy, sell, or skip any stock. Always do your own research before making trading decisions.

My Simple Theory on how to approach any ENTRY with examples I make educational content videos for swing / positional trading

ABCapital’s Daily Retest: Bullish Bounce IncomingOn the Daily timeframe, price is revisiting the ₹244–₹248 zone, which had capped rallies three times before the breakout on 17 June 2025. After carving out a classic rounding bottom, ABCapital surged—now it’s offering a second chance to enter:
- Zone to Watch: ₹244–₹248 (prior resistance → new support)
- Timeframe: Daily
- Trend: Strongly bullish in both short and long term
- Upcoming Catalyst: Q2FY26 earnings on 4 August 2025
- Entry Strategy:
1. Look for bullish price action (pin‑bar, bullish engulfing, etc.) on daily candles
2. Verify with a volume pickup on the bounce before initiating a long 👍
Why It Works
- Daily retests of former resistance zones often lead to reliable bounces
- Rounding bottom reflects deep accumulation by smart money
- Daily trend remains intact until broken with conviction
Risk Management
• Stop‑loss just below ₹242
• Trail stops higher as price confirms strength
Targets
- Short‑term: ₹260
- Long‑term: ₹280+ and keep trailing.
🚀 A textbook daily‑timeframe retest in a powerful uptrend—perfect for fresh entries or scaling in.
Disclaimer: This is not financial advice. Conduct your own due diligence and manage risk prudently.
If this resonates, 👍 Boost, 💬 Comment, and 📝 Share your take!
❓ Got another stock in mind? Feel free to ask me which ticker you’d like analyzed next!
Ask ChatGPT

Deepak Fertilizers - Cup and Handle ContinuationAs you all can see there is a beautiful cup followed by a handle on the Weekly timeframe.
After the pattern broke out, the stock managed the market sell off pretty well by retesting its previous supply zone (now demand zone) and maintained the sideways trend without spoiling the pattern.
This sudden surge implies that the stock is ready to continue its uptrend.
Talking about fundamentals:
- High Management Efficiency with a high ROCE of 17.10%
- The company has a high Debt to EBITDA ratio of 1.88 times
- Healthy long term growth as Operating profit has grown by an annual rate 40.09%
- Positive results in Dec 24
- OPERATING PROFIT TO INTEREST(Q) Highest at 4.94 times
- NET SALES(HY) At Rs 5,325.74 cr has Grown at 24.53 %
- DEBT-EQUITY RATIO(HY) Lowest at 0.67 times
- With ROCE of 14.4, it has a Fair valuation with a 1.9 Enterprise value to Capital Employed
- The stock is trading at a discount compared to its average historical valuations
- Over the past year, while the stock has generated a return of 106.57%, its profits have risen by 0.5%
- High Institutional Holdings at 20.38%. Their stake has increased by 0.7% over the previous quarter.

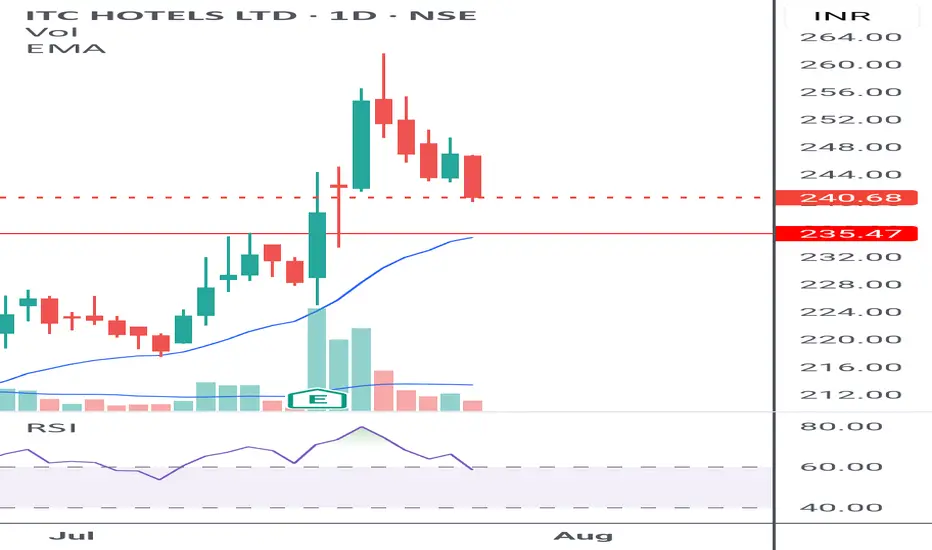
ITCHOTELS at attractive levels, retest ITCHOTELS is retesting the break out level. The results are over and hence no volatility expected.
Currently at attractive risk reward level. View invalid if it closes below 230
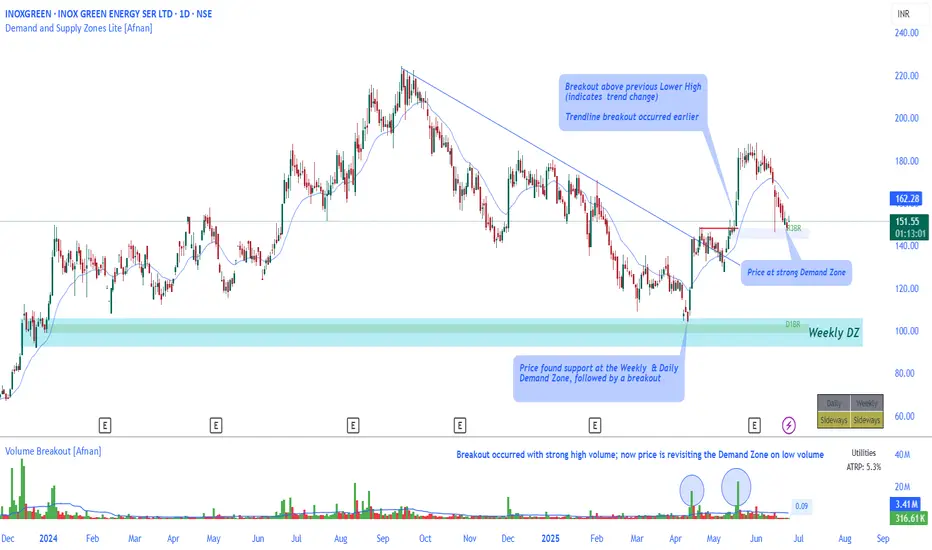
Demand Zone Retest After Breakout – Healthy Pullback NSE:INOXGREEN has been quietly setting up an interesting structure on the daily chart — one that could catch the attention of traders who follow clean trend reversals and demand zone dynamics.
The recent action is about patience and structure — the kind of move that often builds the foundation for the next big move.
📊 What’s Happening on the Chart?
Trendline Breakout: After months of trending lower, price finally broke above its falling trendline — a signal that sellers were starting to lose control.
Structure Shift: Not long after the trendline breakout, price took out a key lower high. That’s your textbook sign of a potential trend change from bearish to bullish.
Support Found at Demand: Before all this, the stock found solid footing at a strong Weekly + Daily Demand Zone — a level where buyers stepped in with confidence.
Now Back to Demand (But Quietly): After the breakout, price is now calmly pulling back into a nearby demand zone — and it’s doing so on low volume. That’s typically a good thing; it shows there’s no panic selling, just a quiet retracement.
🧠 Why This Matters
This kind of setup often catches traders off guard. The breakout already happened, the volume confirmed it — but now the market is “retesting” the move, checking if the breakout is for real.
Here’s why this zone is worth watching:
Pullbacks on low volume into demand are often healthy — it means sellers aren't in control.
If buyers show up again, especially with a bounce or bullish candle, it could confirm the next move higher.
As long as this demand zone holds, the larger structure stays positive.
🔍 My Closing Take
It’s easy to get caught up in the breakout hype, but sometimes the real opportunity is in the retest — when most people stop watching. If this zone holds and price starts moving with momentum again, it could be a sign of strength returning.
🔥 "Patience and preparation turn market uncertainty into opportunity." 🔥
This analysis is shared for educational purposes only and is not a trading or investment recommendation , as I am not a SEBI registered Analyst.