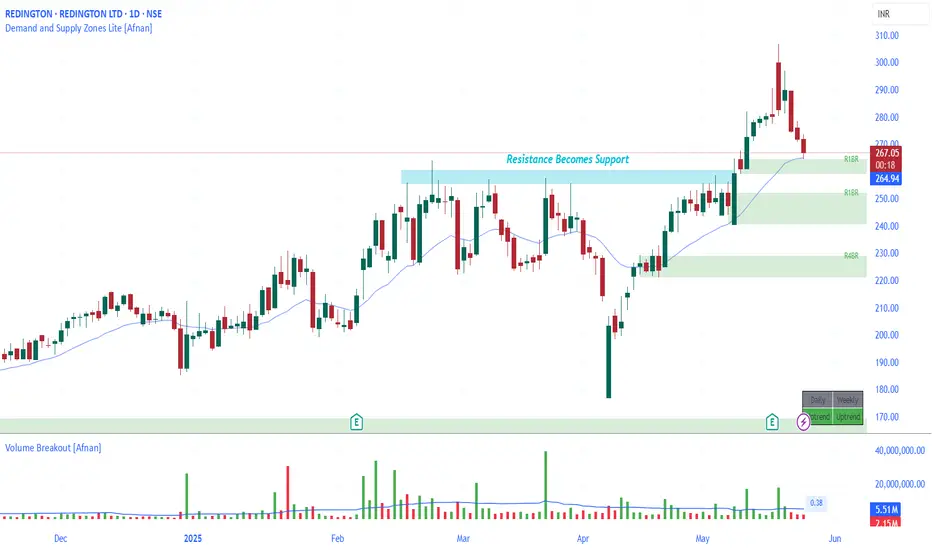
Strong Confluence Setup : REDINGTON at Crucial Demand Zone
REDINGTON is showing signs of a promising technical setup — something that can catch the attention of demand and supply zone traders. Let’s break down the analysis in simple words so that even a beginner can understand why this stock might be at an interesting level.
🔥 The Demand Zone Setup 🔥
The stock is currently hovering around a Rally-Base-Rally demand zone. This is a price area where big institutions may have left pending buy orders before pushing the price higher.
📉 Confluence of EMA and Support Flip
Here’s where the setup gets even more interesting. Apart from the demand zone:
REDINGTON is trading near its 20 EMA — a dynamic support level that often helps price bounce in uptrends.
There was a recent resistance breakout — price struggled to go above a certain level, broke through it with heavy volume, and is now returning to retest that same level.
Resistance turns into support : This classic law of polarity increases the odds of a bounce from here.
💡 Volume Analysis Matters
The breakout candle had heavy volume. Now, as the price pulls back to the demand zone, volume is dropping — this is a healthy sign. It suggests the sellers are weakening and the buyers might soon step in again.
👣 Smart Money Footprints & Pending Orders
Demand zones reflect unfilled institutional orders. If smart money had previously bought here, they may defend this zone to protect their positions. That could mean more buying at this level, pushing the price higher once again.
⚠️ But Wait — Risk Management is Key!
Even high-probability setups can fail — and that’s just the nature of trading. Always use a stop-loss. The goal isn’t to be right all the time — it’s to manage risk smartly and survive long enough to be consistently profitable.
📊 Setup Summary
Price near RBR demand zone Strong case for smart money entry
Confluence of 20 EMA support
Polarity principle : Resistance turned into support
Volume drop on pullback — bullish signal
Always place stop-loss — risk management matters
📌 "In trading, confidence comes from preparation — not prediction."
Lastly, Thank you for your support, your likes & comments. Feel free to ask if you have questions.
⚡ Stay focused, trade smart, and let the charts do the talking! ⚡
This analysis is for educational purposes only and is not intended as a trading or investment recommendation. I am not a SEBI registered analyst.
Retest
Reliance making head and shoulder n 15min timeframe.Reliance making head and shoulder n 15min timeframe. With a target of +1.5%
Stock retested its neckline today.
T1- 1460
T2- 1480
Stop loss : 1425

Muthoot Microfin LTD – Major Breakout in Play!🟦 Blue Line: 200 DEMA
Still overhead, but the recent price action indicates a potential shift in trend. Price reclaiming above this zone will be another bullish confirmation.
📌 Breakout Highlights:
Counter Trendline Breakout: Price shattered the CT-based trendline with high volume.
W-Bottom Formation: A textbook double bottom structure is visible with neckline breakout.
Green Path: Illustrates the bullish trajectory already played out post breakout.
Red Zone: Key resistance turned support — now a potential demand zone on retest.
Yellow Path: A healthy retest scenario could play out, offering better R:R entries. A pullback to the neckline before continuation would be ideal.
🔔 Keep it on your radar — structure, volume, and trend all align for a bullish bias.

OPTIEMUS: A Powerful Demand Zone with Breakout Retest ConfluenceNSE:OPTIEMUS is setting up for something very interesting — both from a traditional technical perspective and through the lens of the supply and demand concept. If you're a trader who loves high confluence zones and clean structures, this analysis is definitely worth your attention!
Let’s break it down in a step-by-step, top-down format.
🔥 Weekly Chart Analysis – The Bigger Picture 🔥
When we zoom out to the weekly chart, something really striking stands out. The stock was in a tight consolidation phase for nearly 3 years. During this period, volume was consistently high — an early sign that big players were possibly accumulating.
Then came the breakout — massive volumes , strong momentum, and a sharp move to the upside. This rally gave exceptional returns to early entrants. But as expected, after such a move, the price pulled back.
Here’s where it gets exciting: the stock has now returned to the very same zone it broke out from. This level acted as a strong resistance multiple times in the past. And according to the Law of Polarity , a broken resistance often flips to become a strong support.
Not only is the price back to that breakout level, but it's also doing so with very low volume — a classic indication of a healthy retest rather than panic selling.
🧠 Supply and Demand Concept – Strong Confluence Zone 🧠
Now let's apply the demand and supply perspective — and this is where the setup gets really juicy.
A fresh and powerful weekly demand zone has formed exactly where the breakout took place. This zone has a clear imbalance — a strong leg-out candle with strong follow through. It’s a textbook demand zone with high conviction .
Even better, this demand zone is sitting right on the old resistance (now support) level — giving us double confluence .
And guess what? There is no supply zone visible on the weekly timeframe above the current price. That means the sky is clear — the price has room to fly, if it starts moving up from here.
🔎 Daily Chart Analysis – Zooming Into the Details 🔎
Moving down to the daily timeframe, we find even more reason to stay excited.
There’s a daily demand zone nested inside the weekly demand zone — a perfect case of multi-timeframe confluence . While this daily zone has been tested once, the follow-through was strong, indicating buyers are still active.
There is a nearby supply zone on the daily chart, but it’s already been tested. The next significant supply zone is about 42% above the current market price, while the risk to the distal line of the demand zone is just 9% .
That gives us a very attractive Risk to Reward ratio of 1:4.5 — which is highly valuable in technical setups.
📊 Key Technical Highlights
Weekly breakout retest with low volume pullback
Strong weekly demand zone with strong follow through
Demand zone formed at previous resistance – high confluence
No supply zone on weekly – open upside
Daily demand zone inside weekly – excellent multi-timeframe setup
Nearby tested supply on daily, next fresh supply 42% away
Risk to Reward ratio: 1:4.5
⚠️ Risk Management Reminder ⚠️
Even though this is a high-conviction setup, remember: no setup is guaranteed . Always use proper risk management, stop-loss strategies, and position sizing. Protect your capital — it's your trading ammo.
✨ Final Thoughts ✨
This NSE:OPTIEMUS chart is a great learning opportunity for anyone studying supply and demand or traditional breakout structures. Whether you’re new or experienced, setups like these reinforce the value of patience and technical clarity.
Lastly, Thank you for your support, your likes & comments. Feel free to ask if you have questions.
💡 "The market rewards those who wait patiently with a plan, not those who rush in with hope." 💡
🚫 This analysis is for educational purposes only. I am not a SEBI registered analyst and this is not a trading or investment recommendation.

AKZO NOBEL INDIA LTD – Technical Analysis Update📈 Chart Overview:
The stock is forming a cup and handle pattern, with a breakout attempt.
A descending trendline was broken, leading to a sharp upward movement.
Currently, the price is retesting the breakout level.
🔍 Key Levels:
Resistance: ₹3,912, ₹4,585
Support: ₹3,400, ₹3,294
📊 Observations:
A successful retest and bounce from the breakout zone could signal further upside.
Volume analysis suggests increasing interest from buyers.
🚀 Trading View:
A close above ₹3,912 could trigger bullish momentum toward ₹4,585.
If the price fails to hold above ₹3,400, we may see a pullback to ₹3,294.
📌 Disclaimer: This is not financial advice. Do your research before making any trades.

Bear Market Survival Guide : Strategy vs Area of TradingI make educational content videos for swing / positional trading

Cords Cables-Can it continue to be a multibagger?Cords Cables is a small cap company which is available at a perfect position technically.
Zone of 140-150 was a supply zone earlier which now should become a demand zone.
If stock manages to bounce from here with good volumes, it can continue its multibagger journey towards big targets.
However, if this zone is breached, stock can fall rapidly so it sis make or break level for stock technically.
Very risky. Keep in watchlist to study and learn.
Not a recommendation.

HDFC AMC on support HDFC AMC looks good reason --
* Fundamentals Strong
*price is near about its Previous all time high

Parallel channel breakout with retest in Laurus LabsNSE:LAURUSLABS
A bullish parallel channel breakout has happened with a retest at 550 levels.
Currently on a weekly level stock can go past 600 with a buying price at 570-580 levels & subsequently increase beyond 600.
A SL of 450 with a higher target of 700, 900 & 1100 can be achievable in 1 1-year time frame.

KAYA LTD - Symmetrical Triangle - MonthlyKAYA LTD formed Symmetrical Triangle pattern on Monthly chart.
Formed symmetrical triangle and given breakout with very huge volume and retest done .
RSI is looking good and taking support
ROCE going minus every year since last 5-7 years :(
poor sales growth since last 5 years :(
FII's and DII's has increased their holding little bit since last 2 quarter.
What will happen next quarter ? will it go sideways or downtrend will start ?
Resistance1 : 505-511
Resistance 2 : 590-600
No Entry, No Targets until positive results or news coming :)

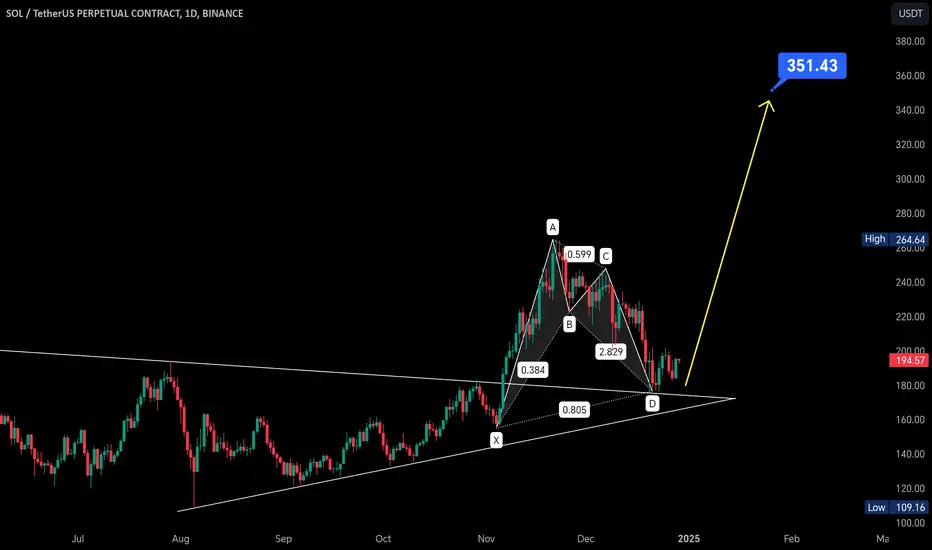
$SOL Price Analysis: $350 and $400 Targets in SightSolana has clearly retested the previous symmetrical triangle and has now formed a bullish Shark pattern. Additionally, it is consistently forming higher lows on the daily chart. The RSI has also bounced back from the oversold region, further supporting a bullish outlook. All these indicators suggest that Solana is poised for a strong upward movement. My price targets for this potential rally are $350 and $400.
$BTC Price Forecast: $75K, $85K, or $108K?Currently, I see three potential scenarios for BTC:
1. BTC is forming lower highs and may retest the previous resistance around the $108,000 level. After that, it could pull back to the $100,000 area before making a new all-time high.
2. BTC might retest the $90,000 level and then move upward. Alternatively, if it loses support at $90,000, it could drop to $85,000 before starting an upward trend.
3. In a worst-case scenario, BTC could undergo a significant correction, dropping as low as $75,000.

GHCL Analysis: Supply & Demand Zones Strategy with Breakouts In this video, we analyze the NSE:GHCL chart using the Demand and Supply Zones Lite Indicator.
Watch as I explain how to:
Identify Stage 1, Stage 2 , and consolidation phases.
Spot breakouts and understand the concept of a flush .
Use demand zones nested inside resistance-turned-support areas to plan high-probability trades.
This video is perfect for anyone looking to improve their technical analysis skills and learn how to trade using demand and supply zones.
Disclaimer: This video is for educational purposes only. Always conduct your own analysis before making trading decisions."

$ETH Bullish Shark Pattern: Key Levels and Potential New ATHCRYPTOCAP:ETH has formed a bullish shark pattern, indicating a potential move towards the $3,850 level initially. Following this, there's a likelihood of a drop to around $3,550, possibly forming a double bottom before rallying to a new all-time high.

USDT.D BULLISH DIVERGENCE SET TO BLEED BTCCRYPTOCAP:USDT.D has formed a bullish divergence and a clear double bottom with proper higher lows, signaling a potential surge toward the 4% to 4.10% resistance area. This movement could lead to a significant drop in BTC and altcoins, as USDT.D and the crypto market are inversely correlated.

ETH Trendline Retest Altseason Poised to Ignite Beyond $4,100ETH has recently retested the trendline break twice, signaling a potential massive move ahead. I believe the real altseason will begin once ETH crosses $4,100. From there, it could soar to $6,000, $8,500, and even $12,000 in the coming days.


SARLAPOLY By KRS Charts27th Nov 2024 / 3:30 PM
Why SARLAPOLY ❓
1. Stock was Stuck under 80 Rs. Resistance since many Years and this year in May it broke the resistance and sustained above 80 Rs. 📈
2. Fundamentally Good company with less than 15 P/E. 💪
3. With Accumulations on Higher TFs SARLAPOLY is making Cup & Handle Pattern. ☕
4. As we discuss it already Broke 80 Rs. Range and recently it retests too on same resistance this makes my conviction strong on this 💪
5. Today giving 15 % Upside move with Strong Volume is confirmed Entry.
✅
Target is expected 145 Rs in Medium to long Term
With SL of 78 Rs 1W Closing basis.

GODREJAGROVET Breakout at 3rd attemptBelow are the some points to go through for better analysis:
1. Breakout after 3rd attempt
2. Risk Reward is almost 2.5.
3. Reversal / Retest already taken
Disclaimer:
Content shared on or through social site channels are for information and education purposes only and should not be treated as investment or trading advice. Please do your own analysis or take independent professional financial advice before making any investments based on your own personal circumstances. Investment in securities are subject to market risks, please carry out your due diligence before investing. And last but not the least, past performance is not indicative of future returns.

USDT.D DOUBLE BOTTOM & BULLISH DIVERGENCE , POSSIBLE RETEST 4.7%#USDT dominance ( CRYPTOCAP:USDT.D ) has formed a double bottom on the higher timeframe, aligning with another double bottom visible on the daily timeframe. The RSI is showing a clear bullish divergence, further strengthening the probability of a retest toward the 4.7% resistance area from the current 4% level. Looks bear in BTC & altcoins go short correction.


GODREJ agrovet On Weekly Flag and pole formation.
Taking support On previous ATH.
Waiting for the breakout

Silver Commodity - breakout and retestSilver near support line and it formed hammer candle yesterday in day timeframeand formed Morning star in 4 hour timeframe.
