POLICYBZR - STWP Equity Snapshot📊 STWP Equity Snapshot – PB Fintech Ltd (POLICYBZR)
(Educational | Chart-Based Interpretation)
POLICYBZR continues to trade within a well-defined range structure, with repeated rejection from the 1960–2000 supply / distribution zone and consistent buyer activity emerging near the 1650–1609 demand / value zone. The stock has once again reverted from upper supply and is currently attempting a recovery from this demand region. The area around 1720–1740 now acts as a near-term balance zone. Holding above this region keeps the recovery attempt structurally valid and allows price to test higher reaction zones near 1755 and 1790, where selling pressure has appeared previously. However, sustained acceptance above these levels would be required to improve directional confidence. On the downside, continued weakness below 1650, and especially below 1609, would signal structural weakness and increase the probability of deeper mean reversion within the range. Until either boundary is resolved, price action should be viewed as rotation rather than trend development.
Recent market conditions reflect a neutral but stabilising environment. The recent strong bullish candle highlights buyer response from demand, but not trend confirmation. Bollinger Band behaviour shows that price is emerging from a compressed phase, with early expansion attempts visible, though follow-through remains limited. The BB squeeze context indicates potential for movement, but direction remains undecided. RSI near 45–46 reflects balanced momentum, consistent with a range-bound market rather than a trending phase. Price interaction with short-term averages suggests short-term stabilisation, while the wide CPR structure reinforces expectations of two-sided activity, consolidation, and rotational price behaviour instead of immediate directional continuation.
Volume analysis adds important context to the recovery attempt. Participation has improved during the recent bounce from demand, indicating active buyer involvement rather than a low-liquidity reaction. At the same time, volume intensity remains moderate (Vol X near 1.0), with no signs of climax or exhaustion. Selling phases have not been accompanied by aggressive volume expansion, suggesting controlled supply rather than panic distribution. Overall, volume behaviour supports range stability and validates the demand-side response, while still falling short of confirming accumulation or breakout intent.
From a short swing perspective, POLICYBZR remains structurally neutral as long as price trades between the 1650–1609 demand zone and the 1960–2000 supply zone. Acceptance above intermediate resistance would be required to shift bias toward higher range expansion. Conversely, sustained acceptance below 1609 would elevate downside risk and suggest continuation of mean reversion toward lower structural levels. Until such confirmation occurs, consolidation and rotational movement within the range should be expected.
Final Outlook (Condition-Based):
Momentum is improving but not decisive, the trend remains range-bound, risk is elevated due to overhead supply, and volume is supportive but non-confirmatory.
💡 STWP Learning Note
In range markets, demand reactions show interest — only acceptance above supply confirms intent.
⚠️ Disclaimer
This post is shared strictly for educational and informational purposes. It is not investment advice or a recommendation. Please consult a SEBI-registered financial advisor before making any financial decision.
🚀 Stay Calm. Stay Clean. Trade With Patience.
Rsibreakout

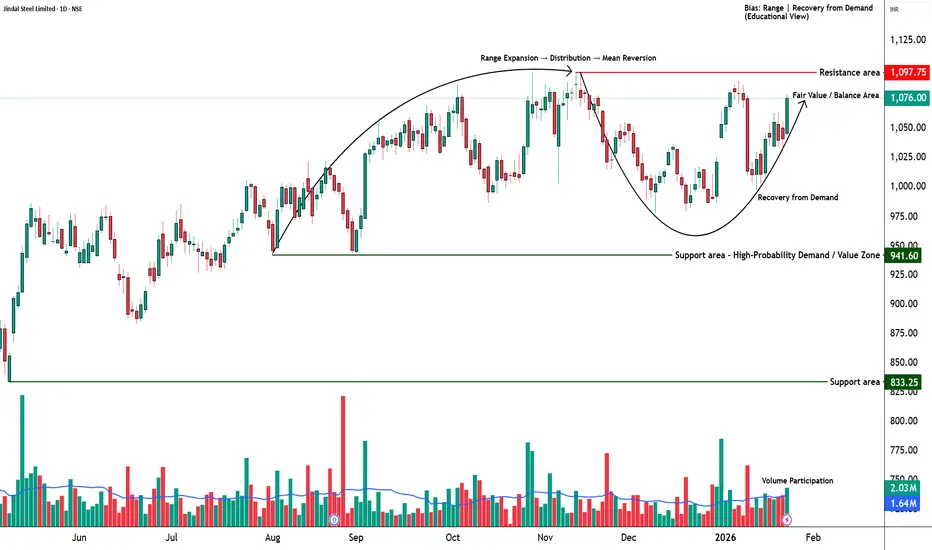
JINDALSTEL - STWP Equity Snapshot📊 STWP Equity Snapshot – Jindal Steel Ltd (JINDALSTEL)
(Educational | Chart-Based Interpretation)
JINDALSTEL is trading within a broader upward structure while navigating a short-term recovery from a recent corrective phase. Price has rebounded strongly from the 1031–1019 demand zone, an area that has historically attracted buyers and acted as structural support. The current price is stabilising near the 1079 balance area, which now serves as a key near-term reference for structure. Holding above this zone keeps the short-term structure constructive and allows price to test higher reaction zones near 1089–1101, where prior supply has emerged. Acceptance above these zones would be required to improve directional confidence. On the downside, any sustained weakness below 1053 initially, and more importantly below 1031, would increase downside risk toward deeper demand and signal a return to range-bound or corrective behaviour. As long as price remains above the primary demand zone, the broader uptrend framework remains intact.
Indicator readings from the green dashboard support a developing bullish structure but with conditions. The presence of a strong bullish candle reflects renewed buyer initiative after consolidation, while Bollinger Band behaviour highlights a prior compression phase now transitioning into early expansion. The BB squeeze context increases the relevance of the current move, suggesting improving volatility conditions rather than a late-stage rally. RSI near 60 indicates strengthening internal momentum without entering stretched or overbought territory, supporting continuation potential while keeping exhaustion risk contained. Price holding above short-term trend measures and VWAP reinforces near-term stability. However, interaction with a wide projected CPR structure suggests that the market environment still favours balance and consolidation, meaning follow-through and acceptance matter more than single-session strength.
Volume behaviour adds an important layer of confirmation. Participation has expanded during bullish candles, indicating active buyer involvement rather than a low-liquidity bounce. Volume intensity remains around healthy levels (Vol X ~1.3), showing interest without signs of climax or emotional excess. Recent pullbacks have not been accompanied by aggressive selling volume, suggesting that supply is being absorbed rather than distributed. Overall, volume dynamics support a controlled recovery and align with accumulation-type behaviour rather than exhaustion.
From a short swing perspective, JINDALSTEL maintains a constructive bias as long as price holds above the 1031–1019 demand zone. If acceptance improves above nearby supply, higher range-expansion reference zones around 1192–1278 come into focus over the coming sessions. Conversely, sustained acceptance below 1019 would elevate downside risk and indicate a shift from recovery into a deeper corrective or range phase. Until such a failure occurs, consolidation above demand should be viewed as structural digestion rather than weakness.
Final Outlook (Condition-Based):
Momentum is strong and improving, the broader trend remains upward, risk stays elevated due to nearby supply and a wide CPR environment, and volume remains supportive but requires continued follow-through.
💡 STWP Learning Note
Strong candles initiate moves; structure and acceptance decide sustainability.
⚠️ Disclaimer
This post is shared strictly for educational and informational purposes. It is not investment advice or a recommendation. Please consult a SEBI-registered financial advisor before making any financial decision.
🚀 Stay Calm. Stay Clean. Trade With Patience.
ZOTA - STWP Equity Snapshot📊 STWP Equity Snapshot – Zota Health Care Ltd
(Educational | Chart-Based Interpretation)
Market Structure
ZOTA witnessed a sharp corrective phase from higher levels, followed by a strong rebound from a well-defined demand zone. The recent candle stands out as a decisive bullish reaction, indicating aggressive buying interest after prolonged selling pressure. Despite the strength of the bounce, price is still trading within a broader range, and the larger trend structure has not yet shifted into a clear uptrend.
Demand–Supply Structure
Price moved deeply into a historical demand zone where buyers stepped in with conviction. The strong bullish candle suggests absorption of selling pressure and short-term buyer dominance. However, overhead supply zones remain active, meaning the current move should be viewed as a recovery from demand rather than a confirmed breakout. Sustained strength is required for further range expansion.
Key Levels – Daily Timeframe
Immediate demand zones are placed near 1376, followed by lower structural supports around 1290 and 1250. These are areas where buyers have previously defended price. On the upside, resistance zones are visible near 1451, 1526, and 1652, where selling pressure has historically emerged. These levels act as reaction zones and help define the current range.
What the Chart is Saying
Momentum has improved significantly after the recent bullish expansion, supported by strong volume participation. RSI is recovering from lower levels, indicating improving internal strength, but it is still not in a trending zone. The structure remains range-bound, suggesting that price may consolidate or oscillate between demand and supply zones before showing directional clarity.
CPR Impact
ZOTA is currently interacting with a wide CPR structure, which typically signals indecision and range-bound behavior. Earlier price action stayed below CPR resistance, reinforcing the lack of strong directional bias. For any sustained bullish shift, price would need to show acceptance above the CPR pivot with follow-through. Until then, the CPR structure supports a cautious, range-based view.
Additional Structure Observations
The rebound candle carries added significance as it formed with an open equal to the low, indicating immediate buyer control and minimal intraday selling pressure. This move was supported by clear volume expansion, suggesting participation beyond short-term traders and pointing toward stronger hands absorbing supply near demand. Short-term moving averages are attempting to turn up, reflecting improving momentum, while price remains below longer-term averages, keeping the broader structure neutral. RSI has recovered from lower levels but is still below bullish expansion zones, indicating support without trend confirmation. Additionally, the projected wide CPR for the next session reinforces the probability of consolidation or two-sided activity rather than immediate directional continuation. Overall, the move reflects strength from demand, but structural acceptance above nearby supply is still required for confirmation.
Intraday Reference Levels (Structure-Based)
The reference price zone near 1400 acts as a short-term decision area. Weakness below this zone may expose price toward lower demand regions around 1290. On the upside, reaction zones near 1450 and above are areas where price may pause or face selling pressure. These are observational levels, not predictions.
Swing Reference Levels (Hybrid Model | 2–5 Days)
For the short swing perspective, the 1400 zone remains the structural reference. Failure to hold demand increases downside risk toward deeper support zones. If strength sustains, higher range-expansion zones above previous resistance come into focus, but only as conditional possibilities within the broader range.
Final Outlook (Condition-Based)
Momentum is strong in the short term, supported by volume expansion. The trend remains range-bound, with no confirmed directional control yet. Risk remains high due to the counter-trend nature of the recovery and nearby supply zones. Volume is elevated, indicating participation, but structure confirmation is still pending.
💡 STWP Learning Note
Strong rebounds from demand show intent — not confirmation.
Let structure and acceptance guide bias, not candle size.
📘 STWP Approach
Observe price. Respect risk.
Trade structure, not excitement.
⚠️ Disclaimer
This post is shared strictly for educational and informational purposes.
It is not investment advice or a recommendation.
Please consult a SEBI-registered financial advisor before making any financial decision.
🚀 Stay Calm. Stay Clean. Trade With Patience.

PERSISTENT - STWP Equity SnapshotSTWP Equity Snapshot – PERSISTENT (Educational | Chart-Based Interpretation)
📌 Intraday Reference Levels (Structure-based)
Reference Price Zone: 6,542.5
Risk Reference (Structure Invalidation): 5,991.2
Observed Upside Zones: 7,204.06 → 7,645.09
📌 Swing Reference Levels (Hybrid Model | 2–5 days | Observational)
Reference Price Zone: 6,542.5
Risk Reference (Structural Breakdown): 5,715.56
Higher Range Projection (If structure resolves upward): 8,196.39 → 9,436.8
Key Levels – Daily TF
Support: 6,298 | 6,084 | 5,962
Resistance: 6,635 | 6,757 | 6,972
🔍 STWP Market Read
Persistent Systems Ltd is currently positioned in a broad consolidation range, following a strong prior up-move. Price is oscillating between well-defined demand and supply zones, indicating balance between buyers and sellers rather than directional dominance.
Momentum indicators remain constructive, with RSI near 60.47, suggesting underlying strength without immediate exhaustion. Volume expansion on recent sessions points toward active participation, though the absence of sustained follow-through beyond resistance keeps the structure range-bound for now. Until price decisively exits this range, patience and structure awareness remain key.
📊 Chart Structure & Indicator Summary
Structure: Range formation after prior impulse
Trend: Neutral to sideways
Momentum: Moderate, stabilising
RSI: Healthy zone — supportive but not stretched
MACD & ADX: Mixed, indicating lack of strong directional trend
Volume: Elevated participation, monitoring for expansion
📈 Final Outlook (Condition-Based)
Momentum: Moderate
Trend: Range
Risk: High (range extremes & volatility)
Volume: High, active participation
💡 STWP Learning Note
Range phases are periods of market digestion. Clarity emerges only after structure resolves — until then, discipline and risk control matter more than anticipation.
⚠️ Disclaimer:
This is an educational market interpretation based on chart structure and publicly available data. It is not a recommendation, advice, or solicitation. Equity markets involve risk. Please consult a SEBI-registered financial advisor before taking any investment or trading decision.
📘 STWP Approach:
Observe momentum. Respect risk. Let structure guide decisions.
💬 Did this add value?
🔼 Boost to support structured learning
✍️ Share your views or questions in the comments
🔁 Forward to traders who value disciplined analysis
👉 Follow for clean, probability-driven STWP insights
🚀 Stay Calm. Stay Clean. Trade With Patience.
Trade Smart | Learn Zones | Be Self-Reliant 📊

TORNTPHARM - STWP Equity SnapshotSTWP Equity Snapshot – TORNTPHARM (Educational | Chart-Based Interpretation)
📌 Intraday Reference Levels (Structure-based)
Reference Price Zone: 4,104.8
Risk Reference (Structure Invalidation): 3,828.54
Observed Upside Zones: 4,436.31 → 4,657.31
📌 Swing Reference Levels (Hybrid Model | 2–5 days | Observational)
Reference Price Zone: 4,104.8
Risk Reference (Structural Breakdown): 3,607.54
Higher Range Projection (If trend sustains): 5,099.32 → 5,845.21
Key Levels Daily TF
Support: 3983 | 3875 | 3815
Resistance: 4152 | 4213 | 4321
🔍 STWP Market Read
Torrent Pharmaceuticals Ltd is displaying strong momentum continuation within an established uptrend, supported by a clean ascending structure and recent price expansion. The breakout candle reflects decisive participation, with volume expanding sharply above recent averages — indicating institutional involvement rather than speculative noise.
Momentum indicators are stretched, with RSI near 80.95, highlighting short-term euphoria and overextension risk. Trend strength remains intact as price continues to hold above prior consolidation zones, but at elevated levels, risk management and patience become more important than anticipation.
📊 Chart Structure & Indicator Summary
Structure: Ascending channel with higher highs and higher lows
Trend: Developing upward bias
Momentum: Strong, impulsive phase
RSI: Overbought — momentum-driven, not mean-reversion yet
MACD & ADX: Trend strength confirmation
Volume: High conviction participation, breakout-backed
📈 Final Outlook (Condition-Based)
Momentum: Strong
Trend: Up
Risk: High (overbought / euphoric zone)
Volume: High, conviction-led
💡 STWP Learning Note
Strong trends do not require prediction — they demand structure awareness, controlled risk, and disciplined review. Momentum rewards patience, not urgency.
⚠️ Disclaimer:
This is an educational market interpretation based on chart structure and publicly available data. It is not a recommendation, advice, or solicitation. Equity markets involve risk. Please consult a SEBI-registered financial advisor before taking any investment or trading decision.
📘 STWP Approach:
Observe momentum. Respect risk. Let structure guide decisions.
💬 Did this add value?
🔼 Boost to support structured learning
✍️ Share your views or questions in the comments
🔁 Forward to traders who value disciplined analysis
👉 Follow for clean, probability-driven STWP insights
🚀 Stay Calm. Stay Clean. Trade With Patience.
Trade Smart | Learn Zones | Be Self-Reliant 📊

DMART - Descending Channel💹 Avenue Supermarts Ltd (NSE: DMART)
Sector: Retail | CMP: 3841.6
View: Reaction from Higher-Timeframe Demand | Early Momentum Recovery
Chart Pattern: Descending Channel (Corrective)
Candlestick Pattern: Strong Bullish Marubozu
________________________________________
Price Action
DMART has spent the last few months in a controlled corrective decline after a prior uptrend, respecting a well-defined descending channel marked by lower highs. Price recently reacted sharply from a higher-timeframe demand base in the 3600 region, printing a decisive bullish expansion candle and closing near the session high. This move signals a shift from passive correction to active demand emergence, with sellers losing near-term control at lower levels. While the broader structure is still recovering and overhead resistance remains intact, the latest price behaviour reflects an early change in character rather than a weak bounce.
________________________________________
Technical Analysis (Chart Readings)
Technically, the chart shows improving alignment after prolonged consolidation. The bullish Marubozu indicates strong buyer dominance with minimal intraday supply. This expansion follows a compression phase, suggesting a short-term volatility release. Momentum indicators remain constructive but not euphoric — RSI around 51 reflects healthy recovery without exhaustion, while price reclaiming short-term averages points to stabilisation above demand. Volume participation is meaningfully above recent averages, confirming that the move is supported by participation rather than thin liquidity. Overall, the technical setup reflects a recovery phase with improving momentum but still within a broader corrective framework.
________________________________________
Key Levels (Chart Readings)
On the downside, a strong structural support zone lies in the 3600–3500 region, which has repeatedly absorbed selling pressure and now acts as the primary downside reference. Intermediate supports around 3719 and 3596 provide near-term cushions during pullbacks. On the upside, immediate resistance is visible near 3907–3972, followed by stronger overhead supply near 4095 and above, where prior distribution has occurred. Price is currently positioned between demand and resistance, making acceptance above these levels critical for sustained upside continuation.
________________________________________
Demand & Supply Zones (Chart Readings)
The demand–supply framework offers clear structure across timeframes. On the Daily timeframe, a major demand zone is established between 3680–3605, forming the broader base for the current recovery attempt, while a higher-timeframe supply zone remains active near 4111–4222. On the Swing timeframe, demand is concentrated around 3680–3605, with swing supply visible near 4173–4222. Intraday demand zones are clustered near 3769–3747 and 3743–3720, highlighting immediate buying interest, while short-term supply remains active near 3668–3658 on pullbacks. These zones frame the current recovery phase, with price rotating upward from demand into nearby supply.
________________________________________
STWP Trade Analysis
DMART has initiated a momentum recovery from a higher-timeframe demand base, supported by rising volume and improving price stability. From an intraday perspective, holding above the 3800–3850 zone keeps the bullish bias intact and allows scope for continuation toward upper resistance levels if participation sustains. From a short-term swing (hybrid) standpoint, the same structure supports a broader mean-expansion framework over the next few sessions, provided price does not slip back into the prior demand range. While the trend bias is turning upward, the presence of overhead supply and elevated volatility warrants disciplined execution, controlled position sizing, and strict respect for structural invalidation levels.
________________________________________
Final Outlook
Momentum: Strong
Trend: Up
Risk: High
Volume: High
The structure favours further recovery as long as price sustains above demand zones, but confirmation through acceptance above overhead supply is essential for trend acceleration. This phase rewards structure awareness, patience, and risk discipline over prediction.

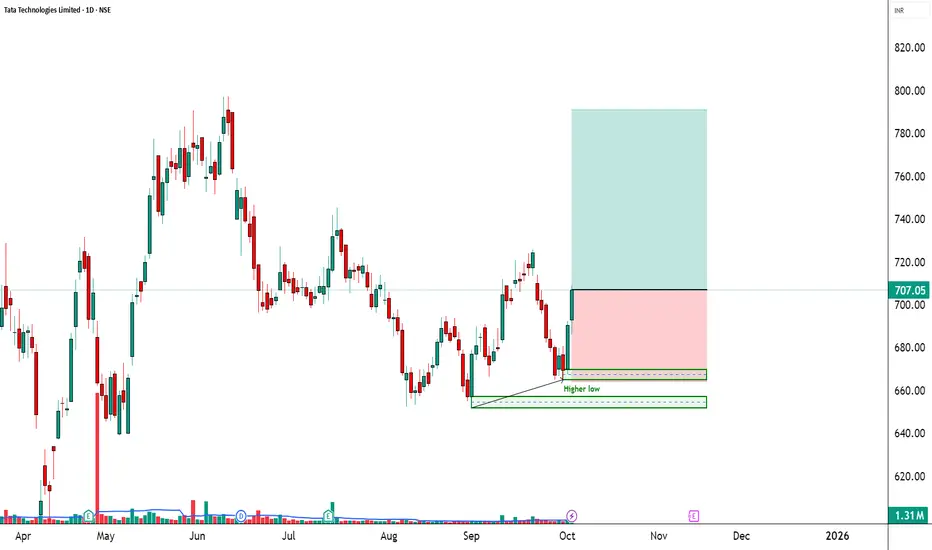
Tata Technologies | EMA50 Breakout + RSI Momentum________________________________________
🚀 Tata Technologies | EMA50 Breakout + RSI Momentum
🔹 Entry Zone: ₹707.05
🔹 Stop Loss: ₹664.20 – ₹664.25 (Risk ~42 pts)
🔹 Supports: 692.47 / 677.88 / 669.62
🔹 Resistances: 715.32 / 723.58 / 738.17
________________________________________
🔑 Key Highlights
✅ Volume Breakout → 1.31M vs avg 1.08M (Smart buying visible)
✅ EMA50 Breakout → trend shift signal
✅ RSI Breakout → momentum favoring bulls
✅ Bollinger Squeeze-Off → volatility expansion expected
________________________________________
🎯 STWP Trade View
📊 Structure shows bullish momentum building. If ₹715.32 is crossed, upside can stretch towards ₹723–738.
⚠️ Supports at ₹692 & ₹678 are crucial for maintaining this momentum.
________________________________________
💡 Learning Note
This setup is a classic example where EMA + RSI + Volume breakout alignment confirms the probability of a short-term bullish rally.
________________________________________
⚠️ Disclosure & Disclaimer – Please Read Carefully
The information shared here is meant purely for learning and awareness. It is not a buy or sell recommendation and should not be taken as investment advice. I am not a SEBI-registered investment adviser, and all views expressed are based on personal study, chart patterns, and publicly available market data.
Trading—whether in stocks or options—carries risk. Markets can move unexpectedly, and losses can sometimes exceed the money you have invested. Past performance or past setups do not guarantee future results.
If you are a beginner, treat this as a guide to understand how the market works and practice on paper trades before risking real money. If you are experienced, always assess your own risk, position sizing, and strategy suitability before entering trades.
Consult a SEBI-registered financial adviser before making any real trading decision. By engaging with this content, you acknowledge full responsibility for your trades and investments.
💬 Found this useful?
🔼 Give this post a Boost to help more traders discover clean, structured learning.
✍️ Drop your thoughts, questions, or setups in the comments — let’s grow together!
🔁 Share with fellow traders and beginners to spread awareness.
👉 “If you liked this breakdown, follow for more clean, structured setups with discipline at the core.”
🚀 Stay Calm. Stay Clean. Trade With Patience.
Trade Smart | Learn Zones | Be Self-Reliant 📊
HAL - Trading Within Descending Channel💹 Hindustan Aeronautics Ltd (NSE: HAL)
Sector: Defence | CMP: 4526
View: Corrective Bias within Descending Channel | Early Mean-Reversion Attempt
HAL continues to trade within a well-defined descending channel on the daily timeframe, with price respecting both the falling supply line and the lower demand boundary over multiple months, confirming a controlled corrective structure rather than trend breakdown. The recent test of the lower channel base near the 4200 zone has resulted in a reactionary rebound, forming a higher low on the immediate swing and indicating demand absorption at the channel bottom. The ongoing move reflects a mean-reversion attempt toward the channel midpoint, with price currently stabilising around the 4520–4550 region. Volume behaviour remains contained, suggesting structural repair rather than an aggressive trend reversal, and any meaningful shift from corrective to recovery would require sustained acceptance above the channel midpoint.
From a support–resistance perspective, HAL remains below multiple overhead supply zones. Immediate resistance is observed near 4575, followed by 4623 and 4702, with the 4900–5000 zone acting as a major institutional supply area. On the downside, 4448 acts as the nearest short-term support, followed by 4369 and 4321, while the 4200–4250 zone remains the key daily accumulation band; a breakdown below this region would materially weaken the structure. Overall, price remains range-bound between reactive support and strong overhead supply, keeping the environment patience-driven.
Momentum conditions are improving but still developing. The latest price action shows a decisive bullish candle alongside a favourable EMA structure shift, while volatility has begun to expand following prior compression. RSI remains in a healthy zone, trend strength is moderate, and the move is supported by above-average volume, indicating genuine participation rather than a low-quality bounce. Relative performance versus the benchmark remains positive, suggesting underlying leadership despite the corrective phase.
From an STWP analytical framework, the level around 4544.90 is tracked purely as a reference derived from recent momentum expansion, while the 4340–4380 zone continues to act as the primary risk reference supporting the structure. On the upside, 4790–4950 aligns with prior supply reactions, with higher swing reference zones visible beyond 5130. Internally, sentiment remains constructive with an upward bias, strong but developing momentum, elevated participation, and higher risk due to proximity to reaction zones, reinforcing the need for structure-led observation over prediction.
Derivatives data reflects a disciplined bullish bias, with call-side participation dominating near the ATM region and put positioning remaining defensive. Price–OI alignment, healthy liquidity, and moderate-to-low implied volatility favour controlled directional exposure, though continuation remains conditional on follow-through, given sensitivity to time decay near key levels.
From a demand–supply lens, the 4429–4342.60 zone stands out as the key daily demand area preserving structural stability, while 4788–4857 remains the primary daily supply zone. Intraday demand is layered at 4426–4410.50 (strong), followed by 4393–4385, and 4367–4342.60 (strong). Intraday supply emerges at 4548–4584, with higher resistance near 4585–4601.90. Any healthy pullback would ideally retrace into these demand zones with price stability and contraction; sustained acceptance below the daily demand zone would signal structural weakness.
Final Outlook:
Momentum: Strong (Developing) | Trend: Upward Bias | Risk: High | Volume: High

PAYTM - Demand–Supply Rebalance💹 Paytm (NSE: PAYTM)
Sector: Financial Services – Fintech | CMP: 1336
View: Demand–Supply Rebalance | Participation Signals Turning Active
Paytm opened the session at 1287.50 and showed steady buying interest right from the start, moving higher to register a high of 1345 while holding a low of 1285, before closing strong at 1336 near the upper end of the day’s range. The session ended with a clear bullish candle, reflecting positive price behaviour and visible buyer participation throughout the day. The rise in price was supported by an increase in volume, which confirms that the move was backed by active participation rather than thin trading. RSI moved above the breakout level to 56.45, staying in a balanced zone, which suggests the stock is transitioning from consolidation rather than entering an overheated phase.
MACD readings remain slightly negative, indicating that sellers have not fully exited yet, and this keeps momentum mixed in the short term. However, the stochastic indicator at 64.41 points to healthy strength, showing that the broader trend remains intact despite minor hesitation. CCI at 41.6 stays in positive territory, lending support to the ongoing upward bias. ADX continues to signal a weak or range-bound environment, highlighting that the trend is still developing and not fully established.
Volume for the session stood at 73.13 lakh compared to an average of 56.61 lakh, placing it within a normal range but clearly strong enough to indicate genuine market interest. The BB Squeeze has released, hinting at a possible expansion phase ahead, while EMA compression further strengthens the case for a directional move. Relative performance remains in line with the broader market, showing neutral strength rather than outperformance. The combination of rising price and rising volume confirms constructive intent, though confirmation is still awaited. Overall, the setup reflects a neutral yet constructive structure with balanced indicators, moderate momentum, a developing trend, moderate risk, and high volume from an educational perspective.
Paytm is currently holding above the primary demand zone at 1297–1256, which continues to act as the base for the current structure. A secondary support layer is visible around 1262, followed by a deeper structural support near 1239, both of which have previously attracted buying interest. On the upside, immediate supply is placed near 1359, with higher resistance zones aligned around 1382 and 1419, where selling pressure has emerged earlier. These overhead zones represent key decision areas for price. Overall, the stock remains well-supported below while facing defined supply above, keeping the structure balanced and range-aware.
From a derivatives standpoint, Paytm is reflecting a constructive but controlled bullish bias, where participation appears organised and intentional rather than aggressive or speculative. The options chain shows clear activity clustered around near-ATM call strikes, especially in the 1300–1360 zone, with the 1340 strike acting as a central pivot. This indicates that traders are positioning close to spot to express directional views efficiently, instead of chasing deep out-of-the-money calls. The delta profile across these strikes remains balanced, confirming that option prices are responding meaningfully to spot movement and that expectations lean toward continuation rather than a flat, non-directional phase.
A dominant feature visible in the options chain is widespread short covering across near-ATM and slightly ITM calls. Multiple call strikes show declining open interest alongside sharp expansion in traded volumes, which suggests that earlier call sellers are being forced to exit as price moves higher. This short covering has clearly contributed to the recent upside move. However, structurally, this also sets an important condition going forward: while short covering can drive an initial rally, sustained upside requires fresh long positions to step in once covering activity tapers off. Without that transition, price may enter a pause or consolidation phase.
At the same time, there are early signs of fresh bullish positioning at higher strikes, most notably around the 1380 call, where price, volume, and open interest are rising together. This long build-up suggests that some participants are beginning to position for continuation beyond the immediate ATM zone, adding credibility to the bullish structure. While this build-up is still selective rather than broad-based, it helps balance the structure and reduces the risk of the move being purely short-cover driven.
Volatility conditions remain favourable and disciplined. Implied volatility across active call strikes sits in a low-to-moderate range and has generally cooled, even as prices have risen. This indicates that premiums are not inflated and that the move is not being driven by panic or urgency. Such an IV environment typically supports directional debit strategies or controlled bull spreads, while also reminding traders that time decay will become relevant if price momentum slows. Volatility structures like straddles and strangles suggest that the market is pricing a reasonable move, but not an explosive expansion, keeping volatility trades in a conditional, watchful zone.
On the put side, the structure is notably supportive. Put short build-up is visible at lower strikes such as 1300 and 1280, where open interest has increased while premiums have fallen. This behaviour reflects confidence that price will remain above these levels, effectively building a support base below the current spot price. Further down the chain, long unwinding in deeper put strikes reinforces the idea that downside hedging demand is reducing rather than increasing. Implied volatility on puts is elevated but orderly, showing confidence rather than fear.
In simple terms, the derivatives market is working in alignment with the price trend, not fighting it. Call sellers are retreating, selective bullish bets are emerging at higher strikes, and put writers are building support below. The tone is optimistic but not euphoric, structured rather than emotional. This measured options behaviour fits well with the broader technical picture and keeps the bullish bias intact, while still leaving room for consolidation if fresh participation slows.
Paytm is currently trading within a clearly defined demand–supply framework across timeframes. On the daily chart, demand is placed in the 1297.90–1256 zone, which acts as the primary accumulation area, while overhead supply is located in the 1360.50–1381.80 zone, marking a key resistance pocket where selling pressure may emerge. On a swing basis, demand is layered between 1297.90–1279.30 and further extended down to 1280–1256, indicating multiple zones where buyers have previously stepped in with conviction. Swing supply is aligned near 1361–1378.30, closely overlapping with the daily supply band, strengthening its importance as a supply cluster.
On lower time frames, demand zones are visible around 1326–1322.40 and 1308–1305.40, highlighting short-term pullback areas where price may attempt to stabilise before resuming direction. The corresponding lower-time-frame supply is positioned at 1367.75–1363.60, reinforcing the overhead resistance structure. Additionally, aggressive demand pockets are stacked lower at 1302.90–1301, 1277–1275.10, and 1265.70–1261.30, suggesting zones where sharp reactions can occur during deeper retracements. On the upside, an aggressive supply area at 1357.90–1354 signals a near-term reaction zone before price approaches the broader supply band. Overall, the structure shows layered demand below and tightly clustered supply above, defining a well-organised trading range with clear reaction levels across timeframes.
⚠️ STWP Educational & Legal Disclaimer
This content is shared strictly for educational and informational purposes only. All discussions, illustrations, charts, price zones, and options structures are meant to explain market behaviour and do not constitute any buy, sell, or hold recommendation. STWP does not provide investment advice, trading calls, tips, or personalised financial guidance, and is not a SEBI-registered intermediary or research analyst.
The analysis is based on publicly available market data and observed price–derivatives behaviour, which is dynamic in nature and may change without notice. Financial markets involve inherent risk, and derivatives carry elevated risk, including the potential for significant capital loss. Factors such as option premiums, implied volatility, open interest, delta, and other Greeks can shift rapidly and unpredictably.
All trading and investment decisions, including position sizing and risk management, are solely the responsibility of the reader. Always consult a SEBI-registered investment advisor before taking any financial action. STWP, its associates, or affiliates shall not be liable for any direct or indirect loss arising from the use of this material. Past patterns, structures, or historical behaviour must never be treated as guarantees of future outcomes.
Position Status: No active position in this instrument at the time of analysis
Data Source: TradingView & NSE India
💬 Did this add value?
🔼 Boost to support structured learning
✍️ Share your views or questions in the comments
🔁 Forward to traders who value disciplined analysis
👉 Follow for clean, probability-driven STWP insights
🚀 Stay Calm. Stay Clean. Trade With Patience.
Trade Smart | Learn Zones | Be Self-Reliant 📊

HDFCAMC - Demand Reclaim, Institutional Participation Visible💹 HDFC Asset Management Co. Ltd (NSE: HDFCAMC)
Sector: Financial Services – Asset Management | CMP: 2723
View: Bullish — Demand Reclaim, Institutional Participation Visible
HDFCAMC has staged a sharp recovery from its lower demand zone, supported by a strong bullish candle and clear volume expansion, signalling renewed buying interest rather than a dead-cat bounce. The recent move has helped the stock reclaim short-term positional levels after a corrective phase, indicating that supply pressure seen earlier has started to ease. Price behaviour now reflects acceptance above demand, which is a constructive sign for follow-through.
From a structural standpoint, the broader trend remains up, with the recent decline appearing corrective within a larger framework rather than trend-damaging. RSI near 57.5 sits in a healthy zone — comfortably above neutral but well below overbought territory — allowing room for continuation if momentum sustains. Stochastic has reset from elevated levels, while MACD behaviour points toward renewed bullish momentum instead of exhaustion. ADX suggests trend strength is improving, hinting at a possible transition from consolidation back into expansion.
Volume dynamics are a key positive. With Vol-X above 3, participation during the recent up-move reflects institutional involvement rather than retail-led volatility. The absence of panic selling during the prior decline and the presence of strong demand absorption increase the probability that the stock is resuming its primary trend rather than entering a prolonged range.
Key price references indicate immediate overhead resistance clustered around the 2765–2810 zone, with a higher supply band near 2890–3000 acting as a broader ceiling. On the downside, structural supports are placed near 2640, followed by 2558 and 2515, defining the current risk envelope. Sustained acceptance above the near-term resistance band would strengthen bullish confidence, while failure to hold above reclaimed levels could lead to range-bound consolidation.
Demand Reclaim, Institutional Participation Visible
On the derivatives side, near-ATM option activity is referenced strictly for analytical insight into positioning behaviour. CALL-side data shows long build-up with strong volume and open-interest expansion, reflecting directional participation aligned with price. PUT-side activity is largely defensive, with short-covering dominating rather than fresh aggressive bearish positioning. Implied volatility remains in a low-to-moderate band, favouring controlled directional structures over fear-driven trades. Overall, derivatives behaviour aligns with a continuation-biased environment, conditional on price follow-through.
Structure quality metrics reinforce this view. The STWP Edge Score remains high, indicating strong alignment between price action, volume, and options positioning. Liquidity is concentrated near the ATM zone, supporting efficient participation, though directional options remain sensitive to time decay if momentum stalls — reinforcing the need for disciplined risk management.
Overall, HDFCAMC appears to be resuming its primary uptrend after a corrective phase, with improving momentum and visible institutional participation. While overhead resistance may induce short-term pauses, the broader structure remains constructive as long as price holds above key demand levels.
Final Outlook (Educational Snapshot):
Momentum: Moderate| Trend: Developing | Risk: High | Volume: Very High
⚠️ STWP Legal Disclaimer
This document is strictly for educational and informational purposes. All examples, charts, levels, and option structures discussed are illustrative and are not intended as buy, sell, or hold recommendations. STWP does not provide investment advice, trading tips, signals, or personalized financial guidance of any kind, nor is it a SEBI-registered intermediary or research analyst. The analyses, illustrations, and risk–reward structures included here are generic in nature and based on publicly available data and observed market behaviour, which may change without notice. Financial markets involve significant risk; derivatives in particular carry the potential for substantial losses. Option premiums, implied volatility, open interest, delta, and other market variables can fluctuate rapidly and unpredictably.
Readers are solely responsible for their trading decisions, capital management, and risk assessment. Before making any investment or trading decision, please consult a SEBI-registered investment advisor. STWP, its representatives, and affiliates shall not be liable for any direct or indirect loss arising from the use of this material. Historical patterns or past market behaviour do not guarantee future outcomes, nor should any part of this document be interpreted as a promise of performance, accuracy, or returns.
Position Status: No active position in this instrument at the time of analysis.
Data Source: TradingView & NSE India.
💬 Found this useful?
🔼 Boost this post to support structured learning
✍️ Share your thoughts or questions in the comments
🔁 Forward this to traders who value clean technical studies
👉 Follow for disciplined, structured, STWP-style analysis
🚀 Stay Calm. Stay Clean. Trade With Patience.
Trade Smart | Learn Zones | Be Self-Reliant 📊

SUPREMEIND High-Volume Reversal Attempt💹 Supreme Industries Ltd (NSE: SUPREMEIND)
Sector: Consumer Durables / Plastics | CMP: 3405.8
View: Neutral to Bullish — High-Volume Reversal Attempt
SUPREMEIND has witnessed a sharp corrective phase from its prior swing high near 4739, followed by a decisive reaction from the lower demand zone around the 3180–3320 region. The recent price action is marked by a strong bullish candle supported by exceptionally high volume, signalling aggressive short covering and fresh participation rather than a low-quality bounce. Despite the strength of the reaction, the broader structure remains a recovery attempt within a larger corrective framework, with price still trading below key medium- and long-term moving averages.
From a structural perspective, the stock is attempting to stabilize after a prolonged decline, with RSI at 43.65 recovering from oversold conditions and moving back into a neutral-to-healthy zone. Stochastic has exited oversold territory, while MACD remains negative but shows early signs of deceleration in downside momentum. ADX reflects a strong directional phase, although current behaviour suggests the trend is transitioning rather than fully reversed. Volume participation is notably elevated (Vol-X 3.86), confirming that the recent move is driven by active repositioning rather than passive mean reversion.
Key price references show overhead supply zones clustered near 3456–3592, while immediate structural support remains around 3320–3184, defining the current risk-reward envelope. A sustained hold above the reclaimed short-term averages would be required to improve structural confidence, while failure to hold recent demand may keep the stock range-bound with elevated volatility.
On the derivatives side, the 3400 CALL is used strictly as an analytical reference to understand positioning behaviour. The option reflects LTP near 72 with a delta of 0.55, indicating strong directional sensitivity. OI contraction of approximately 18 percent combined with an explosive volume expansion of over 1300 percent clearly points to short-covering-led participation rather than fresh leveraged longs. IV remains in a moderate zone, suggesting volatility is present but not excessively priced. This configuration typically aligns with sharp reactive moves, though continuation depends on follow-through in the underlying.
Structure quality metrics remain constructive, with an STWP Edge Score near 6.8/10, supported by liquidity proximity to ATM, balanced IV conditions and strong participation. However, directional options remain highly sensitive to time decay and price stalling, reinforcing the importance of momentum persistence in such environments. Smart positioning currently reflects improving sentiment, though confirmation would require sustained price acceptance above near-term resistance bands.
Overall, SUPREMEIND is exhibiting a high-volume reversal attempt with improving internal momentum, but the broader trend remains in a rebuilding phase. Structural confirmation, moving-average reclaim and contraction-to-expansion behaviour will be critical in determining whether this move evolves into a trend or remains a reactive bounce.
Final Outlook (Educational Snapshot):
Momentum: Strong (Short-Term) | Trend: Recovering / Transitional | Risk: High | Volume: Very High
⚠️ STWP Legal Disclaimer
This document is strictly for educational and informational purposes. All examples, charts, levels, and option structures discussed are illustrative and are not intended as buy, sell, or hold recommendations. STWP does not provide investment advice, trading tips, signals, or personalized financial guidance of any kind, nor is it a SEBI-registered intermediary or research analyst. The analyses, illustrations, and risk–reward structures included here are generic in nature and based on publicly available data and observed market behaviour, which may change without notice. Financial markets involve significant risk; derivatives in particular carry the potential for substantial losses. Option premiums, implied volatility, open interest, delta, and other market variables can fluctuate rapidly and unpredictably.
Readers are solely responsible for their trading decisions, capital management, and risk assessment. Before making any investment or trading decision, please consult a SEBI-registered investment advisor. STWP, its representatives, and affiliates shall not be liable for any direct or indirect loss arising from the use of this material. Historical patterns or past market behaviour do not guarantee future outcomes, nor should any part of this document be interpreted as a promise of performance, accuracy, or returns.
Position Status: No active position in this instrument at the time of analysis.
Data Source: TradingView & NSE India.
💬 Found this useful?
🔼 Boost this post to support structured learning
✍️ Share your thoughts or questions in the comments
🔁 Forward this to traders who value clean technical studies
👉 Follow for disciplined, structured, STWP-style analysis
🚀 Stay Calm. Stay Clean. Trade With Patience.
Trade Smart | Learn Zones | Be Self-Reliant 📊

ERIS - Bullish Momentum Revival💹 Eris Lifesciences Ltd (NSE: ERIS)
Sector: Pharmaceuticals | CMP: 1701.30 | View: Bullish Momentum Revival
Chart Pattern: Falling Wedge Pattern
Candlestick Pattern: Strong Bullish Momentum Candle
Swing High: 1910
Swing Low: 1506
Price Action
Eris Lifesciences has delivered a decisive shift in structure with a wide-range bullish candle emerging directly from the 1506–1530 demand zone. The move invalidates the recent weakness and successfully wipes out the liquidity sweep below prior lows. The strong candle, accompanied by a 52-week volume breakout, signals aggressive participation by stronger hands. Price has reclaimed the mid-Fibonacci levels and is now approaching the early breakout zone of the falling wedge structure, indicating a transition from compression toward directional expansion.
STWP Trade Analysis:
Bullish Breakout Level: 1740
Stop Loss: 1523
Momentum: Strong
Volume: Extremely High – Institutional Participation
Eris Lifesciences has delivered a powerful reversal from the 1506–1530 demand zone, triggering a breakout attempt supported by exceptional volume. The strong bullish candle reflects aggressive buying, reclaiming key mid-Fibonacci levels and rejecting the earlier liquidity sweep, which now appears to be a fake breakdown. Indicators across the board confirm strength — RSI breakout, MACD crossover, Bollinger Band expansion, and BB Squeeze-Off — all signalling the transition from compression to expansion. Buyers have clearly taken control and are defending higher lows with conviction.
VCP Analysis
The stock has displayed volatility contraction through a prolonged falling wedge, compressing steadily over multiple months. Each contraction phase has shown reduced amplitude, culminating in a sharp volume expansion today. This behaviour aligns with the early ignition stage of a VCP breakout. The surge in volume confirms that this is likely not a random upswing but a structural shift backed by institutional intent. Sustaining above 1708 keeps the VCP bias firmly intact.
STWP Support & Resistance
Supports:
• 1579 – Active demand zone, recently defended with strength
• 1457 – Medium-term structural support
• 1377 – Strong historical accumulation zone
Resistances:
• 1781 – First supply zone; momentum checkpoint
• 1861 – Upper mid-range rejection band
• 1983 – Major structural resistance; breakout gateway
These levels define the range in which the stock will oscillate before confirming its next directional leg.
STWP Stock Analysis:
Final Outlook:
Momentum: Strong | Trend: Neutral(Bullish Bias Developing) |
Risk: Moderate | Volume: Extremely High
Eris Lifesciences has staged a clean reversal after weeks of downward drift, with today’s candle marking a decisive shift in structure. The 52-week volume breakout confirms strong institutional activity, while the open=low candle and wide-range body highlight solid buyer dominance. Multiple technical triggers have aligned — RSI breakout, MACD bullish crossover, Bollinger Band breakout, BB Squeeze-Off, and a liquidity sweep below prior lows — collectively signalling the beginning of a fresh directional phase. The Fibonacci structure reinforces this momentum: price has reclaimed the 0.382 and 0.50 retracements, with room toward the 0.618 and 0.786 levels at 1755 and 1823. Sustaining above 1708 strengthens the upward outlook, opening the path toward higher resistances at 1781 → 1861 → 1983. The falling wedge breakout attempt, supported by the massive volume spike, indicates that the stock is transitioning from a prolonged compression into an early expansion cycle. As long as price holds above the layered demand zones at 1579 → 1457 → 1377, the bullish structure remains firmly intact. Traders should observe how the stock behaves on shallow dips toward 1660–1579. Healthy retests or tight pullbacks within this band often act as high-probability continuation setups in strong momentum environments.
⚠️ STWP Legal Disclaimer
This document is strictly for educational and informational purposes. All examples, charts, levels, and option structures discussed are illustrative and are not intended as buy, sell, or hold recommendations. STWP does not provide investment advice, trading tips, signals, or personalized financial guidance of any kind, nor is it a SEBI-registered intermediary or research analyst. The analyses, illustrations, and risk–reward structures included here are generic in nature and based on publicly available data and observed market behaviour, which may change without notice. Financial markets involve significant risk; derivatives in particular carry the potential for substantial losses. Option premiums, implied volatility, open interest, delta, and other market variables can fluctuate rapidly and unpredictably.
Readers are solely responsible for their trading decisions, capital management, and risk assessment. Before making any investment or trading decision, please consult a SEBI-registered investment advisor. STWP, its representatives, and affiliates shall not be liable for any direct or indirect loss arising from the use of this material. Historical patterns or past market behaviour do not guarantee future outcomes, nor should any part of this document be interpreted as a promise of performance, accuracy, or returns.
Position Status: No active position in this instrument at the time of analysis.
Data Source: TradingView & NSE India.
💬 Found this useful?
🔼 Boost this post to support structured learning
✍️ Share your thoughts or questions in the comments
🔁 Forward this to traders who value clean technical studies
👉 Follow for disciplined, structured, STWP-style analysis
🚀 Stay Calm. Stay Clean. Trade With Patience.
Trade Smart | Learn Zones | Be Self-Reliant 📊

SIEMENS: High-Volume Bullish Reversal Breakout________________________________________
💹 Siemens Ltd (NSE: SIEMENS)
Sector: Capital Goods | CMP: 3232.60 | View: High-Volume Bullish Reversal Breakout
Chart Pattern: Falling Wedge
Candlestick Pattern: Bullish Marubozu
Swing High: 3368
Swing Low: 2925
________________________________________
HNI Trade Analysis:
Bullish Breakout Zone: 3232.6 - 3242
Stop Loss: 3094.44
Low-Risk Entry Zone: 3205
Stop Loss: 3051.17
A decisive wide-range bullish candle with extremely high volume signals aggressive institutional accumulation. Price has broken above the recent micro-range, validating the bullish retracement reversal.
________________________________________
STWP Trade Analysis:
Breakout Level: 3242
Stop Loss: 3094.44
Structure: Strong Bullish Candle + High Volume + Reversal Confirmation
Note: Multi-day compression has triggered a high-probability expansion phase.
________________________________________
Resistances: 3285.27 | 3337.93 | 3433.87
Supports: 3136.67 | 3040.73 | 2988.07
________________________________________
STWP Stock Analysis (Brief Synopsis):
Siemens has delivered a powerful bullish reversal breakout after weeks of consolidation and downward drift, confirmed by a strong Marubozu candle supported by 1.56M volume, significantly above the average. Price has cleanly broken above its short-term declining trendline, reclaiming key levels with strong momentum. RSI has moved into a balanced-to-bullish zone near 62, MACD has triggered a fresh bullish crossover, and Stochastic signals sustained buyer strength.
The breakout also aligns with a Bollinger Band expansion, indicating volatility release from a low-compression phase. Multiple bullish triggers are present simultaneously — RSI breakout, EMA compression to expansion shift, ADX improvement, and volume surge — all hinting that institutional activity is backing the move.
Fibonacci retracement zones remain supportive, with price reclaiming the 23.6% (3029) and 38.2% (3094) levels and heading toward 61.8% (3198) and 78.6% (3273), which aligns with the current price zone.
Trend-wise, intraday timeframes (5m–1H) are fully bullish, while the daily timeframe has turned upward after a prolonged downtrend. The weekly remains corrective but improving. As long as Siemens sustains above 3136–3040, the bullish continuation bias stays intact.
Overall, Siemens now reflects a strong reversal breakout, backed by unusually high volume, renewed momentum, and multi-indicator convergence, favouring continuation toward upper resistance bands.
________________________________________
Final Outlook:
Momentum: Strong
Trend: Bullish (Short-Term) | Improving (Medium-Term)
Risk: Low
Volume: Very High (Institutional Footprints)
________________________________________
⚠️ Disclosure & Disclaimer – Please Read Carefully
The information shared here is exclusively for learning and educational purposes. This is not investment advice and should not be considered a buy or sell recommendation.
I am not a SEBI-registered investment adviser. All views are based purely on chart analysis and publicly available market data.
Financial markets involve risk, and traders must assess their own risk tolerance before taking any trade. Please consult a SEBI-registered financial adviser for investment decisions.
________________________________________
Position Status: No active position in (SIEMENS) at the time of analysis.
Data Source: TradingView & NSE India (Past Chart Reference).
________________________________________
💬 Found this useful?
🔼 Boost this post to help more traders learn structured price-action analysis.
✍️ Share your views or setups in the comments — let’s grow as disciplined traders.
🔁 Forward this to fellow learners who want clean technical frameworks.
👉 Follow for more high-quality, structured STWP breakdowns.
________________________________________
🚀 Stay Calm. Stay Clean. Trade With Patience.
Trade Smart | Learn Zones | Be Self-Reliant 📊
________________________________________

Aditya Birla Capital | Bullish Momentum with Exceptional Volume 💹 Aditya Birla Capital Ltd (NSE: ABCAPITAL)
Sector: Financial Services | CMP: ₹326.80 | View: Bullish Continuation Setup
📊 Price Action:
Aditya Birla Capital witnessed a bullish breakout from a tight consolidation range, confirming renewed buying interest.
Price action shows strong momentum as the stock reclaimed short-term resistance with conviction.
Sustaining above 325 can open the path toward 340–347 in the short term, supported by high-volume expansion.
💼 HNI Trade Levels (STWP Setup):
Aggressive Entry: 326.80–328.81 | Stop Loss: 310.58
Low-Risk Entry: 323.14 | Stop Loss: 305.51
HNI and institutional traders have shown clear accumulation interest backed by strong volumes.
The bullish structure with expanding range candles indicates smart money positioning early into the trend.
Momentum continuation is likely as long as price sustains above 314–316 support.
📉 VCP Analysis:
Aditya Birla Capital displays a classic Volatility Contraction Pattern, tightening across the last few weeks before the breakout.
Today’s 20-day volume breakout confirms the end of contraction and the beginning of a volatility expansion phase.
The setup indicates strong institutional intent aligning with the final stage of the VCP breakout.
📈 STWP Trading Analysis:
Entry: 328.80 | Stop Loss: 310.58
Strong bullish candle supported by a 5x surge in volume highlights aggressive participation.
The trend structure remains positive with a series of higher highs and higher lows.
Holding above 320 will keep the bias firmly bullish and validate the ongoing uptrend.
📏 Fibonacci Analysis:
The Fibonacci retracement from the recent swing low at 269.84 to swing high at 350.50 places the price near the 38.2% zone, maintaining a healthy correction within trend.
Holding above 314–316 (23.6%) keeps the pattern intact and supports trend continuation.
A breakout above 333.87 (resistance 1) could drive a move toward 347–353, aligning with the Fibonacci extension projections.
🧭 STWP Support & Resistance:
Resistances: 333.87 | 340.93 | 353.07
Supports: 314.67 | 302.53 | 295.47
While resistance zones near 333–353 may face mild supply, supports between 302–314 appear strong with institutional defense.
Major demand zones are visible near 283–295, confirming deep accumulation pockets.
The setup structure remains bullish with strong support and relatively weak resistance above 333.
📊 STWP Volume & Technical Setup:
Today’s session recorded exceptional volume at 27.94M vs 5.43M average, a 5.14x surge, confirming institutional activity.
The yellow label highlights multiple confirmations — bullish engulfing candle, RSI breakout, and Bollinger Band expansion, signaling volatility release from compression.
Indicators like MACD and Stochastic remain bullish across daily to weekly timeframes, strengthening the continuation outlook.
🧩 STWP Summary View:
Final Outlook:
Momentum: Strong | Trend: Bullish | Risk: Moderate | Volume: High
Aditya Birla Capital is showing a strong technical structure with institutional footprints, rising volumes, and momentum confirmation.
Sustaining above 320 keeps risk controlled, while a decisive move above 333 could accelerate momentum toward higher resistance zones.
The bias remains bullish with trend continuation potential in the near term.
⚠️ Disclosure & Disclaimer – Please Read Carefully
The information shared here is meant purely for learning and awareness. It is not a buy or sell recommendation and should not be taken as investment advice.
I am not a SEBI-registered investment adviser, and all views expressed are based on personal study, chart patterns, and publicly available market data.
Trading—whether in stocks or options—carries risk. Markets can move unexpectedly, and losses can sometimes exceed the money you have invested.
Past performance or past setups do not guarantee future results. Always assess your risk, position sizing, and strategy suitability before entering trades.
Consult a SEBI-registered financial adviser before making any real trading decision.
Position Status: No active position in (ABCAPITAL) at the time of analysis.
Data Source: TradingView & NSE India (Past Chart Reference)
💬 Found this useful?
🔼 Give this post a Boost to help more traders discover structured learning.
✍️ Drop your thoughts, questions, or setups in the comments — let’s grow together!
🔁 Share with fellow traders and beginners to spread awareness.
👉 “If you liked this breakdown, follow for more clean, structured setups with discipline at the core.”
🚀 Stay Calm. Stay Clean. Trade With Patience.
Trade Smart | Learn Zones | Be Self-Reliant 📊

Oil India | Bullish Breakout with Institutional Volume Surge💹 Oil India Ltd (NSE: OIL)
Sector: Energy | CMP: ₹438.05 | View: Bullish Breakout Setup
📊 Price Action:
Oil India has shown a strong bullish candle breakout after weeks of consolidation between 410–420. Buyers stepped in aggressively with volume confirmation, pushing price above the short-term resistance. A sustained close above 435 could trigger a fresh up-move toward the 450–455 zone.
HNI Trade Levels (STWP Setup):
Aggressive Entry: 434.75–436.20 | Stop Loss: 416.08
Low-Risk Entry: 432.57 | Stop Loss: 411.75
HNI and institutional buyers are showing strong accumulation interest with rising volumes. The breakout candle indicates smart money entering early into the trend. Sustained buying momentum suggests continued institutional participation ahead.
VCP Analysis:
Oil India is forming a smooth Volatility Contraction Pattern with clear price tightening in recent weeks. Volume contraction followed by today’s strong expansion indicates a potential VCP breakout stage. The surge in volume confirms institutional activity aligning with the final contraction phase breakout.
STWP Trading Analysis:
Entry: 436.20 | Stop Loss: 410.30
Strong bullish momentum with a wide-range candle backed by heavy institutional volumes. The breakout structure signals renewed trend strength with clear directional intent. Sustaining above 430 will keep the momentum in favor of buyers.
Fibonacci Analysis:
Oil India’s Fibonacci structure is plotted from the Swing Low at 384.6 to the Swing High at 491.5, capturing the recent trend wave. The stock is currently trading near the 50% retracement level at 438.05, showing a strong recovery within the ongoing uptrend. Holding above the 38.2% zone at 425.44 will keep momentum intact, while a breakout above the 61.8% level at 450.66 could extend the move toward 468–491, confirming trend continuation.
STWP Support & Resistance:
Resistances: 440.53 | 446.32 | 456.43
Supports: 424.63 | 414.52 | 408.73
While we note the above technical levels, the chart displays resistance zones at 448–456 and 478–491 as relatively weak, indicating limited selling pressure. However, supports near 392–384 and 325–350 appear strong, reflecting firm institutional demand and accumulation interest. This structure suggests a bullish bias, where sustained buying above 440 could trigger continuation momentum toward higher levels.
STWP Volume & Technical Setup:
Oil India delivered a power-packed bullish session today, marked by a strong Marubozu candle that reflected uninterrupted buying momentum from open to close. The chart’s yellow label captures a perfect storm of bullish confirmations — from exceptional volume (6.03M vs 2.48M avg, ratio 2.43x) to a Bollinger Band breakout emerging right after a compression phase, signaling fresh volatility expansion. The RSI breakout, 200 EMA crossover, and BB Squeeze trigger all align to validate institutional accumulation and trend strength. With buyer dominance clearly visible, Oil India stands poised for a momentum-driven continuation in the sessions ahead.
STWP Summary View:
Final Outlook:
Momentum: Strong | Trend: Bullish | Risk: Low | Volume: High
Oil India displays a textbook bullish setup with strong price action, expanding volume, and visible institutional activity.
A high-volume breakout from a tight base confirms trend strength and upside potential. Holding above key supports keeps risk low and the bullish momentum intact.
________________________________________
________________________________________
⚠️ Disclosure & Disclaimer – Please Read Carefully
The information shared here is meant purely for learning and awareness. It is not a buy or sell recommendation and should not be taken as investment advice. I am not a SEBI-registered investment adviser, and all views expressed are based on personal study, chart patterns, and publicly available market data.
Trading—whether in stocks or options—carries risk. Markets can move unexpectedly, and losses can sometimes exceed the money you have invested. Past performance or past setups do not guarantee future results.
If you are a beginner, treat this as a guide to understand how the market works and practice on paper trades before risking real money. If you are experienced, always assess your own risk, position sizing, and strategy suitability before entering trades.
Consult a SEBI-registered financial adviser before making any real trading decision. By engaging with this content, you acknowledge full responsibility for your trades and investments.
Position Status: No active position in (OIL) at the time of analysis.
Data Source: TradingView & NSE India (Past Chart Reference) (Historical levels)
💬 Found this useful?
🔼 Give this post a Boost to help more traders discover clean, structured learning.
✍️ Drop your thoughts, questions, or setups in the comments — let’s grow together!
🔁 Share with fellow traders and beginners to spread awareness.
👉 “If you liked this breakdown, follow for more clean, structured setups with discipline at the core.”
🚀 Stay Calm. Stay Clean. Trade With Patience.
Trade Smart | Learn Zones | Be Self-Reliant 📊

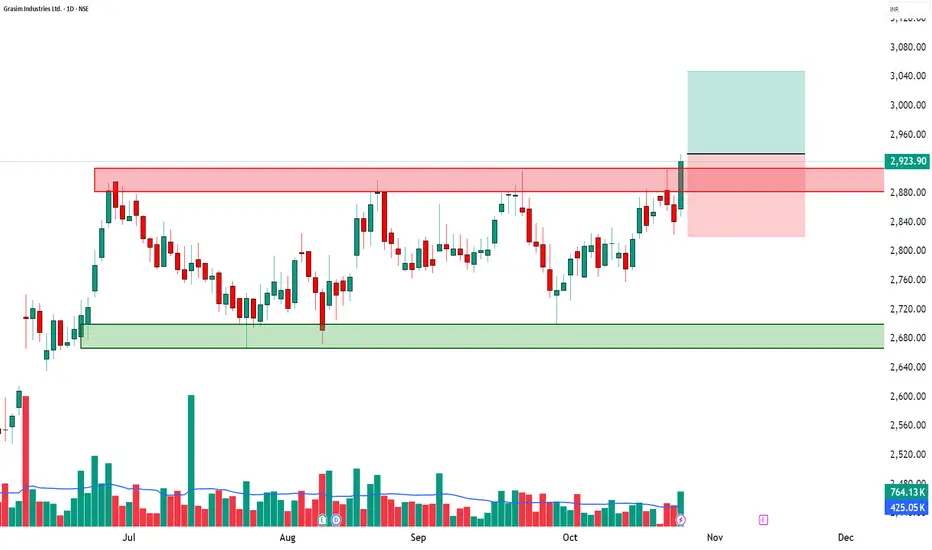
GRASIM | 52-Week Breakout + RSI Surge + High Volume📈 GRASIM | 52-Week Breakout + RSI Surge + High Volume Confirmation 🚀
🔹 Entry Zone: ₹2,923.90 – ₹2,934.00
🔹 Stop Loss: ₹2,820.45 (Risk ~113 pts)
🔹 Supports: 2,869.67 / 2,815.43 / 2,783.27
🔹 Resistances: 2,956.07 / 2,988.23 / 3,042.47
🔹 Swing Demand Zone: ₹2,787 – ₹2,764.50
🔑 Key Highlights
✅ 52-Week Breakout – strong confirmation of bullish momentum continuation
✅ RSI Breakout – trend acceleration backed by strength
✅ Bollinger Band Expansion – volatility breakout indicates fresh momentum
✅ VWAP Alignment – buyers maintaining control across sessions
✅ Volume Spike (1.8x avg) – institutional buying and strong follow-up interest
🎯 STWP Trade View
📊 Momentum favors continued bullish strength. Sustaining above ₹2,956 could extend the move toward ₹2,988–₹3,042 levels.
⚠️ The ₹2,787–₹2,764 zone acts as a key swing base where accumulation is likely to continue if prices retest.
💡 Learning Note
This setup demonstrates how a 52-week breakout with RSI and VWAP confirmation can mark a major trend continuation point. Volume expansion adds conviction, making such setups ideal for momentum-based swing trades.
Final Outlook: Momentum: Strong | Trend: Bullish | Risk: Low | Volume: High
________________________________________
________________________________________
⚠️ Disclosure & Disclaimer – Please Read Carefully
The information shared here is meant purely for learning and awareness. It is not a buy or sell recommendation and should not be taken as investment advice. I am not a SEBI-registered investment adviser, and all views expressed are based on personal study, chart patterns, and publicly available market data.
Trading—whether in stocks or options—carries risk. Markets can move unexpectedly, and losses can sometimes exceed the money you have invested. Past performance or past setups do not guarantee future results.
If you are a beginner, treat this as a guide to understand how the market works and practice on paper trades before risking real money. If you are experienced, always assess your own risk, position sizing, and strategy suitability before entering trades.
Consult a SEBI-registered financial adviser before making any real trading decision. By engaging with this content, you acknowledge full responsibility for your trades and investments.
Position Status: No active position in GRASIM at the time of analysis.
Data Source: TradingView & NSE India (Past Chart Reference) (Historical levels)
💬 Found this useful?
🔼 Give this post a Boost to help more traders discover clean, structured learning.
✍️ Drop your thoughts, questions, or setups in the comments — let’s grow together!
🔁 Share with fellow traders and beginners to spread awareness.
👉 “If you liked this breakdown, follow for more clean, structured setups with discipline at the core.”
🚀 Stay Calm. Stay Clean. Trade With Patience.
Trade Smart | Learn Zones | Be Self-Reliant 📊
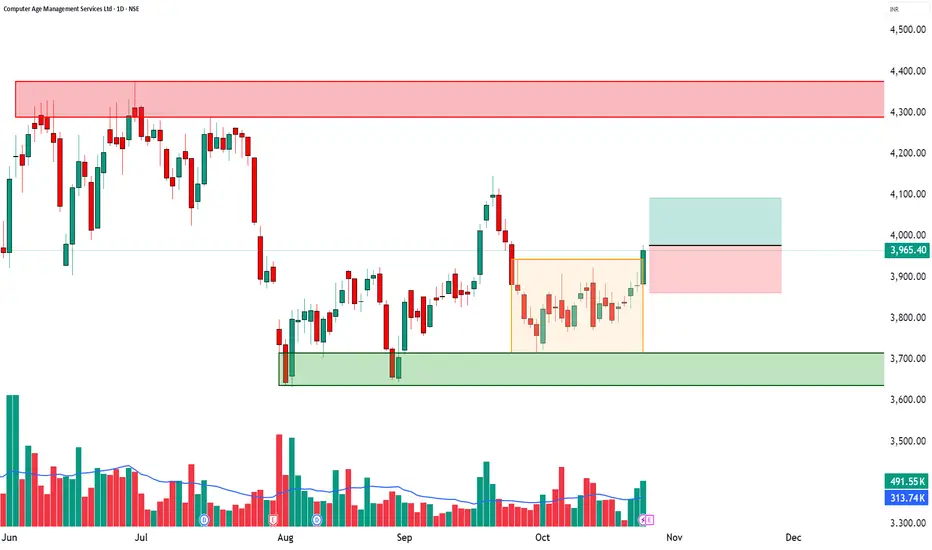
CAMS | Bullish Breakout + RSI Surge + High Volume📈 CAMS | Bullish Breakout + RSI Surge + High Volume Confirmation 🚀
🔹 Entry Zone: ₹3,965.40 – ₹3,977.80
🔹 Stop Loss: ₹3,862.45 (Risk ~115 pts)
🔹 Supports: 3,905.67 / 3,845.93 / 3,809.87
🔹 Resistances: 4,001.47 / 4,037.53 / 4,097.27
🔹 Swing Demand Zone: ₹3,815.50 – ₹3,789.90
🔹 Intraday Demand Zone: ₹3,885.70 – ₹3,877.00 | ₹3,875.90 – ₹3,868.10
🔑 Key Highlights
✅ Strong Bullish Candle – powerful continuation signal backed by strong volume
✅ RSI Breakout – confirms renewed buying momentum
✅ Bollinger Band Expansion – volatility breakout underway
✅ VWAP Alignment – sustained buyer dominance across sessions
✅ Volume Surge (1.57x avg) – active institutional participation
🎯 STWP Trade View
📊 Momentum favors a short-term bullish continuation. A close above ₹4,001 could extend the rally toward ₹4,037–₹4,097 zones.
⚠️ The ₹3,885–₹3,868 range offers intraday demand, while ₹3,815–₹3,789 serves as the swing demand base for positional traders.
💡 Learning Note
This setup combines RSI breakout + VWAP alignment + high volume — a potent trio for identifying momentum-backed bullish reversals. Traders can use intraday zones for tactical entries with clear stop placement.
Final Outlook: Momentum: Strong | Trend: Bullish | Risk: Low | Volume: High
________________________________________
________________________________________
⚠️ Disclosure & Disclaimer – Please Read Carefully
The information shared here is meant purely for learning and awareness. It is not a buy or sell recommendation and should not be taken as investment advice. I am not a SEBI-registered investment adviser, and all views expressed are based on personal study, chart patterns, and publicly available market data.
Trading—whether in stocks or options—carries risk. Markets can move unexpectedly, and losses can sometimes exceed the money you have invested. Past performance or past setups do not guarantee future results.
If you are a beginner, treat this as a guide to understand how the market works and practice on paper trades before risking real money. If you are experienced, always assess your own risk, position sizing, and strategy suitability before entering trades.
Consult a SEBI-registered financial adviser before making any real trading decision. By engaging with this content, you acknowledge full responsibility for your trades and investments.
Position Status: No active position in CAMS at the time of analysis.
Data Source: TradingView & NSE India (Past Chart Reference) (Historical levels)
💬 Found this useful?
🔼 Give this post a Boost to help more traders discover clean, structured learning.
✍️ Drop your thoughts, questions, or setups in the comments — let’s grow together!
🔁 Share with fellow traders and beginners to spread awareness.
👉 “If you liked this breakdown, follow for more clean, structured setups with discipline at the core.”
🚀 Stay Calm. Stay Clean. Trade With Patience.
Trade Smart | Learn Zones | Be Self-Reliant 📊
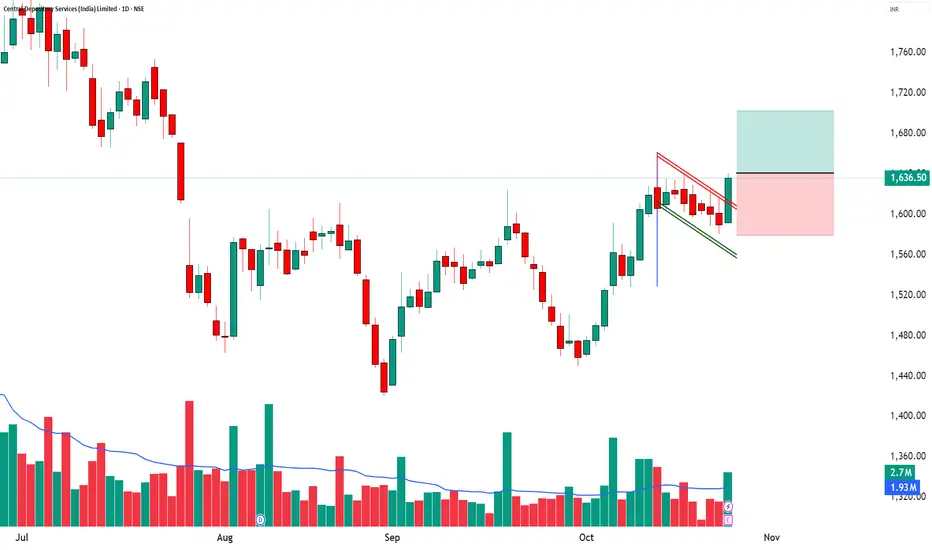
CDSL | Bullish Marubozu + RSI Breakout + Volume Expansion📈 CDSL | Bullish Marubozu + RSI Breakout + Volume Expansion 🚀
🔹 Entry Zone: ₹1,636.50 – ₹1,641.00
🔹 Stop Loss: ₹1,579.25 (Risk ~61 pts)
🔹 Supports: 1,605.33 / 1,574.17 / 1,556.33
🔹 Resistances: 1,654.33 / 1,672.17 / 1,703.33
🔹 Swing Demand Zone: ₹1,593.40 – ₹1,581.00
🔹 Intraday Demand Zone: ₹1,593.40 – ₹1,588.00
🔑 Key Highlights
✅ Bullish Marubozu Candle – clear sign of buyer dominance
✅ RSI Breakout – momentum strength confirmation
✅ Volume Surge (1.4x avg) – strong institutional participation
✅ Bollinger Squeeze-Off – breakout + volatility expansion expected
✅ VWAP Alignment – price sustaining above average buyer level
🎯 STWP Trade View
📊 Momentum supports a short-term bullish continuation. A decisive close above ₹1,654 may open the path toward ₹1,672–₹1,703.
⚠️ The ₹1,605–₹1,574 zone offers positional strength, while ₹1,593–₹1,588 acts as an intraday demand pocket for re-entry or dip-buying opportunities.
💡 Learning Note
This setup shows how combining price action (Marubozu) with RSI breakout and volume confirmation enhances conviction. Identifying multi-timeframe demand zones allows traders to plan entries with better precision and controlled risk.
Final Outlook: Momentum: Strong, Trend: Bullish, Risk: Low, Volume: High
________________________________________
________________________________________
⚠️ Disclosure & Disclaimer – Please Read Carefully
The information shared here is meant purely for learning and awareness. It is not a buy or sell recommendation and should not be taken as investment advice. I am not a SEBI-registered investment adviser, and all views expressed are based on personal study, chart patterns, and publicly available market data.
Trading—whether in stocks or options—carries risk. Markets can move unexpectedly, and losses can sometimes exceed the money you have invested. Past performance or past setups do not guarantee future results.
If you are a beginner, treat this as a guide to understand how the market works and practice on paper trades before risking real money. If you are experienced, always assess your own risk, position sizing, and strategy suitability before entering trades.
Consult a SEBI-registered financial adviser before making any real trading decision. By engaging with this content, you acknowledge full responsibility for your trades and investments.
Position Status: No active position in CDSL at the time of analysis.
Data Source: TradingView & NSE India (Past Chart Reference) (Historical levels)
💬 Found this useful?
🔼 Give this post a Boost to help more traders discover clean, structured learning.
✍️ Drop your thoughts, questions, or setups in the comments — let’s grow together!
🔁 Share with fellow traders and beginners to spread awareness.
👉 “If you liked this breakdown, follow for more clean, structured setups with discipline at the core.”
🚀 Stay Calm. Stay Clean. Trade With Patience.
Trade Smart | Learn Zones | Be Self-Reliant 📊
DIVISLAB - Bullish Momentum + RSI & MACD Breakout📈 Divis Laboratories Ltd | Bullish Momentum + RSI & MACD Breakout 🚀
🔹 Entry Zone: ₹6,100 – ₹6,120
🔹 Stop Loss: ₹5,739.80 (Risk ~₹380 pts)
🔹 Supports: 5,917.33 / 5,730.17 / 5,628.83
🔹 Resistances: 6,205.83 / 6,307.17 / 6,494.33
________________________________________
🔑 Key Highlights
✅ Strong Bullish Candle – powerful reversal from key support zone
✅ RSI Breakout – momentum confirmation after prolonged base
✅ MACD Crossover – positive trend shift visible
✅ Bullish SuperTrend + VWAP Alignment – institutional momentum confirmation
✅ BB Squeeze-Off → volatility expansion expected
________________________________________
🎯 STWP Trade View
📊 Momentum suggests a short-term bullish rally is in play.
A close above ₹6,200 may open further upside toward ₹6,307 – ₹6,494.
⚠️ Supports at ₹5,917 & ₹5,730 act as crucial protection zones.
Volume spike confirms fresh long build-up — a classic “Buy Today, Sell Tomorrow” setup.
________________________________________
💡 Learning Note
This setup beautifully showcases how combining RSI Breakout + MACD Crossover + VWAP alignment strengthens a momentum-based reversal.
When such signals converge near Fibonacci supports, they offer high-probability swing setups with strong follow-through potential.
________________________________________
⚠️ Disclosure & Disclaimer – Please Read Carefully
The information shared here is purely for learning and awareness purposes.
It is not a buy or sell recommendation and should not be treated as investment advice.
I am not a SEBI-registered investment adviser — all observations are based on personal chart study and publicly available data.
Trading involves risk — markets can move unexpectedly, and losses can exceed invested amounts.
Past setups or patterns do not guarantee future outcomes.
If you’re a beginner, treat this content as a learning reference and start with paper trades.
If you’re experienced, align setups with your own risk and position sizing strategy.
Always consult a SEBI-registered advisor before executing any trades.
By engaging with this content, you accept full responsibility for your actions.
________________________________________
💬 Found this useful?
🔼 Give this post a Boost to help more traders learn structured setups
💬 Drop your thoughts or chart views below — let’s grow together
🔁 Share with fellow traders who love clean, data-backed analysis
👉 “If you liked this breakdown, follow for more disciplined, structured setups.”
🚀 Stay Calm. Stay Clean. Trade With Patience.
Trade Smart | Learn Zones | Be Self-Reliant 📊
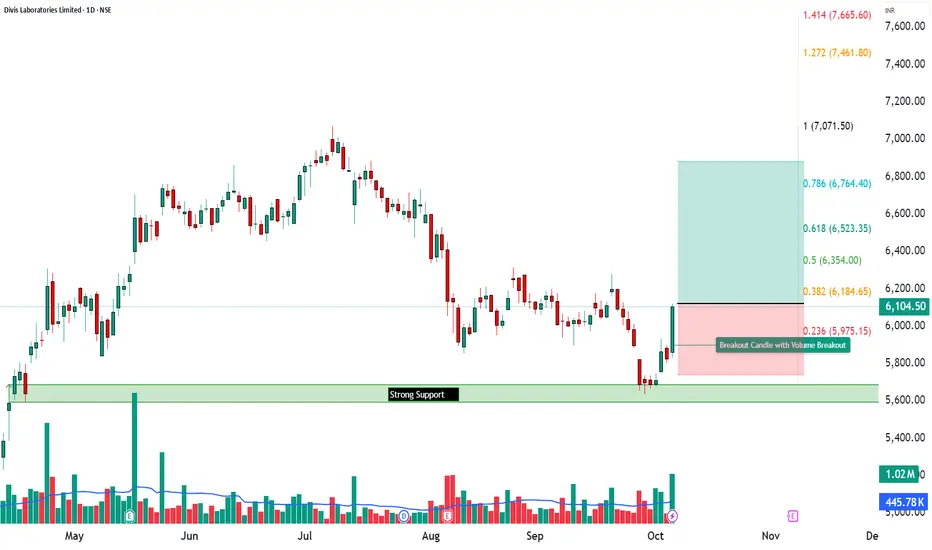
MCX - Bullish W-Pattern (Double Bottom Breakout)________________________________________
🚀 Multi Commodity Exchange of India Ltd (NSE: MCX) | Bullish W-Pattern (Double Bottom Breakout)
📊 Current Market Snapshot
CMP: ₹8,706.00
Sector: Financial Services / Commodity Exchange
Pattern Observed: 🟢 W-Pattern (Double Bottom Breakout)
Candlestick Signal: Strong Bullish Marubozu + Volume Breakout
Strength Rating: ⭐⭐⭐⭐☆ (High-Conviction Bullish Reversal)
________________________________________
🧭 Technical Indicators
The technical indicators on this chart are flashing strong bullish signals. Momentum is clearly positive, supported by a Bullish Marubozu candle, which reflects strong buying pressure and conviction. The chart also indicates a possible breakout formation, confirmed by a strong bullish candle backed by extremely high volume — a classic sign of institutional participation.
Multiple bullish confirmations like swing trade alignment, intraday signal, RSI breakout, and bullish engulfing pattern further add weight to the uptrend. The Bollinger Band breakout and Bullish VWAP suggest sustained price expansion, while the BB Squeeze-Off hints at volatility returning in favor of the bulls. Altogether, these indicators reinforce a buy-on-dip structure with potential for continuation toward higher resistance zones.
MCX is currently trading in the Progressive Zone, indicating a phase of steady upward momentum where buyers are actively accumulating positions. This zone reflects controlled bullish strength and sustained participation, suggesting that the stock is gearing up for a potential breakout continuation.
The KST (Know Sure Thing) indicator for MCX is in bullish territory, confirming the upward momentum seen in price action. With a strong positive crossover and supportive strength reading, the KST reinforces the ongoing uptrend — indicating that momentum remains firmly in favor of the bulls and the stock could continue its northward journey.
MCX is trading between its Swing High at ₹8,439.5 and Swing Low at ₹7,304. The Top Range near ₹9,115 acts as a major resistance zone, while the Bottom Range around ₹7,304 provides strong support, defining a clear bullish structure with room for further upside if momentum sustains.
________________________________________
📊 Trade Setup (Strong Momentum Entry)
Entry: ₹8,748.50
________________________________________
💡 Learning Note
This setup is a textbook example of a W-pattern (Double Bottom) breakout, where price reverses from a downtrend after forming two clear lows at similar levels. The neckline breakout with heavy volume confirms a shift in market sentiment from bearish to bullish. Such patterns highlight how volume expansion and strong breakout candles validate reversal strength and help traders identify early entry points in new uptrends.
________________________________________
⚠️ Disclosure & Disclaimer – Please Read Carefully
The information shared here is meant purely for learning and awareness. It is not a buy or sell recommendation and should not be taken as investment advice. I am not a SEBI-registered investment adviser, and all views expressed are based on personal study, chart patterns, and publicly available market data.
Position Status: No active position in MCX at the time of analysis.
Data Source: Past Chart reference(Historical levels)
Trading—whether in stocks or options—carries risk. Markets can move unexpectedly, and losses can sometimes exceed the money you have invested. Past performance or setups do not guarantee future results.
If you are a beginner, treat this as a learning guide and practice with paper trades before risking real money. If you are experienced, always assess your own risk, position sizing, and strategy suitability before entering trades.
Consult a SEBI-registered financial adviser before making any real trading decision. By engaging with this content, you acknowledge full responsibility for your trades and investments.
________________________________________
💬 Found this useful?
🔼 Give this post a Boost to help more traders discover clean, structured learning.
✍️ Drop your thoughts, questions, or setups in the comments — let’s grow together!
🔁 Share with fellow traders and beginners to spread awareness.
👉 “If you liked this breakdown, follow for more clean, structured setups with discipline at the core.”
🚀 Stay Calm. Stay Clean. Trade With Patience.
Trade Smart | Learn Zones | Be Self-Reliant 📊
________________________________________
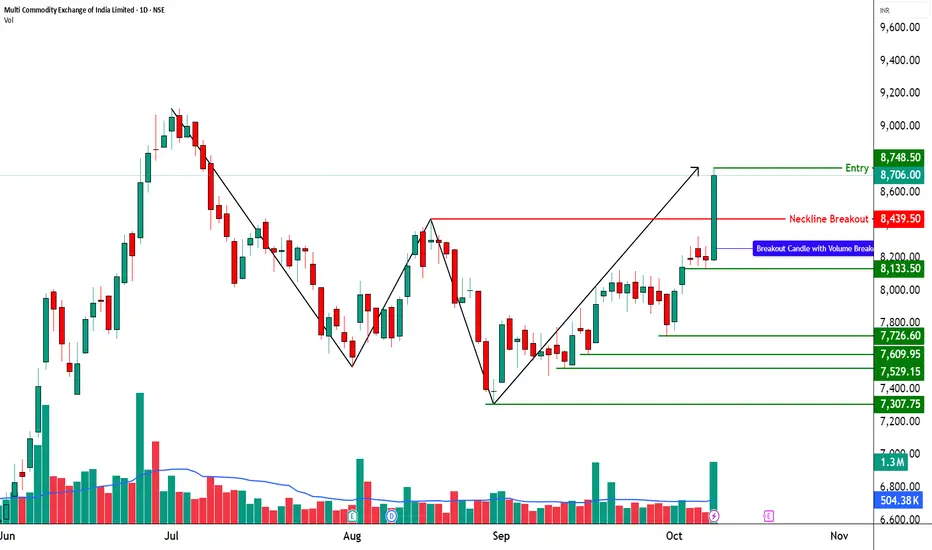
BSE | Intraday Bullish Setup📈 **BSE LTD | Bullish Breakout + SuperTrend Flip 🚀**
STWP Trade Analysis
🔹 **Entry Zone:** ₹2,328 – ₹2,334
🔹 **Stop Loss:** ₹2,296 (Risk ~₹32)
🔹 **Supports:** 2,305 / 2,265 / 2,232
🔹 **Resistances:** 2,388 / 2,423 / 2,450
🔑 **Key Highlights**
✅ Strong Bullish Candle — Breakout above consolidation with volume surge
✅ RSI & BB Expansion — Momentum revival confirmation
✅ SuperTrend Flip — Short-term trend turns bullish
✅ BB Squeeze-Off → Fresh volatility expansion underway
💡 **Learning Note**
This setup highlights how **volume-backed breakouts** aligned with **SuperTrend and RSI confirmation** provide high-probability entries. When volatility expands after a squeeze and price clears resistance with momentum, it often signals **institutional breakout strength** and **early trend continuation**.
⚠️ Disclosure & Disclaimer – Please Read Carefully
The information shared here is meant purely for learning and awareness.
It is not a buy or sell recommendation and should not be taken as investment advice.
I am not a SEBI-registered investment adviser, and all views expressed are based on personal study, chart patterns, and publicly available market data.
Position Status: No active position in BSE at the time of analysis.
Data Source: TradingView & NSE India (Past Chart Reference) (Historical levels)
Trading — whether in stocks or options — carries risk. Markets can move unexpectedly, and losses can sometimes exceed the capital you have invested.
Past performance or setups do not guarantee future results.
If you are a beginner, treat this as a learning example and practice with paper trades before risking real money.
If you are experienced, always assess your own risk, position sizing, and strategy suitability before entering trades.
Consult a SEBI-registered financial adviser before making any real trading decision.
By engaging with this content, you acknowledge full responsibility for your trades and investments.
________________________________________
💬 Found this useful?
🔼 Give this post a Boost to help more traders discover structured learning.
✍️ Drop your thoughts, questions, or setups in the comments — let’s grow together!
🔁 Share with fellow traders and beginners to spread awareness.
👉 “If you liked this breakdown, follow for more clean, structured setups with discipline at the core.”
🚀 Stay Calm. Stay Clean. Trade With Patience.
Trade Smart | Learn Zones | Be Self-Reliant 📊
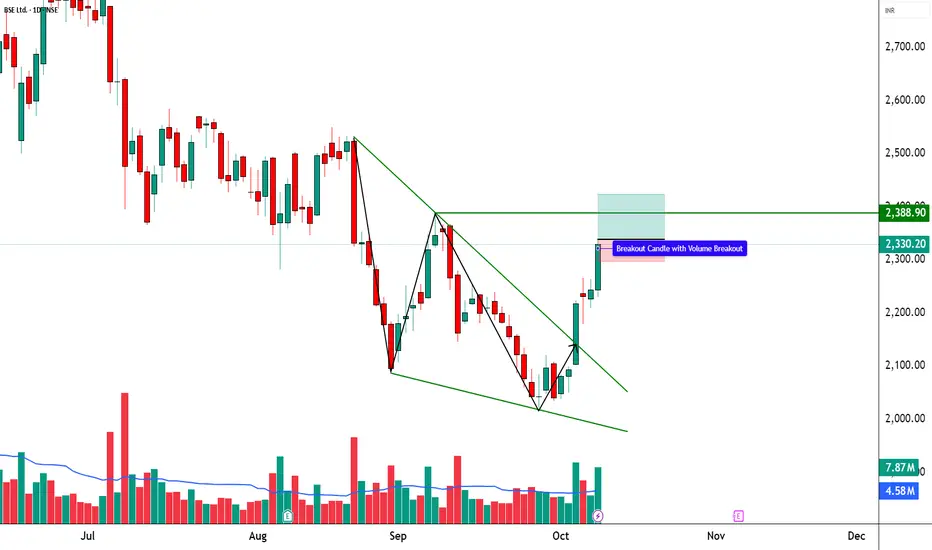
HDFC AMC LTD | Bullish Momentum + Possible Breakout📈 HDFC AMC LTD | Bullish Momentum + Possible Breakout 🚀
🔹 Bullish Breakout Zone: 5,660 – 5,685
🔹 Stop Loss: 5,633 (Risk ~₹52)
🔹 Supports: 5,584 / 5,499 / 5,448
🔹 Resistances: 5,719 / 5,770 / 5,855
🔑 Key Highlights
HDFC AMC has formed a strong bullish candle with a notable volume surge, clearly confirming aggressive buying interest. The RSI breakout signals a shift in momentum after a prolonged consolidation phase, indicating that the stock is gaining renewed strength. Additionally, a Bollinger Band Squeeze-Off pattern is visible, suggesting a potential volatility expansion and a short-term breakout on the upside. The spike in trading volume further reinforces the bullish sentiment, hinting at possible institutional participation behind this move.
🎯 STWP Trade View
📊 Price has reclaimed control above near-term resistances with improving momentum.
A sustained close above ₹5,719 can trigger a move toward ₹5,770–₹5,855 levels in the short term.
Pullbacks toward ₹5,640–₹5,660 may offer favorable entry zones with tight risk control.
⚠️ Supports at ₹5,584 and ₹5,499 remain crucial for maintaining the swing structure and protecting positions.
________________________________________
📊 Final Outlook
Momentum: 🔥 Strong
Trend: 📉 Bearish (but reversing)
Risk: 🟢 Low
Volume: 📈 High
________________________________________
💡 Learning Note
This setup demonstrates the power of confluence — RSI breakout + BB squeeze + volume surge.
Such multi-signal alignments often mark the start of a momentum phase, offering early entry opportunities before a confirmed breakout rally.
________________________________________
________________________________________
⚠️ Disclosure & Disclaimer – Please Read Carefully
The information shared here is meant purely for learning and awareness. It is not a buy or sell recommendation and should not be taken as investment advice. I am not a SEBI-registered investment adviser, and all views expressed are based on personal study, chart patterns, and publicly available market data.
Trading—whether in stocks or options—carries risk. Markets can move unexpectedly, and losses can sometimes exceed the money you have invested. Past performance or past setups do not guarantee future results.
If you are a beginner, treat this as a guide to understand how the market works and practice on paper trades before risking real money. If you are experienced, always assess your own risk, position sizing, and strategy suitability before entering trades.
Consult a SEBI-registered financial adviser before making any real trading decision. By engaging with this content, you acknowledge full responsibility for your trades and investments.
Position Status: No active position in HDFCAMC at the time of analysis.
Data Source: TradingView & NSE India (Past Chart Reference) (Historical levels)
💬 Found this useful?
🔼 Give this post a Boost to help more traders discover clean, structured learning.
✍️ Drop your thoughts, questions, or setups in the comments — let’s grow together!
🔁 Share with fellow traders and beginners to spread awareness.
👉 “If you liked this breakdown, follow for more clean, structured setups with discipline at the core.”
🚀 Stay Calm. Stay Clean. Trade With Patience.
Trade Smart | Learn Zones | Be Self-Reliant 📊
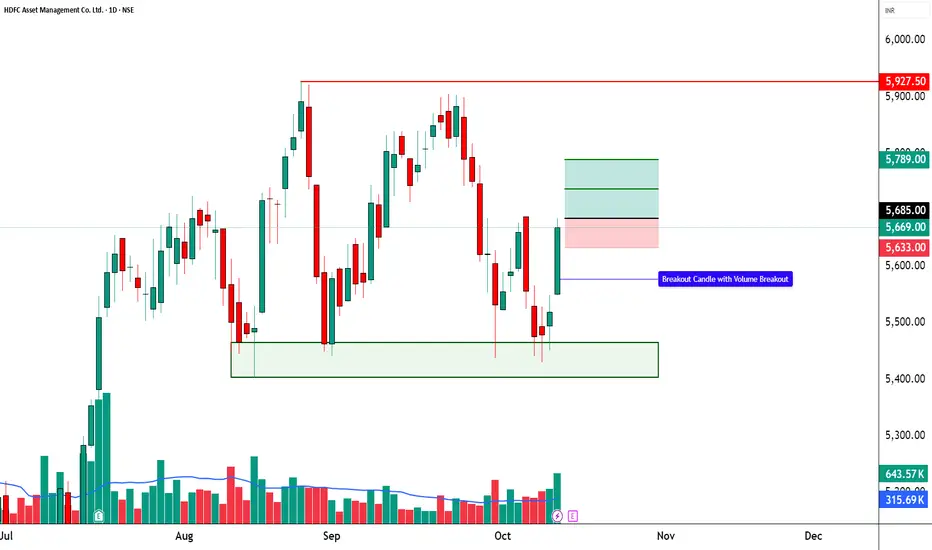
ADANI PORTS | Bullish Momentum + RSI Breakout - STWP________________________________________
📊 ADANI PORTS | Bullish Momentum + RSI Breakout 🚀
Ticker: NSE: ADANIPORTS | Sector: Port & Logistics
CMP: ₹1,437.80
Rating: ⭐⭐⭐⭐ (Bullish Momentum Breakout – For Educational Purposes Only)
Pattern Observed: 📈 Price Action Setup – Breakout from Consolidation Zone
Candlestick Pattern: Strong Bullish Momentum Candle
________________________________________
🟦 Chart Summary
Adani Ports has formed a strong bullish candle on high volume, breaking above a short-term consolidation resistance zone. The structure reflects renewed buying strength and momentum, suggesting a possible continuation toward higher resistance levels in the near term.
________________________________________
🟨 Technical Indicators Summary
The chart highlights Bullish Momentum supported by a Strong Bullish Candle, indicating renewed buying interest. A clear RSI breakout confirms strengthening momentum, while the Bollinger Band Squeeze-On Compression suggests that volatility is contracting — often a precursor to a sharp directional move. This combination of momentum, structure, and volume alignment signals a potential breakout zone, reflecting a powerful setup where multiple indicators converge to reinforce short-term bullish sentiment.
________________________________________
🟩 Supports: 1,408 / 1,379 / 1,362
🟥 Resistances: 1,454 / 1,471 / 1,500
________________________________________
🟩 Swing Trade Study (Educational Viewpoint)
From a technical study perspective, Adani Ports is showing signs of a bullish breakout above ₹1,441.90, which may signal momentum continuation. The reference support for this structure lies near ₹1,387.10, defining the chart-based risk zone of around ₹54.8. This observation is shared only for educational and analytical purposes to demonstrate structured swing analysis.
________________________________________
🟩 Intraday Observation (For Learning Purposes)
For intraday study, the potential bullish breakout zone lies between ₹1,437.80 and ₹1,442, with immediate support around ₹1,424. Any price reaction near ₹1,430–₹1,435 could serve as an educational case for identifying intraday re-entry zones when price retests breakout areas. Traders should always apply strict stop-loss and risk management if trading live.
Final Outlook: Momentum: Strong, Trend: Bullish, Risk: Low, Volume: High
💡 Learning Note:
This case study helps learners understand how volume confirmation, RSI breakout, and price structure alignment can signal early trend continuation opportunities — a key concept in technical market reading.
________________________________________
⚠️ Disclosure & Disclaimer (SEBI-Compliant)
This content is created solely for educational and informational purposes to help readers understand technical analysis and market structure.
It does not constitute investment advice, research recommendation, or a solicitation to buy or sell any security.
The author is not a SEBI-registered investment adviser or research analyst.
All charts, patterns, and levels are based on personal study and historical data available from public sources such as TradingView and NSE India.
Position Status: No active position in ADANIPORTS at the time of publication.
Trading and investing involve risk. Market movements can be unpredictable, and losses may exceed invested capital.
Readers are strongly advised to consult a SEBI-registered investment adviser before making any trading or investment decisions.
By engaging with this post, you acknowledge that you take full responsibility for your own trades, decisions, and outcomes.
________________________________________
💬 Found this useful?
🔼 Boost this post to support structured learning content.
✍️ Share your thoughts, questions, or observations — let’s grow together!
🔁 Share with learners and traders to promote responsible market education.
👉 “If you liked this breakdown, follow for more disciplined, educational trade setups.”
🚀 Stay Calm. Stay Clean. Trade With Patience.
Trade Smart | Learn Zones | Be Self-Reliant 📊
________________________________________
