MOTILALOFS - LongIn this chart, price has formed a lower low near the support zone, but RSI has made a higher low. This is called positive divergence and it shows that selling pressure is weakening even though price dipped. It often appears near the end of a down move.
Near the same area, a Morning Star pattern is visible. First, there is a strong red candle showing panic selling. Then a small candle appears, showing indecision. Finally, a strong green candle closes well into the body of the first red candle, indicating that buyers are stepping in.
What makes this setup more interesting is that it is forming at support, with high volumes, and along with RSI divergence. When price, volume, candles, and momentum align like this, it increases the chances of a short-term reversal or a relief rally.
This is for educational purposes only and not a buy or sell recommendation. Markets involve risk, and always use proper risk management before taking any trade.
Rsidivergence

ALKYLAMINE | Strong RSI divergence since 2024ALKYLAMINE | Strong RSI divergence since 2024
Looks good for big reversal - 30-40% potential for short term
Debt free and stable company

IndiaMArt - Reversal based on RSI CDIndiaMART (NSE) - Technical Analysis & Trade Setup
Current Price: 2,376.70
Trade Setup Overview
This trade setup is based on RSI Classic Divergence combined with Price Action analysis. The stock has shown a bullish divergence pattern on the RSI indicator while forming a potential bottom around the 2,243-2,377 zone.
Entry Strategy
Entry Type: Aggressive Entry (Current levels)
Confirmation Entry: Only initiate trades after candle closing above **2,437** on a 1:2 risk-reward ratio basis.
Target Levels
- Target 1: 2,459.70 (Fibonacci 0.382 level)
- Target 2: 2,593.00 (Fibonacci 0.618 level)
- Target 3: 2,676.65 (Fibonacci 1.0 extension)
**Potential Upside:** 8.5% to 12.6% from current levels
Risk Management
Stop Loss: 2,252.50 (on candle closing basis)
Risk from Current Price: ~5.2%
Technical Indicators
RSI Analysis
- RSI showing classic bullish divergence
- Price made lower lows while RSI made higher lows
- Current RSI around 62.25, indicating bullish momentum
- RSI breaking above previous resistance zones
Fibonacci Retracement Levels
- 0 (2,243.15) - Recent Low
- 0.382 (2,377.00) - Current Support Zone
- 0.618 (2,518.60) - Key Resistance
- 1.0 (2,676.25) - Extension Target
Key Observations
1. Stock has recovered from the October low of 2,243 levels
2. RSI divergence suggests potential trend reversal
3. Price action forming higher lows, indicating accumulation
4. Multiple Fibonacci resistance levels ahead that may act as profit-booking zones
Important Notes
- This is an **aggressive entry** setup for risk-tolerant traders
- Conservative traders should wait for confirmation above 2,437
- **Strictly maintain stop loss** on closing basis below 2,252.50
- Book partial profits at each target level
- Trail stop loss as price moves in your favor
- Monitor RSI for any bearish divergence at higher levels
Disclaimer
This analysis is for educational purposes only. Please do your own research or consult with a financial advisor before making any investment decisions. Past performance does not guarantee future results.
**Follow for more technical analysis and trade setups!**
#IndiaMART #TechnicalAnalysis #StockMarket #Trading #RSIDivergence #FibonacciTrading #NSE

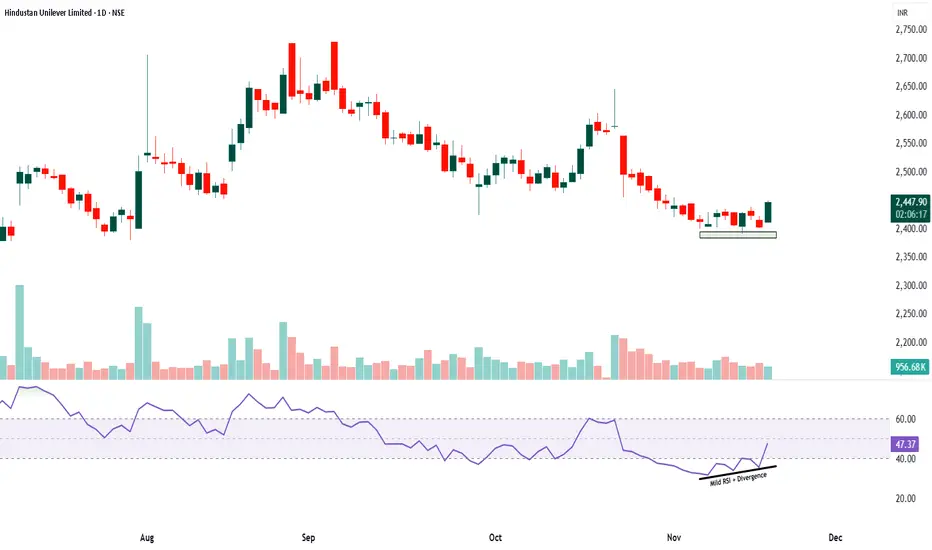
HINDUNILVR - longThe chart shows a mild RSI divergence where the price made a lower low near the 2400 zone while RSI formed a higher low, indicating that the selling momentum is reducing even though the price slipped slightly. This zone also aligns with a strong weekly support area where the stock has earlier taken reversal, adding more weight to the possibility of a bounce from this level. Volumes have remained on the lower side during the recent fall, suggesting that the decline was not driven by strong selling pressure. The latest green candle near support with improving RSI momentum indicates that buyers are slowly stepping in.
A possible trade plan can be to take entry above 2460 once the price shows continued strength. A safe stop loss can be placed below 2385, just under the weekly support zone. The first target can be around 2520, where minor resistance exists, and the second target can be around 2580 if momentum continues to build. This setup works best if RSI moves above 50 and volumes start rising on bullish candles. This is for educational purposes only.
#xuausd Make or Break - Gold Analysis🥇 GOLD (XAU/USD) - Technical Analysis & Outlook
Timeframe: 4H & Daily Charts
Current Price: 2,718.99
Market Structure Analysis
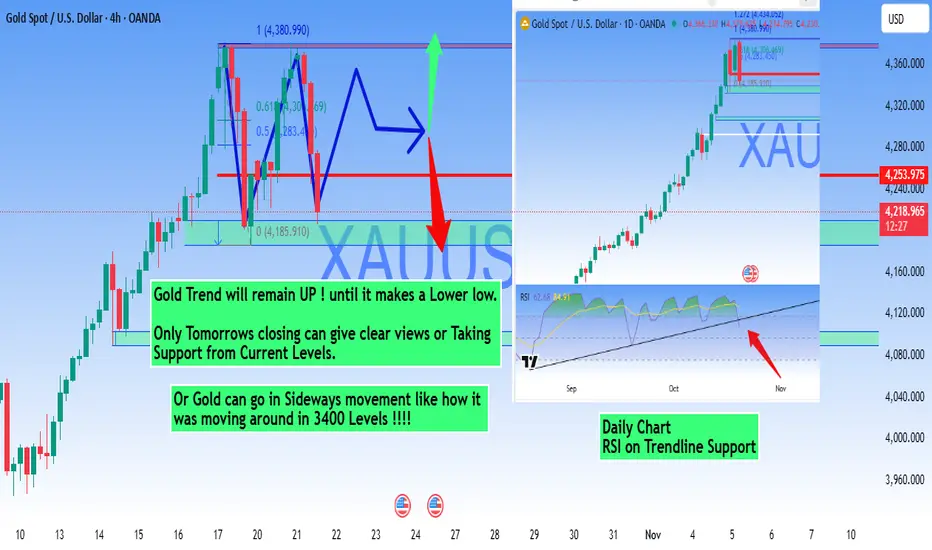
Gold is currently in a **strong uptrend** and will maintain its bullish bias until it forms a clear lower low. The recent consolidation near all-time highs suggests a potential for either continuation or a sideways movement phase.
Key Price Levels
Support Zones
- Immediate Support: 4,218.99 - 4,240.00
- Major Support: 4,185.91 (0 Fibonacci - Recent Low)
- Critical Support: 4,160.00 - 4,180.00 zone
Resistance Zones
- Immediate Resistance: 4,253.97 (Current High)
- Next Resistance: 4,280.00 - 4,300.00
- Target Extension: 4,320.00 - 4,360.00
- Major Target: 4,380.99 (Fibonacci Extension)
Technical Scenarios
- Continuation of the current uptrend expected
- Any pullback to support zones presents buying opportunities
- Target: 4,280 - 4,360 zone
- Extended Target: 4,380+ levels
Consolidation Scenario (Secondary)
Condition: Sideways movement similar to the 3,400 consolidation phase
- Gold may enter a ranging phase at current elevated levels
- Watch for sideways movement between 4,200 - 4,280
- Accumulation pattern before next leg up
- Patience required during this phase
🔴 Bearish Scenario (Alternative)
Condition: Only if price breaks and closes below 4,185
- Bearish only on confirmed break of structure
- Potential retracement to $4,160 or lower
- Wait for clear reversal signals before shorting
RSI Analysis (Daily Chart)
- RSI Position: Near trendline support (around 62)
- Signal: RSI holding above trendline support indicates continued bullish momentum
- Watch For: RSI breakdown below trendline would signal weakening momentum
- Strength: RSI still in bullish territory, no divergence observed
Key Observations
1. **Strong Uptrend Intact:** No lower lows formed yet, trend remains bullish
2. **Fibonacci Levels:** Price respecting key Fibonacci retracement zones
3. **Consolidation Pattern:** Similar behavior to previous $3,400 consolidation
4. **Volume Profile:** Accumulation visible near support zones
5. **Daily RSI:** Holding trendline support, maintaining bullish structure
Critical Points to Monitor
🔸 22/10/2025 Close: Will provide clearer direction
🔸 Support Level: 4,218 - Must hold for bullish continuation
🔸 RSI Trendline: Break would signal momentum shift
🔸 Volume: Watch for increasing volume on moves
🔸 Global Events: Fed policy, geopolitical tensions, USD strength
🎓 #Trading Wisdom
"The #trend is your friend until it bends. #Gold will remain #bullish until it makes a #lowerlow. Stay patient, follow the structure, and let the market show its hand."*
Risk Disclaimer
This analysis is for educational purposes only and should not be considered financial advice. Always manage your risk appropriately, use stop losses, and never risk more than you can afford to lose. Past performance does not guarantee future results.
Like and Follow for Daily Gold Analysis!
#Gold #XAUUSD #GoldTrading #TechnicalAnalysis #ForexTrading #PreciousMetals #TradingView #MarketAnalysis
PGEL: Suggest Momentum ShiftPG Electroplast Ltd. (PGEL) has recently shown signs of emerging strength after a prolonged phase of consolidation. Over the last two trading sessions, the stock has demonstrated upward momentum, suggesting a possible attempt to break out of its range-bound structure. This observation is supported by several technical factors:
1. Moving Averages & Volume Dynamics
The stock has successfully closed above the 20-day EMA, indicating short-term bullish sentiment.
It is currently trading near the 50-day EMA, although it has not yet closed above this level. The recent price movement has been accompanied by increased trading volume, which may reflect growing market participation.
2. Change of Character (CHOCH)
The break above the 20-day EMA, despite the price not closing above the 50-day EMA, may signal a CHOCH. This is often interpreted by technical analysts as a potential shift in trend direction, particularly from bearish to neutral or bullish.
3. RSI Momentum
The RSI has moved above the 60 level, suggesting strengthening momentum. This level is typically viewed as a transition zone between neutral and bullish conditions.
4. MACD Signal
A bullish crossover on the MACD indicator has occurred on the daily timeframe. This crossover may indicate a potential shift in momentum, especially when supported by price structure and volume.
Breakout Confirmation Level:
A sustained close above ₹597 could be interpreted as a breakout from the consolidation zone. If this level is cleared with volume support, the next potential resistance may lie near ₹712 , based on historical price action. The lower boundary of the recent consolidation zone, around ₹494 , may act as a support level. This area could be monitored for potential retests or invalidation of the breakout attempt.
Disclaimer: This analysis is intended for educational and informational purposes only. It does not constitute investment advice or a recommendation to buy, sell, or hold any financial instrument. Market participants are encouraged to conduct their own research and consult with a licensed financial advisor before making any investment decisions.

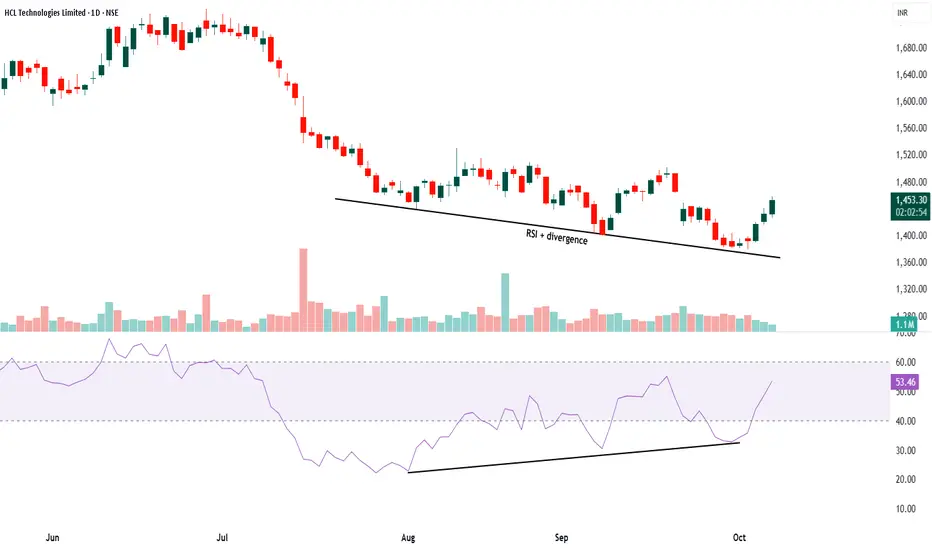
HCL TECH - RSI positive divergenceRSI positive divergence is a powerful technical analysis signal that indicates a potential trend reversal from bearish to bullish. Here's a simple step-by-step explanation for your community members:
Understand RSI: The Relative Strength Index (RSI) measures the speed and change of price movements on a scale of 0 to 100. Values below 40 typically indicate an oversold market, while values above 60 suggest an overbought market.
Spot the price trend: Look at the stock price chart. If the price is making lower lows (falling prices) over time, it indicates a downtrend.
Observe the RSI behavior: While the price is making lower lows, check the RSI indicator below the price chart. In RSI positive divergence, the RSI makes higher lows.
What is RSI positive divergence? It's when the price hits new lows, but RSI doesn't follow and instead forms higher lows. This shows weakening selling pressure and suggests buyers may soon take control.
Interpretation: RSI positive divergence signals the existing downtrend may be losing momentum, making it likely for the price to reverse upwards.
Confirmation: Traders often wait for additional bullish signals or a price breakout to confirm the reversal before entering long positions.
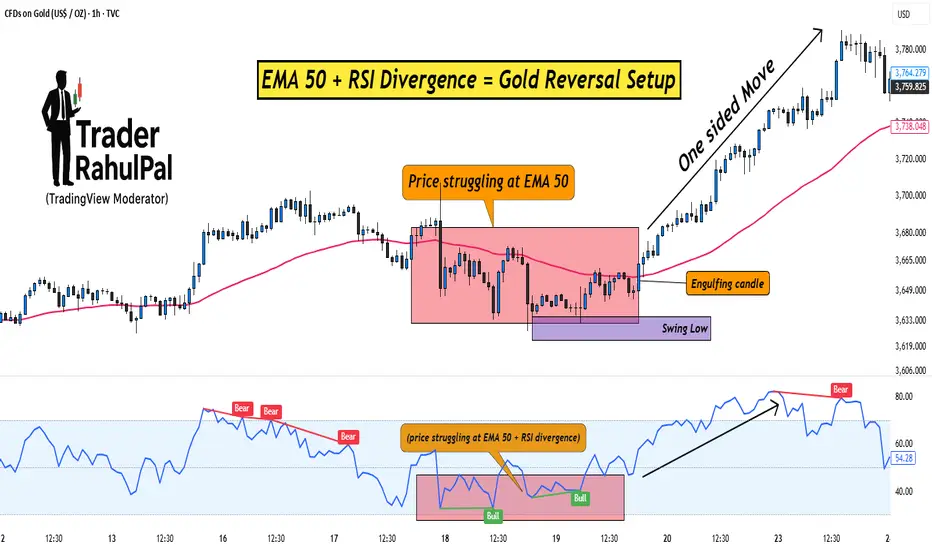
EMA 50 + RSI Divergence = Gold Reversal Setup!Hello Traders!
Gold often makes sharp one-sided moves, trapping traders who enter too late. But if you know how to combine a simple moving average with a momentum indicator, you can spot high-probability reversal setups.
One such method is using the EMA 50 together with RSI Divergence . Let’s break down how it works.
1. Why EMA 50?
The 50-period EMA acts as a dynamic trend filter.
When gold trades above it, the short-term trend is bullish; below it, bearish.
Price often retests the EMA 50 during pullbacks, making it a key level to watch for reversals.
2. What is RSI Divergence?
Divergence happens when price makes a new high/low, but RSI doesn’t confirm it.
Example: Price makes a higher high, but RSI makes a lower high → bearish divergence.
This signals that momentum is weakening, even if price is still moving strongly.
3. Combining EMA 50 with RSI Divergence
First, check where price is relative to EMA 50.
Next, look for divergence on RSI near that zone.
If both align (price struggling at EMA 50 + RSI divergence), chances of a reversal increase sharply.
4. Entry & Risk Management
Wait for a confirmation candle near EMA 50 (like engulfing or pin bar).
Place stop loss just above recent swing high/low.
Target the next support/resistance zone for exits.
Rahul’s Tip:
Don’t use divergence alone, combine it with EMA 50 for structure and you’ll filter out most false signals. This setup works best on higher timeframes like 1H or 4H for gold.
Conclusion:
EMA 50 gives you the trend filter, and RSI divergence reveals momentum weakness.
Together, they form a reliable reversal setup that helps you enter gold trades at the right time instead of chasing moves.
This Educational Idea By @TraderRahulPal (TradingView Moderator) | More analysis & educational content on my profile
If this post gave you a new setup idea, like it, share your thoughts in comments, and follow for more practical trading strategies!
Mazdock Long - Technical AnalysisMAZDOCK Technical Analysis Summary
Current Price : 2,985.00
Technical Reasons to Pick MAZDOCK
1 - Dow Theory Confirmation
- Higher Highs (HH) - Higher Lows (HL)
- Clear uptrend structure maintained
2 - EMA Support Structure - Took support from 100 EMA on a weekly Timeframe
- Trading above sorted EMA 100/200
- Strong momentum indication
- Bullish reversal from key moving average
4 - A clear Hidden RSI Divergence
- Indicates continuation of uptrend
- Target 1 : 3,240.00
- Target 2 : 3,502.30
- Target 3 : 3,774.00
- Grand Target : 4,094.00
Risk Management
Watch for sustained break below 100 EMA for trend reversal
Overall Bias : BULLISH
Strategy : Buy on dips near EMA support levels.

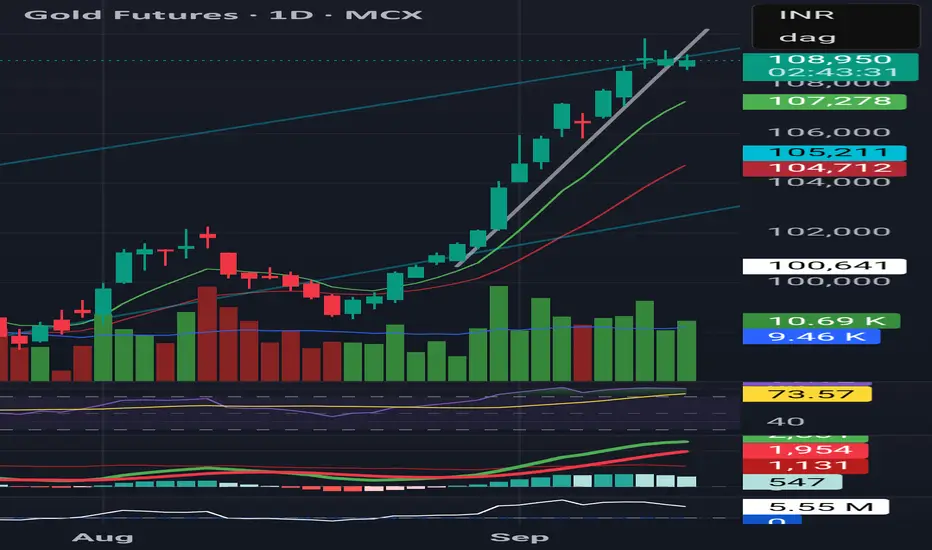
Technical View – Gold Futures (MCX)Trend: Sharp rally extended, but now showing pause with doji candles at the top.
Volume: Trendline breakout earlier came with strong participation; latest candles show reduced conviction.
Momentum: RSI near 74 → overbought, but stabilizing. MACD still positive, histogram flattening → signs of momentum cooling.
Support Levels: ₹107,250 (short-term EMA), ₹105,200 (swing support).
Bias: Rally intact, but risk of sideways/consolidation phase unless fresh volume confirms continuation.
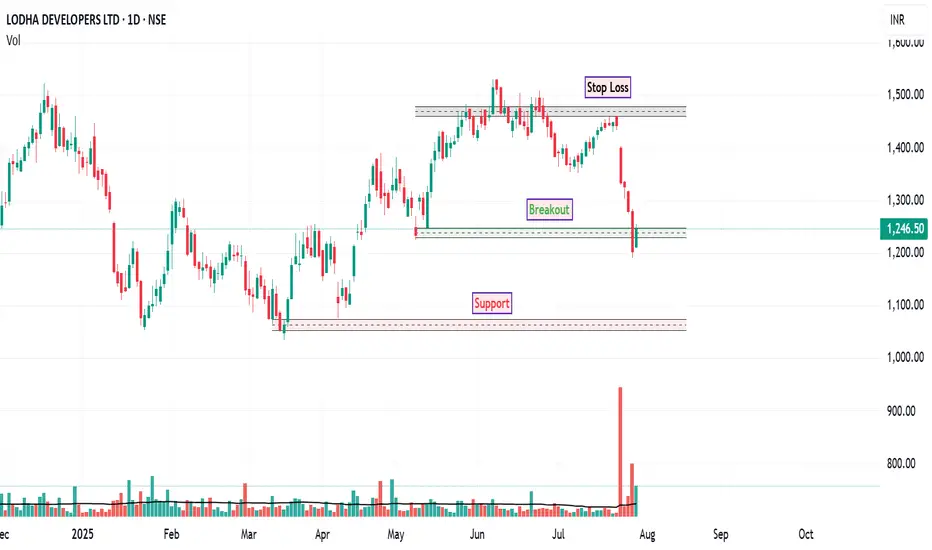
LODHA: Assessing the Bearish TrendThe stock of LODHA is in a technically confirmed downtrend. The inability of the price to overcome previous peaks, followed by successful breaks below prior lows, confirms a persistent supply overhang. This structure will be considered intact as long as the price remains below its key overhead resistance levels.
Key moving averages 20, 50-day EMAs are acting as dynamic resistance. The price is trading below these averages, and they are often observed to be sloping downwards. Rallies toward these moving averages have consistently been met with renewed selling pressure, reinforcing their significance as a ceiling for the current trend.
Based on the current bearish structure, the levels, which are marked on the accompanying chart, are critical for navigating the potential price trajectory.
(Please refer to the attached chart for a visual representation of these levels)
Disclaimer:
The information provided in this technical analysis is for informational and educational purposes only and should not be construed as financial or investment advice. It is an interpretation of historical price data. Market dynamics can change, and past performance is not indicative of future results. All trading and investment activities involve risk. Always conduct your own thorough due diligence and consult with a qualified financial advisor before making any investment decisions.
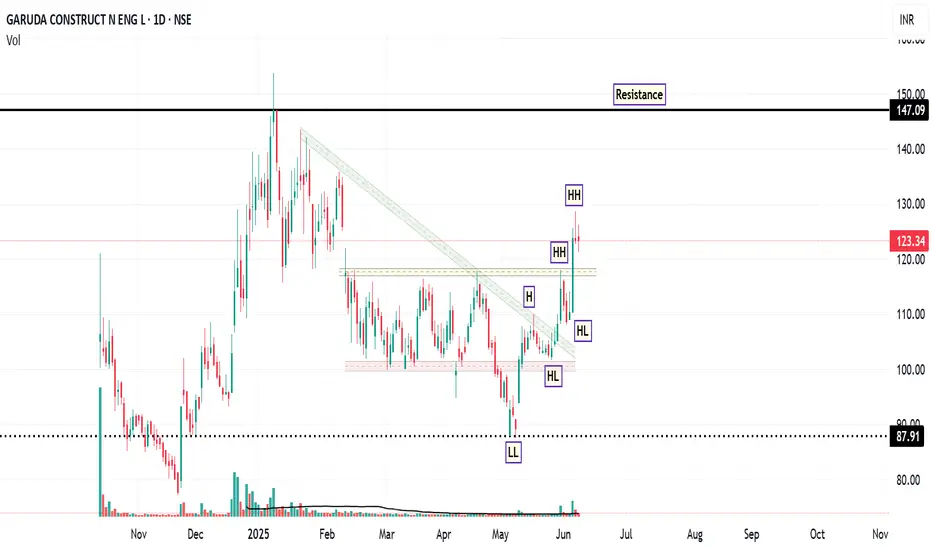
Garuda: Riding the Momentum WaveFrom February to late May 2025, the stock of GARUDA was trading in a sideways consolidation range, roughly between ₹100 (support) and ₹115-₹120 (resistance). The recent powerful green candles have shattered the upper boundary of this range. Also, the most significant event on the daily chart is the decisive breakout from a descending trendline that had capped prices. Also, LL and HH formation observed on daily chart.
The breakout was accompanied by a significant spike in volume ( 862.88K shares ), which is substantially higher than the average volume during the consolidation period. High volume on a breakout lends strong credibility to the move.
The RSI is at a strong 69.20 . It is in bullish territory and rising, indicating strong buying momentum. It is approaching the overbought region (>70), but is not there yet, leaving room for further upside before becoming extended.
If the stock consolidates above the ₹120-₹121 support level. Buyers step in on any minor dip till ₹118 , and the price then continues its upward trajectory towards the resistance targets of ₹129 and subsequently ₹149 .
Disclaimer: This technical analysis is for informational purposes only and should not be considered as financial advice. Trading in the stock market involves risk. Always conduct your own research and consult with a qualified financial advisor before making any investment decisions.
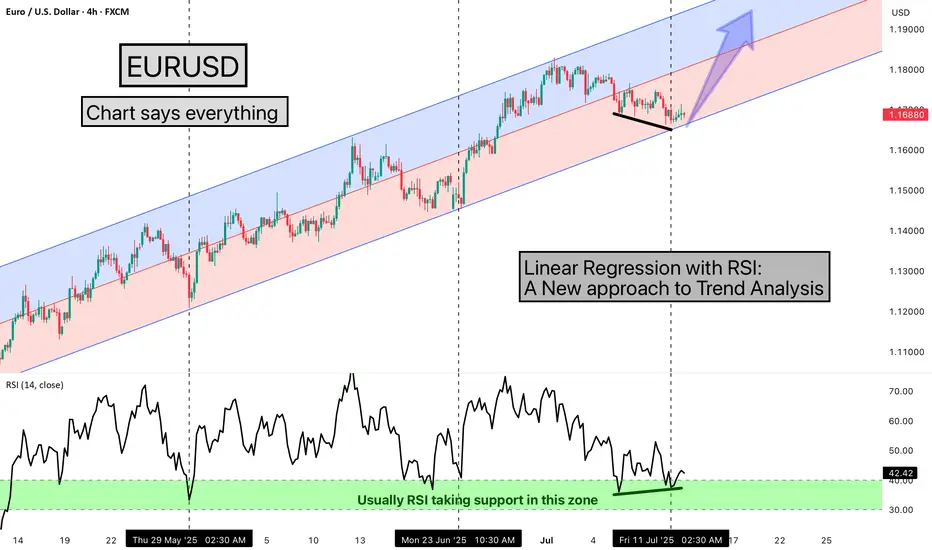
Linear Regression with RSI: A New approach to Trend AnalysisHello Friends,
Welcome to RK_Chaarts,
Today we are going to learn one Method of analysing the chart, here we are using EURUSD chart, and the method we're using is very simple & interesting, We are using the Linear Regression Trend Channel & Relative Strength Index (RSI), What happens in this method, is that we identify a particular zone where the price is making a one-sided move, like if the price is trending upwards, making higher highs and higher lows. We then apply a regression channel to it, and within that channel, we set internal deviation for the upper and lower sides, like 2 or 2.5 or 3 etc., whatever setting it takes.
In this chart, we can clearly see that the 2.5 setting is forming a complete channel, which we've applied for the last two months, from 12th May 2025, when the uptrend started. We've used the 4-hour time frame chart and the RSI. Every time the price hits the bottom of the channel, we can see that the RSI also enters the same zone, between 30-40, and from there, it bounces back.
Currently, the price has again hit the bottom of the regression channel, and the RSI has also gone below 40, between 30-40. And the good thing is that we're seeing a positive divergence in the RSI. So, there's a high possibility that the price might bounce back from here.
It's worth watching what happens next in the market. Nothing is guaranteed here; everything is a game of probabilities. This is one method that we often use, and its results have given us a very good experience. So, let's see what happens next in this chart. This observation is also a good learning experience, which we often encounter, 7-8 times out of 10, in favor of the market, but sometimes it doesn't work, maybe 2-3 times, when the trend changes. So, let's see what happens next.
This post is shared purely for educational purpose & it’s Not a trading advice.
I am not Sebi registered analyst.
My studies are for educational purpose only.
Please Consult your financial advisor before trading or investing.
I am not responsible for any kinds of your profits and your losses.
Most investors treat trading as a hobby because they have a full-time job doing something else.
However, If you treat trading like a business, it will pay you like a business.
If you treat like a hobby, hobbies don't pay, they cost you...!
Hope this post is helpful to community
Thanks
RK💕
Disclaimer and Risk Warning.
The analysis and discussion provided on in.tradingview.com is intended for educational purposes only and should not be relied upon for trading decisions. RK_Chaarts is not an investment adviser and the information provided here should not be taken as professional investment advice. Before buying or selling any investments, securities, or precious metals, it is recommended that you conduct your own due diligence. RK_Chaarts does not share in your profits and will not take responsibility for any losses you may incur. So Please Consult your financial advisor before trading or investing.
PepsiCo (PEP): A Potential Shift from Downtrend
Following a prolonged corrective phase that commenced in March 2025, PepsiCo's price action is exhibiting noteworthy signs of a potential bullish reversal. A significant breakout from a multi-week consolidation range on the daily timeframe suggests a possible shift from distribution to accumulation. This hypothesis is supported by strengthening momentum indicators and the reclamation of a key moving average, warranting a closer look at key technical levels.
Detailed Technical Analysis:
1. Price Action: Breakout from Consolidation
After establishing a clear downtrend, PEP entered a period of consolidation, forming a well-defined trading range with a base near the $127 level. Today's session saw a decisive breakout above the upper boundary of this range. Such a move often indicates an exhaustion of selling pressure and an influx of demand. For this bullish thesis to gain further conviction, continued closes above this breakout zone would be constructive. The quality of this breakout would be further substantiated by an accompanying surge in trading volume, which signals significant market participation.
2. Momentum Analysis: RSI Indicating Renewed Buying Interest
Daily RSI: The RSI on the daily chart has surged to 62. A move above the 60 level typically suggests that bullish momentum is accelerating and is now in a strong position.
Weekly RSI: On the weekly timeframe, the RSI has advanced above 42. While still below the key 50 midline, this upward trajectory from oversold territory indicates a notable waning of long-term bearish momentum and may be an early sign of a strengthening trend.
3. Trend Analysis: Reclamation of the 50 EMA
The stock has successfully achieved a close above its 50-Day EMA. This moving average is a widely watched indicator for the medium-term trend. For much of the recent downtrend, the 50 EMA acted as dynamic resistance. By reclaiming this level, it suggests a potential shift where it may now serve as dynamic support during any subsequent pullbacks.
Potential Forward Outlook & Key Levels to Monitor:
Primary Area of Resistance: The $143 zone stands out as the first significant technical hurdle. This level could coincide with prior price structure and may attract initial profit-taking from short-term traders.
Secondary Area of Resistance: Should the momentum carry the price decisively through the primary resistance, the next major level of interest appears to be around $158 . This area represents a more significant structural resistance from the preceding downtrend.
Area for Risk Management: The zone below $127 is a critical area to monitor. This level represents the floor of the recent consolidation base. A sustained break below this level would potentially invalidate the bullish breakout hypothesis and suggest a continuation of the prior downtrend.
Disclaimer: The information provided in this technical analysis is for informational and educational purposes only and should not be construed as financial or investment advice. It is an interpretation of historical price data and technical indicators. Market dynamics can change, and past performance is not indicative of future results. All trading and investment activities involve substantial risk. Always conduct your own thorough due diligence and consult with a qualified financial advisor before making any investment decisions.

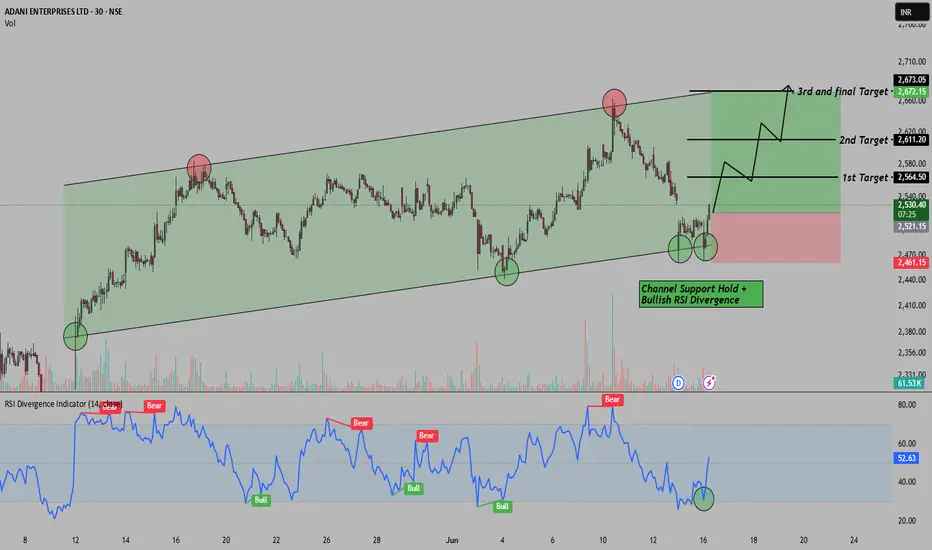
Rising Channel+RSI Divergence=Reversal Setup in Adani EnterpriseHello Everyone, i hope you all will be doing good in your life and your trading as well. Today i have brought a setup in Adani Enterprises , where we’re spotting a short-term reversal opportunity inside a clean rising channel . Price recently tested the channel support for the 3rd time and gave a solid bounce, which is also confirmed by a bullish RSI divergence . This combo often works as a reliable early reversal signal for positional or intraday swing traders. Here we are expecting at least 4%+ move behalf of this setup.
This trade is completely logic based so i placed Stop loss around 2461 for controlled risk. for the targets please check the chart above i have mention there.
Reward-to-Risk Ratio looks favorable here , especially with clear trend structure and momentum support from RSI. Let’s see how this setup plays out!
If you liked this breakdown, don’t forget to LIKE & FOLLOW for more real chart setups, data-backed ideas, and smart money zones.
Disclaimer: This post is for educational purposes only. Do your own research or consult a financial advisor before investing.
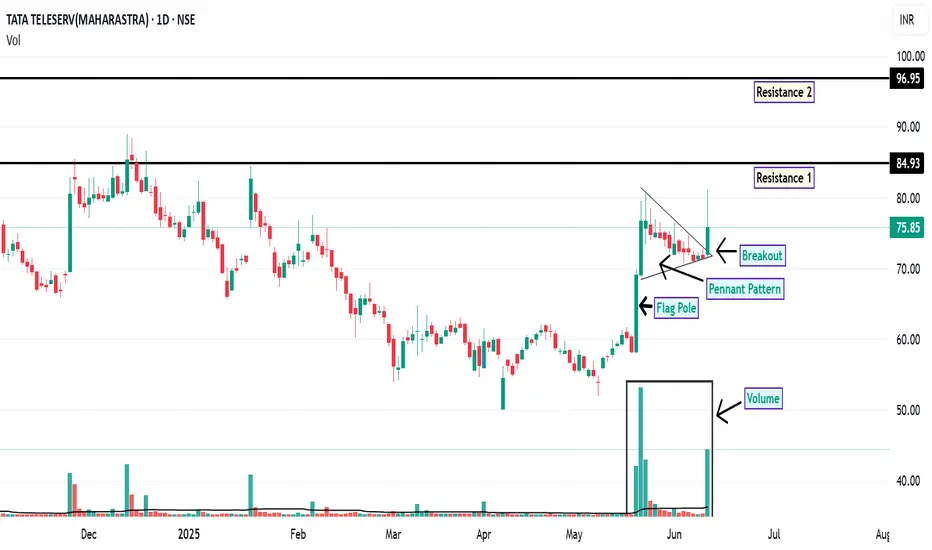
TTML: Pennant Breakout Signals Potential Upside
On the daily chart, TTML has recently exhibited a breakout from a pennant formation , a pattern often associated with potential continuation of the prevailing trend. This breakout is accompanied by a notable increase in trading volume, which may indicate growing market interest and participation.
Additionally, the price action has shown support at the 200-day EMA, a widely observed long-term trend indicator. This confluence of technical signals may suggest a strengthening bullish sentiment.
From a momentum perspective, both the RSI and MACD indicators are currently positioned in bullish territory on both the daily and weekly timeframes. This alignment across multiple timeframes can be interpreted as a sign of potential trend continuation.
Looking ahead, the price may revisit the ₹75 level, which could act as a demand zone. Should the stock manage to close and sustain above ₹76.40 , the next potential resistance levels to monitor are around ₹84.93 and ₹96.95 . For risk management, a suggested stop-loss level could be considered below ₹62 , based on recent support structures.
Disclaimer: This analysis is intended solely for informational and educational purposes. It does not constitute investment advice or a recommendation to buy or sell any financial instrument. Market participants are encouraged to conduct their own research or consult with a licensed financial advisor before making any investment decisions.
Tirumalai: The Anatomy of a BreakoutOn the daily chart, TIRUMALCHM appears to be approaching a potential breakout from an ascending triangle pattern, a formation often associated with bullish continuation. Notably, the price has managed to close above all key EMAs, including the 200-day EMA, which is widely regarded as a long-term trend indicator.
From a momentum perspective, both the RSI and MACD indicators are showing strength on the daily and weekly timeframes. These signals may suggest the early stages of a sustained upward trend, contingent on broader market conditions and follow-through price action.
Given the current technical setup, the stock may be considered for gradual accumulation near the CMP. Alternatively, more conservative participants might prefer to wait for a potential retest of the breakout zone in the coming sessions, which could offer a more favourable risk-reward entry with a next long term resistance of ₹340 .
A technical invalidation level could be considered below the ₹251 mark, depending on individual risk tolerance and trading strategy.
Disclaimer: This analysis is intended solely for educational and informational purposes. It does not constitute investment advice or a recommendation to buy or sell any financial instrument. Market participants are strongly encouraged to conduct their own research or consult with a qualified financial advisor before making any investment decisions.

Jayshree Tea: A Worthy Stock Pick!The chart of JAYSHREETEA provides delineates critical price thresholds that signify breakout points, along with specific support levels that serve as indicators of where buying interest may manifest.
Additionally, the chart highlights regions likely to act as ceiling points for future price ascensions, allowing for informed decisions on entry and exit strategies.
Disclaimer: The information contained in this technical analysis report is intended solely for informational and educational purposes. It should not be interpreted as financial advice or a recommendation to buy or sell any security. Investors are strongly encouraged to conduct their own research and consult with a qualified financial advisor before making any investment decisions.

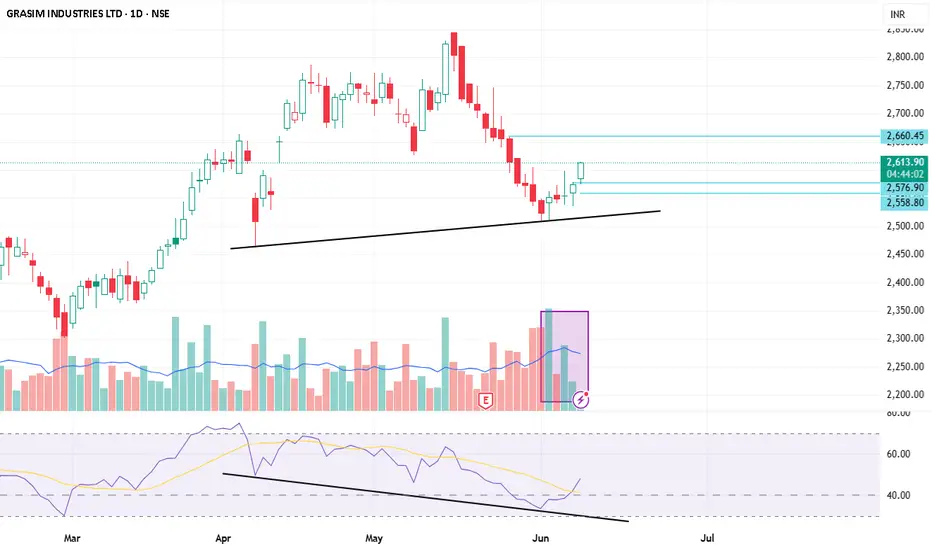
Grasim RSI Divergence observedRSI divergence observed on Grasim Stock with good volume. Add to watchlist and observe for the net movements.
SERVOTECH: Volume Surge Signals StrengthAn analysis of the weekly chart for SERVOTECH indicates a noteworthy technical development. The security has exhibited a breakout above a key pivot level previously identified around the 148 price zone.
This price action was accompanied by a substantial volume surge. The weekly volume registered approximately 34 million shares, a figure representing a more than five-fold increase compared to its 50W moving average of volume. Such a significant expansion in volume on a breakout can suggest strong institutional interest and conviction behind the move.
Further supporting a bullish outlook of RSI is situated above the 60 level on both the weekly and daily timeframes. A confluence of strong RSI readings across multiple timeframes is often interpreted by market participants as a sign of robust and broad-based upward momentum.
Based on this technical structure, the following price levels may be of interest for observation:
From a strategic standpoint, the stock may present a potential accumulation zone around the 150 level. The 195 level is identifiable as the next area of potential overhead supply, or resistance, where selling pressure might emerge. From a risk management perspective, a breach of the 136 level could challenge the validity of the recent bullish structure and might be monitored accordingly.
Disclaimer: The information provided in this stock analysis is for informational and educational purposes only and should not be construed as financial advice. Always seek the advice of a qualified financial advisor or conduct your own thorough research before making any investment decisions. Market conditions are dynamic, and past performance is not indicative of future results.

YESBANK: Riding the Bullish WaveYes Bank has exhibited a notable breakout above the resistance level established in December 2024. This breakout is accompanied by a classic flag pattern formation, which has resolved to the upside—typically interpreted by technical analysts as a continuation signal within an existing trend.
A significant increase in trading volume during the breakout phase adds weight to the move, suggesting heightened market participation. Furthermore, the 20-day EMA has crossed above the 200-day EMA, a crossover often referred to as a "Golden Cross" , which is generally viewed as a bullish signal indicating potential for continued upward momentum.
The RSI is currently positioned above 60, reflecting sustained buying interest without yet entering overbought territory.
From a structural perspective:
Immediate resistance may be encountered near the 24.75 level.
A secondary resistance zone appears around 28.54.
On the downside, the stock seems to have established a support base near 19.54, which could act as a cushion in the event of a pullback.
Disclaimer:
This analysis is intended solely for informational and educational purposes. It does not constitute investment advice, a recommendation, or an offer to buy or sell any securities. Market conditions can change rapidly, and all trading involves risk. Individuals should conduct their own due diligence or consult with a qualified financial advisor before making any investment decisions.

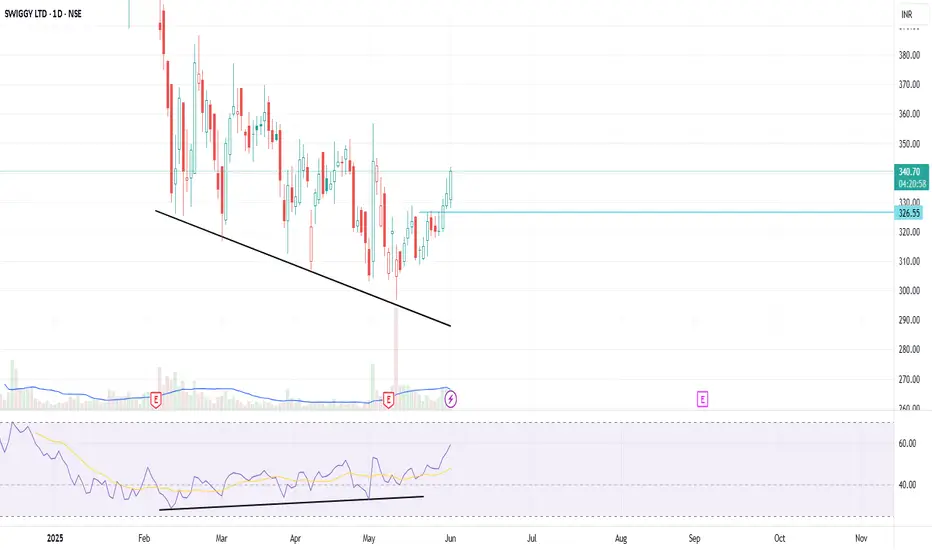
RSI Divergence on Swiggy Daily Time frameRSI divergence marked on above chart in daily time frame.
Entry price: 326
Currently price is on 340 , which is 4% above the entry level.
TG : 10 %
Technical Analysis of Pennar Industries LtdAfter a prolonged period of two months characterized by a downward trend, Pennar Industries has recently exhibited bullish momentum with notable breakouts. An analysis of the daily chart reveals a significant trendline breakout, accompanied by increased trading volume, which has facilitated a close above the 50-day EMA. This development is a positive indicator for potential upward movement.
Additionally, the RSI has also shown a breakout, moving above the pivotal 50 level, which traditionally signals a shift towards bullish territory. The MACD has provided further confirmation of this bullish sentiment, with a crossover being observed, and the MACD histogram now reflecting positive values.
In terms of potential price levels, it is important to note that the stock may encounter resistance around the ₹183 mark, followed by another resistance level at ₹204 . Conversely, strong support is identified at the ₹152 level, which could serve as a safety net for investors in case of price retracement.
Disclaimer: The insights provided in this analysis are for informational and educational purposes only and should not be interpreted as financial advice. It is recommended that individuals consult with a qualified financial advisor or conduct their own comprehensive research before making any investment decisions.
