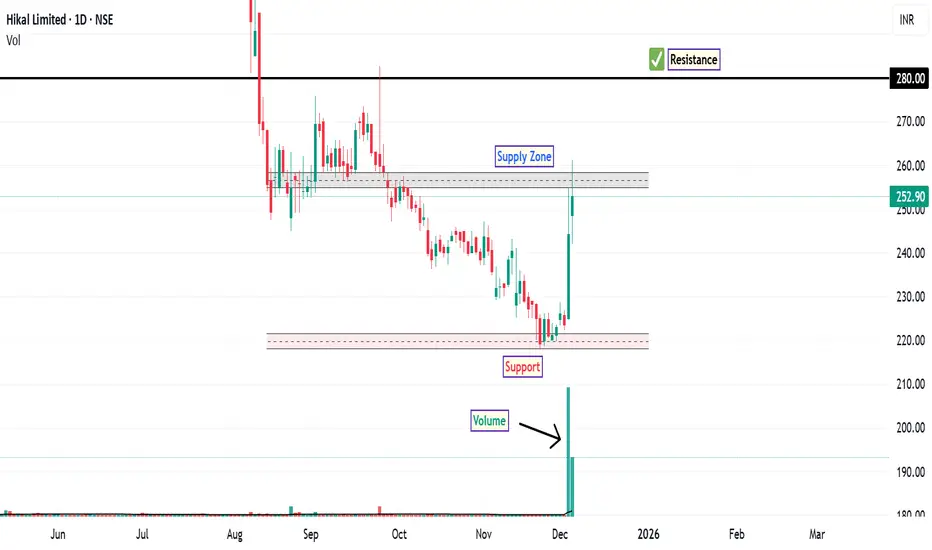
Hikal: Trend Shift and Key LevelsThe stock of Hikal Ltd . experienced a significant breakdown below its major support level of ₹331 in July, marking a continuation of its bearish phase. After testing the discount zone which is now major support zone, the stock rebounded sharply with high trading volume, signaling renewed buying interest and possible accumulation.
A CHOCH pattern has been observed, which often suggests a shift from bearish to bullish structure when confirmed by price and volume behaviour. The stock has managed to close and sustain above the 50-day EMA, a key indicator of short-term trend strength and potential continuation of the uptrend.
The RSI is currently above 65, indicating strong bullish momentum and approaching overbought territory. A MACD bullish crossover along with a positive histogram further reinforces the upward bias.
Nearest Resistance: Around ₹280 (marked supply zone where selling pressure may emerge)
Support Zone: Below ₹217 (critical level for trend validation)
Intermediate Demand Zone: Recent breakout area near the 50-DEMA
Disclaimer: This analysis is intended for educational and informational purposes only. It does not constitute investment advice or a recommendation to buy, sell, or hold any financial instrument. Traders and investors should conduct independent research and consult a licensed financial advisor before making any decisions.
Rsioverbought
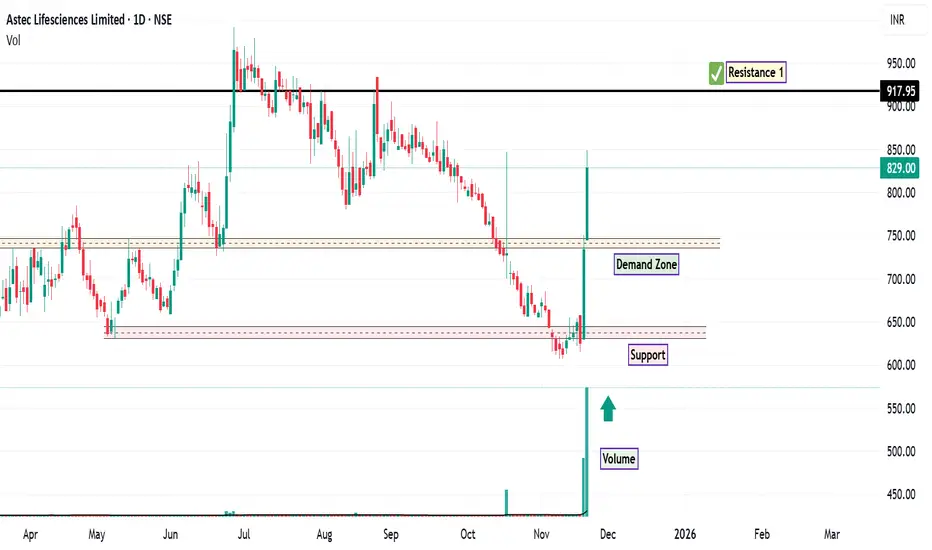
ASTEC: Momentum Surge and Key LevelsThe stock of ASTEC has shown significant strength over the last two trading sessions, recording an impressive 30% gain accompanied by strong volume. This sharp upward movement is supported by multiple technical indicators, suggesting a shift in market sentiment.
The stock has managed to close above the 200-day EMA with substantial volume. Historically, such a breakout is considered a strong bullish signal, indicating potential trend reversal or continuation.
A bullish MACD crossover has occurred on the daily timeframe, with a positive histogram reinforcing upward momentum. This alignment of indicators often signals sustained buying interest.
The RSI currently stands at 72, placing it in the overbought zone. This is notably above the 14-day average RSI of 62, suggesting that while momentum is strong, a short-term retracement could occur. Based on price structure, a retracement toward ₹745 may act as a demand zone, where buyers could re-enter if the stock consolidates.
Immediate Demand Zone: Around ₹745
Next Resistance: ₹917 (historical level based on prior price action)
Support Zone: Below the marked demand zone on the chart
Disclaimer: This analysis is intended for educational and informational purposes only. It does not constitute investment advice or a recommendation to buy, sell, or hold any financial instrument. Market participants should perform their own due diligence and consult with a licensed financial advisor before making any investment decisions.
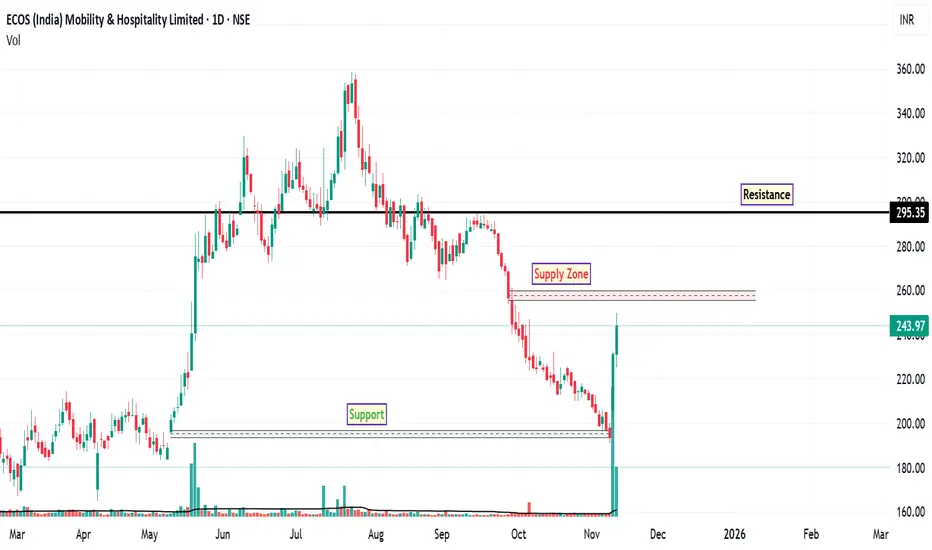
ECOSMOBLTY: Potential Reversal SignalsThe daily chart of ECOSMOBLTY indicates early signs of a possible bullish reversal following a prolonged bearish trend. Recent price action suggests renewed buying interest, supported by multiple technical factors.
The stock has rebounded from a long-term support level near ₹191 , accompanied by higher-than-average trading volume. This combination often signals increased market participation and potential trend reversal.
A bullish crossover on the MACD has been observed on the daily timeframe. This momentum-based indicator often suggests a shift from bearish to bullish sentiment when confirmed by price and volume.
The RSI has moved above 62, indicating strengthening bullish momentum. While not yet in overbought territory, this level reflects improving trend strength.
There is a notable supply zone around ₹257 , which may act as an interim resistance. Price could consolidate or retrace near this level before attempting further upward movement.
Immediate Resistance: ₹257 (potential supply zone)
Major Resistance: ₹295 (historical level based on prior price action)
Support Zone: ₹191 (long-term support and invalidation level for bullish setup)
Disclaimer: This analysis is intended for educational and informational purposes only. It does not constitute investment advice or a recommendation to buy, sell, or hold any financial instrument. Market participants should conduct independent research and consult with a licensed financial advisor before making any investment decisions.
Sigachi’s Technical Surge: Next Resistance in SightOver the past month, Sigachi traded within a well-defined consolidation range, reflecting a period of equilibrium between buyers and sellers. However, in the most recent week, the stock decisively broke out above this consolidation zone on increased trading volume a classic signal of renewed bullish momentum and heightened market interest.
From a trend perspective, the stock has managed to close above all key daily EMAs. Notably, a bullish crossover between the 20-day and 50-day EMAs has emerged, which is often interpreted by technical analysts as a sign of strengthening upward momentum.
Momentum indicators further reinforce this view. The RSI is currently above 75, placing the stock firmly in the overbought territory. While such elevated RSI levels can sometimes precede short-term corrections, they also reflect strong underlying demand during robust uptrends. This bullish sentiment is further supported by a MACD crossover on the weekly chart, which typically signals a continuation of upward price action.
At present, the stock is encountering a minor supply zone (as marked on the chart), which may serve as a near-term resistance. Should the price retrace and find support at the previously identified demand zone, the next potential resistance level is observed around ₹56 .
Disclaimer: This analysis is intended solely for educational and informational purposes. It does not constitute investment advice or a recommendation to buy, sell, or hold any financial instrument. Market conditions are dynamic, and trading decisions should be made based on individual research, risk tolerance, and consultation with a licensed financial advisor.

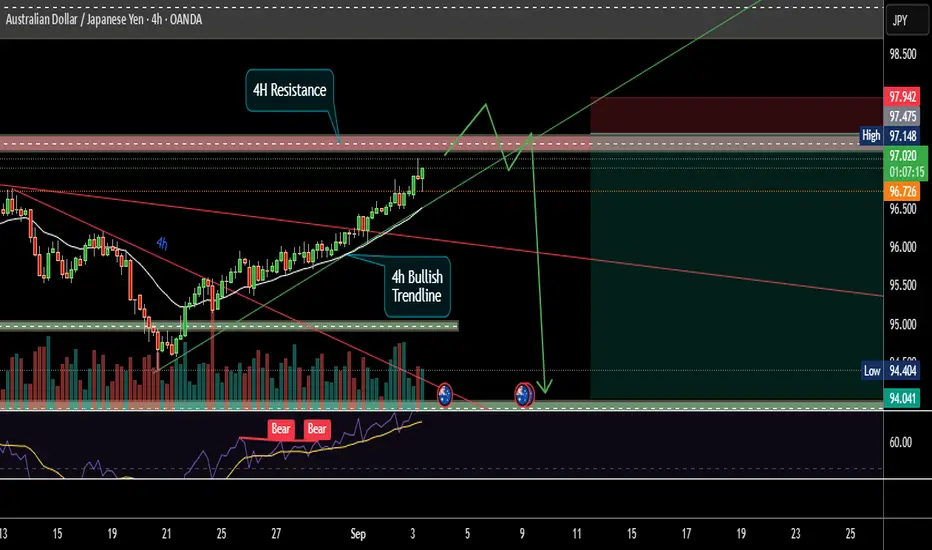
A beautiful AUDCHF high RnR scenarioAUDCHF is approaching 4H resistance zone which has already show rejection previously. There is also a steep bullish trend line creating a confluence. RSI has already shown Bearish Divergence. All these signaling a coming very good sell side opportunity. Below are points detailing the same.
1. Price is approaching 4H resistance zone. Which may act as a strong supply zone.
2. Very steep Bullish Trend line developing a confluence at resistance. Steep trend line are always prone for breakout/breakdown.
3. Most probably price will take liquidity of resistance zone and break trend line.
4. After breaking trend line it should pullback till resistance/trend line or any newly created OB/FVG.
5. RSI also already shown Bearish Divergence and running in oversold zone.
All these combinations are signaling a high probability and high Risk and Reward (1:8) trade scenario.
Note – if you liked this analysis, please boost the idea so that other can also get benefit of it. Also follow me for notification for incoming ideas.
Also Feel free to comment if you have any input to share.
Disclaimer – This analysis is just for education purpose not any trading suggestion. Please take the trade at your own risk and with the discussion with your financial advisor.
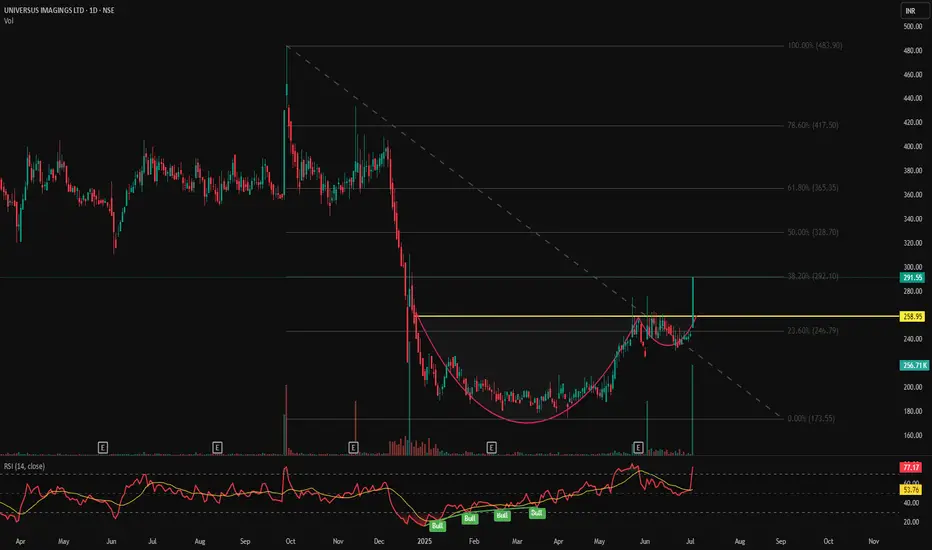
UNIVPHOTO - Cup & Handle Breakout | Daily Chart📊 UNIVPHOTO – Cup & Handle Breakout | Strong Volume | RSI Overbought | Fibonacci Confluence | Daily Chart
📅 Chart Date: July 3, 2025
📍 CMP: ₹291.55 (+20.00%)
📈 Symbol: NSE:UNIVPHOTO
🔍 Technical Analysis Summary
✅ Cup & Handle Breakout
Price has broken out above the neckline of the Cup & Handle pattern at ₹258.95 with strong bullish momentum.
Post-consolidation breakout visible with a solid bullish candle.
📊 Fibonacci Retracement Levels (Swing: ₹173.55 to ₹483.90)
23.60% – ₹246.79
38.20% – ₹292.10 ✅ (Price nearing this level – short-term resistance)
50.00% – ₹328.70
61.80% – ₹365.35
78.60% – ₹417.50
100% – ₹483.90 🎯
📈 RSI Indicator (14)
RSI has surged to 77.17, indicating strong momentum but entering overbought territory.
RSI breakout with multiple prior bullish divergences validated the upside move.
📉 Volume
Current breakout supported by above-average volume (256.71K) adds credibility to the move.
🏁 Key Technical Levels
Neckline Breakout: ₹258.95 ✅
Immediate Resistance: ₹292.10 (Fib 38.2%)
Next Targets: ₹328.70 → ₹365.35
Support Levels: ₹258.95 → ₹246.79
Major Swing Low: ₹173.55
💡 Trade Setup
Entry: On breakout confirmation above ₹259
SL: Below ₹246
Short-term Target: ₹292
Mid-term Target: ₹328 → ₹365
Risk Level: Medium (due to RSI overbought – may see retracement)
⚠️ Disclaimer
This chart is for educational and analytical purposes only. Please consult your financial advisor before making investment decisions.
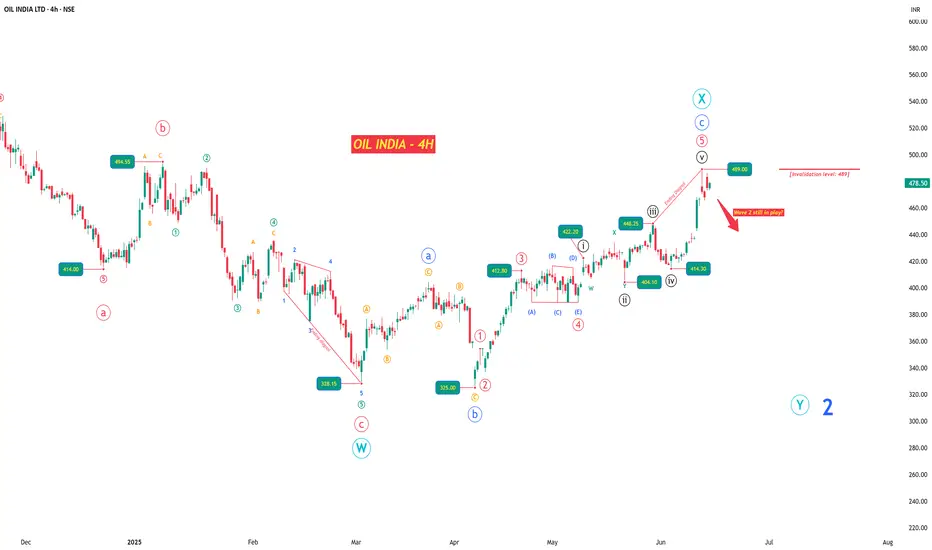
OIL INDIA LTD – Structure Tiring as Crude Starts Firing?What began as a heroic rally from ₹42 to ₹767 in a powerful impulse now finds itself wobbling under its own weight. OIL INDIA LTD’s chart tells a story of exhaustion — both structurally and contextually — just when crude oil is flexing again on the global stage.
Amid rising geopolitical tensions and war-like murmurs pushing crude prices higher, the Indian oil sector may be sailing into headwinds. And this isn’t just a macro hunch — the waves themselves are flashing caution.
After a Wave 1 climax near ₹767.90, price action has shifted into a corrective mode. I interpret the ongoing structure as a W-X-Y double zigzag , and within it, a key event unfolded: a classic ABC flat correction, beginning in March.
The April rally — which at first glance looks like a fresh impulse — is in fact the C leg of that flat. While it did unfold in 5 waves, the fifth wave formed an ending diagonal , complete with overlapping internals and fading momentum. This could be the last gasp .
Zooming into the 4H chart, the rise from ₹325 to ₹489 fits neatly into a corrective framework, not an impulsive one. That makes ₹489 a crucial invalidation level . If price stays below it, we likely begin Wave Y of the broader correction — a move that could push OIL INDIA back toward or even below ₹325.
However, if price breaches ₹489 and sustains, that’s your early signal that this entire bearish setup is off, and a new bullish sequence may be unfolding instead.
The stop-loss is tight, the downside wide. If this count holds, the risk-reward setup is highly favorable.
Further analysis continues in the notes below — covering multi-timeframe wave counts, internal structures, and confluences from RSI, volume, and Bollinger Bands.
DCXINDIA Breakout next stop RS 345?**Technical Pattern & Structure:**
Breakout Observed: The stock has **broken above a horizontal resistance zone** (293-294), which had acted as a cap multiple times in the past.
Chart Pattern: Appears to be a **broadening wedge** or **expanding triangle** (purple trendlines), within which price had been fluctuating for months.
Consolidation Zone: Between ₹270–₹300. Price broke out of this zone with strength.
---
**Support and Resistance:**
* **Immediate Support:** ₹310 (previous resistance turned support)
* **Strong Support:** ₹275 (bottom of recent consolidation)
* **Next Resistance Levels:**
* ₹345-347 (Trendline Intersction)
* ₹375-380 (strong horizontal resistance)
---
**Indicators:**
* **RSI (14):** \~68.47
* Approaching overbought territory but still has room for upside.
* Indicates strong bullish momentum but caution is needed for potential short-term correction.
* **Volume Analysis:**
Volume surged on the breakout day, confirming the strength and validity of the move.
---
**Caution:**
* RSI nearing overbought could cause short-term pullbacks.
* Profit booking may occur near the ₹345–₹350 range.
* Overall market sentiment should also be considered.
---

SRF Looking Good Post Q3 Results Can Accumulate when retest.NSE:SRF is showing strength with good Q3 Results and Future Outlook. It made a Gap-up post results and since then it has been attempting to break its long-time resistance which it has respected since Oct 2021 and can now break successfully. RSI is getting in the Overbought Zone and MACD is Positive.
F&O Activity:
Significant Long Build-up with 2700 CE showing a Significant decrease in OI.
Trade Setup:
Can Accumulate for Positional Trade once it retests to the mentioned different levels, I think it can fill the gap post results day so keep it in the watchlist and keep the last base mentioned as stop loss, for swing traders I think it will challenge it's long time resistance once so a swing is possible.
Target(Take Profit):
Upper Resistance Levels for Swing Trader. Positional Trader Aim for 10-15% Upside from Entry.
Stop-Loss:
Entry Candle Low For Swing Trader and a Red Coloured Base for Positional Trader.
📌Thank you for exploring my idea! I hope you found it valuable.
🙏FLLOW for more
👍BOOST if useful
✍️COMMENT Below your views.
Meanwhile, check out my other stock ideas below until this trade is activated. I would love your feedback.
Disclaimer: I am not SEBI REGISTERED RESEARCH ANALYST AND INVESTMENT ADVISER.
This analysis is intended solely for informational and educational purposes only and should not be interpreted as financial advice. It is advisable to consult a qualified financial advisor or conduct thorough research before making investment decisions.

AUBank Technical Signals Pointing to a 12% UpsideThe recent movements in AUBank's stock chart warrant a closer examination.
Following a pronounced downtrend that commenced on January 13, the stock faced considerable challenges in regaining momentum, struggling for a sustained period to close above all relevant daily EMAs). This persistence in bearish sentiment had created a cautious approach among investors, further complicating the stock's recovery efforts.
However, the turning point came on Friday, August 30, when AUBank's shares finally managed to close above all daily moving averages, signaling a potential shift in market sentiment. This breakout was accompanied by a notable trading volume of 24M, suggesting that the upward movement was underpinned by strong investor interest.
Furthermore, this price action filled a previous gap on the chart, which often serves as an important technical indicator of a new bullish phase. Additionally, a downward trendline breakout was also observed during this period, reinforcing the notion that the bears may be losing control.
On the weekly chart, RSI has crossed above the 63 mark, indicating growing strength in the buying pressure. This upward movement in RSI contributes to the bullish narrative, suggesting that the stock may continue its ascent if this momentum is sustained.
In terms of price levels, I anticipate a potential retracement towards the 711 level, where the stock may offer a buying opportunity before it aims for the next resistance target at approximately 813 (12% Return). This anticipated movement aligns with a risk-to-reward ratio of 1:2, highlighting a well-structured approach for traders looking to capitalize on this setup, with support firmly positioned at 678 to manage downside risk.
Disclaimer: The information provided in this stock analysis is for informational and educational purposes only and does not constitute financial advice. Always consult with a qualified financial advisor and conduct your own research before making any investment decisions.

RGL Cup and Handle Formation Signals Potential 16% UpsideIn the daily time frame chart of Renaissance Global Ltd (RGL), I have identified a compelling Cup and Handle pattern, which is a bullish continuation formation that suggests potential for upward movement in the stock price. Currently, the stock appears to be in the process of forming the handle, a critical phase where consolidation occurs after the initial cup formation.
The handle formation is being supported by the Fibonacci retracement level of 61.8%, which is often viewed as a significant support area following a price correction from a recent HH. This retracement suggests a healthy pullback, providing a solid base for buyers to re-enter and push the stock higher.
Over the past few weeks Volume growth during the formation of the handle is a bullish sign, indicating increased interest and participation from traders and investors. MACD on weekly time frame has crossed above the zero line, with the histogram currently reading above 3. This bullish crossover indicates a strengthening momentum, suggesting that the stock may continue its upwards trajectory. Additionally, the RSI for the weekly chart is positioned around 66, inching toward the overbought territory, signaling robust buying pressure, but caution is warranted as the stock approaches these levels.
Currently, the stock appears to be in an accumulation zone, with the price fluctuating between 120 and 125. This range may serve as an opportunity for investors to build positions as the underlying fundamentals, supported by technical indicators, with a solid support level is established at 104. The next resistance target is identified at 146 which could result in approximately a 16% return from the current accumulation zone.
Disclaimer: The information provided in this stock analysis is for informational and educational purposes only and should not be construed as financial advice. Always seek the advice of a qualified financial advisor or conduct your own research before making any investment decisions.

Devyani International Potential Bullish MomentumFollowing a notable consolidation phase that commenced in January 2024, Devyani International has exhibited promising technical signals, suggesting a potential shift towards a bullish trend. Last week, the stock successfully breached the pivotal resistance level of 185 on the weekly timeframe, which is a critical psychological and technical milestone.
The 20 EMA has crossed above the 50 EMA on the weekly chart, a classic indicator of bullish momentum known as a "Golden Cross." This crossover typically signals a potential uptrend and aligns with the stock's recent move above the 185 pivot point.
Both the daily and weekly RSI readings have indicated bullish momentum, suggesting the stock has been gaining strength relative to its price action over the observed periods. The MACD indicator on both daily and weekly charts is also reflecting bullish dynamics, with the MACD line crossing above the signal line.
The stock has managed to close above the equilibrium level, a point where buying and selling pressures are balanced, on both the daily and weekly charts. A sustained close above this level could signify strong sentiment among investors, further corroborating the potential for upward momentum.
A Change of Character has been observed on the weekly chart, indicating a shift from prior selling exhaustion to potential buying interest. This technical pattern often precedes substantial price movements, and in this case, it may suggest that sellers are losing control, paving the way for bulls to take the lead.
Given the aforementioned technical indicators and patterns, the next resistance level is identified at approximately 236. Should the stock continue its bullish trajectory, this represents a potential upside of around 25% in the short term. Traders should closely monitor volume trends and broader market sentiment to fortify their positions.
Disclaimer: The information provided in this stock analysis is for informational and educational purposes only and should not be construed as financial advice. Always seek the advice of a qualified financial advisor or conduct your own research before making any investment decisions.

Finolex Cab - Strong up move momentumKey Points:
- On daily and weekly chart strong bullish momentum seen with breaking ATH price & potential to have up move for short term
- Cup and Handle chart pattern
- RSI @ 81 with breakout & crossed RSI MA of 65
- Volume above VMA
- Price crossed above 20,50,200 EMA
In Gujarati “ Bhav is Bhagwan ”
Disclaimer :
I am not a SEBI registered Analyst.
Please do your own Analysis before taking any trade/investment.
The above view is just for educational purpose only.

Fun RPower long PennyIts can be risky but RSI breakout done!
Reversal ho sakta hai.
Levels not marked but will give 100% +
Zero ya hero wala hisab hai.
Invest carefully.


Levels for - 14 July 2021 ∘ Bollingerband Strategy
∘ Stochastic reading moves above 80 , indication that the asset is Overbought .

COALINDIA Breaking out of Downward ChannelCOALINDIA has broken out of its downward channel and is one of the last stocks to recover from the March Covid-19 fall. RSI has reached overbought conditions which indicates strength. The stock is likely to reach 38.2 Fib retracement and psychological zone of 150, crossing which 61.8 Fib retracement of 175 would be the next potential target.

WIPRO | Detailed Analysed | entracement is going to happen soon Price action Based analysis on WIPRO
IT sector is now overbought
CMP = 360.60
Lot Size = 3,200
there are 2 targets as shown by arrow
DON'T forget to check out the related ideas which i have posted down below they worked really well
FOLLOW & LIKE & COMMENT

STBT TRADE IN MANAPPURAM FINANCE !!(FUT)!!STBT IN MANAPPURAM FINANCE
VIEW
:-DARK CLOUD COVER
:-RSI OB ZONE
:-PROFIT TAKING ON THE CARDS
TRADE IN 28TH NOV FUTURE CONTRACT
SHORT @171.5
STOP @173.5
TARGET @168.25
LOT:6000
QTY:1

INTRA-DAY SHORT TRADE IN MANAPPURAM FIN !!(FUT)!!INTRA-DAY SHORT IN MANAPPURAM FIN
VIEW:-RSI REVERSAL SPIKE
BEARISH CANDLE
TRADE IN NOV FUT
SHORT@168.25
STOP@170.75
TARGET@165.75
LOT:6000
QTY:1

STBT TRADE IN ICICIBANK !!(FUT)!!STBT IN ICICI BANK
TRADE IN FUTURES 28TH NOV CONTRACT
SHORT@472.5
STOP@478.5
TARGET 1@465
TARGET 2@460
LOT:1375
QTY:2


Sell RELIANCE - end of 5th wavesell if crosses below - 1322
RSI crossing below 70
MACD cross
TGT 1 - 1285
TGT 2 - 1270
TGT 3 - 1255
SL - 1345
