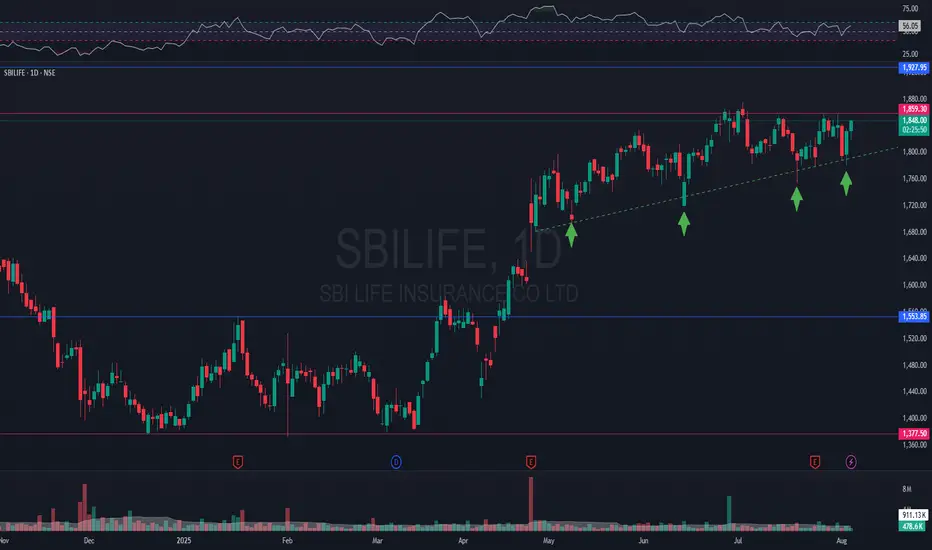
Ascending Triangle Breakout on #SBILIFE#SBILIFE is showing clear signs of a strong breakout from current levels.
The ascending trendline has supported the price since 09MAY25. The price continued to hold near the levels of 1855, with every red candle bought in.
Yesterday, i.e. 04AUG15 was a good day to initiate accumulation. In our view, price is expected to move sharply once the daily/weekly candle closes above 1860 with supporting volumes.
SBILIFE
Sbilife Getting ready for the rally ahead?!!!Chart patterns suggest me the above titled opinion
1. Weekly time frame shows a three white soldiers (month of april 2025) with good volume support....now the consolidation happening
2. In daily time frame, it is travelling in a expanding channel pattern , currently at the support line at the bottom
3. We need a confirmation for the rally with a Breakout candle....which we can expect during the result release.
4.If we make our entry now, we can make our stoploss as daily candle close out of the channel
5. Best entry is to wait for the Breakout and enter with SL below the breakout candle
6.Target levels as mentioned in the chart.
With strong fundamentals and decent valuations, Sbilife is one of the best options for long term bet in the insurance sector!!!
This is just my opinion ....not a tip nor advice..
Thank you!!!!

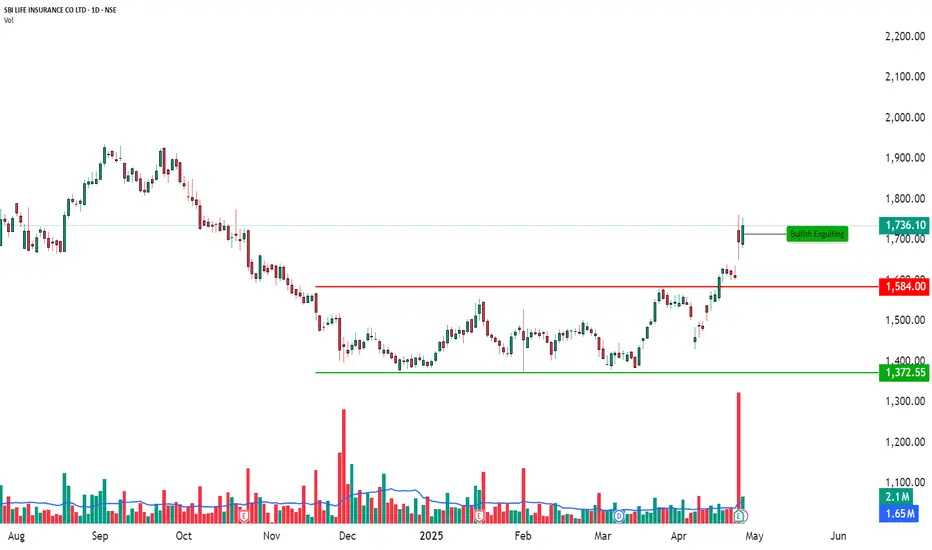
Breakout with Bullish Engulfing Confirmation | Daily Chart🏦 SBI LIFE INSURANCE CO LTD – Breakout with Bullish Engulfing Confirmation | Daily Chart
📅 Date: April 28, 2025
📈 Timeframe: Daily Chart
🔍 Stock: SBI Life Insurance Co Ltd (NSE)
📌 Technical Overview:
SBI Life is showing strong bullish momentum on the daily chart after breaking out above a key horizontal resistance around ₹1,584.
The price has formed a Bullish Engulfing candlestick pattern, indicating renewed buyer strength, backed by heavy volume.
🧩 Chart Pattern:
Strong horizontal resistance at ₹1,584 (now acting as support).
Bullish Engulfing candle printed around ₹1,736.10, showing strong rejection of lower levels.
Price structure continues to maintain higher highs and higher lows – a positive sign for bulls.
🔍 Key Price Levels:
Support Zones: ₹1,584(marked in red)
Major Support: ₹1,372.55(green horizontal line)
Current Market Price (CMP): ₹1,736.10
A sustained move above ₹1,736 with rising volume could potentially take the stock towards higher psychological levels around ₹1,800+.
📊 Volume Analysis:
Strong volume breakout observed during the recent rally.
Volume spike supports the validity of the bullish breakout, indicating increased buying interest.
🧠 Observational Bias:
As long as SBI Life holds above ₹1,584, the short-term to medium-term bias remains positively bullish. Any healthy pullbacks near ₹1,580–₹1,600 zones could offer better risk-reward setups for positional traders.
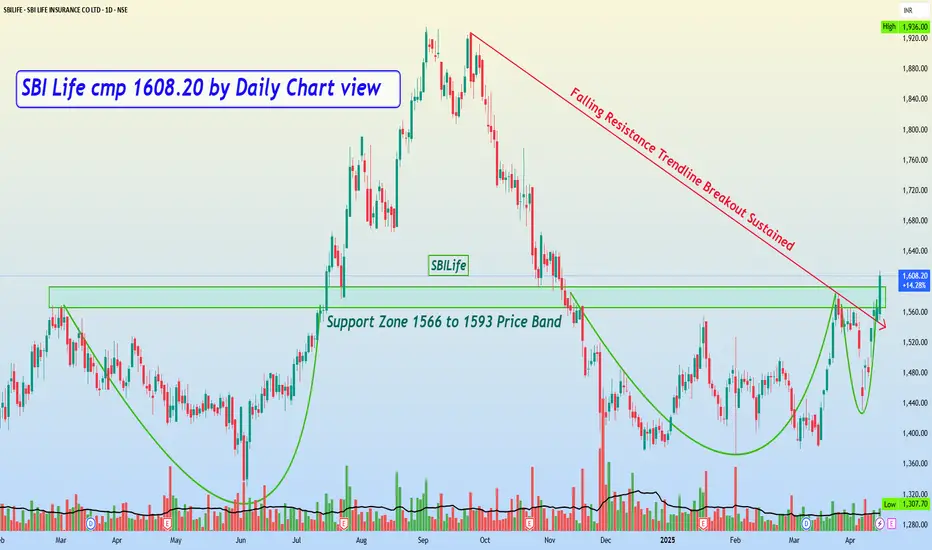
SBI Life cmp 1608.20 by Daily Chart viewsSBI Life cmp 1608.20 by Daily Chart views
- Support Zone 1566 to 1593 Price Band
- Resistance Zone 1670 to 1720 Price Band
- Falling Resistance Trendline Breakout Sustained
- Bullish Double Rounding Bottom formed at Support Zone neckline
- Volumes are strong and in close sync with the average traded quantity
SBI LIFE Looking Good Made A Good BaseNSE:SBILIFE is looking good. It has made a base around 1395-1338; today, it broke above major Levels.
The RSI and MACD are Showing Strength.
Results are Due in a few Days Watch Closely.
F&O Activity:
Short Covering Seen Today With PCR of 0.70 and 1400 PE as Strong Option Base.
Trade Setup:
It can be a Good 1:1 RISK-REWARD Trade. With the recent base being crucial levels.
Target(Take Profit):
Around 200 DEMA For Swing Trade or 1660 Levels for Positional.
Stop-Loss:
Around 20 DEMA For Swing Trade Recent Base for Positional Trade.
📌Thank you for exploring my idea! I hope you found it valuable.
🙏FLLOW for more
👍BOOST if useful
✍️COMMENT Below your views.
Meanwhile, check out my other stock ideas below until this trade is activated. I would love your feedback.
Disclaimer: This analysis is intended solely for informational and educational purposes and should not be interpreted as financial advice. It is advisable to consult a qualified financial advisor or conduct thorough research before making investment decisions.

SBI LIFE - Possible Path1550-1560 Area of support
1500-1510 Area of Strong Support
Stock may turn around from one of the above levels
below 1485 view can be negated
Waiting for at least 1 hourly candle indication to enter

SBI Life cmp 1589.85 by Daily Chart views*SBI Life cmp 1589.85 by Daily Chart views*
- Support Zone 1566 to 1593 Price Band
- Stock Price testing retesting Support Zone since 28-October-2024
- Volumes stable since 28-October-2024 indicates probable accumulation
- Support at 1530 > 1470 > 1390 with the Resistance at 1645 > 1710 >1780

LIC for 30%+ gainsDate: 5 Oct’24
Stock: Life Insurance Corp of India
Timeframe: Daily
LIC seems to be forming a complex diagonal in Wave V which could end at a minimum level of 1270+ (>30% from current price of 970) as seen in the chart. It could even go higher to around 1400 levels which will be confirmed only as the trend develops.
It seems to have completed Wave B on 4th Oct or may form another lower low to complete it and then move higher in Wave C of V.
This is not a trade recommendation. Please do your own analysis. And I have the right to be wrong.
Aida lagata hai ki LIC Wave V mein ek jatil vikarn bana raha hai jo minimum 1270+ ke star (970 kee maujooda keemat se>30%) par samaapt ho sakta hai, jaisa ki chart mein dekh sakte hain. Yeh lagabhag 1400 ke star tak bhee ja sakta hai jiski pushti trend vikasit hone par hi hogi.
Aisa lagata hai ki 4 Oct ko Wave B poora ho gaya hai ya ise poora karane ke lie ek aur nichala nimn bana sakata hai aur phir V ke Wave C mein oopar ja sakata hai.
Yeh koi trade karne ki salah nahin hai. Kripya apna vishleshan khud karein. Aur mujhe galat hone ka adhikaar hai.

SBI LIFE - Buy for Swing TradingSBI Life is forming a channel pattern.
You can buy it for a swing trading.

SBI Long setup*Swing Trade*
Buy SBI Life between 1495-1505
SL 1450
Target 1: 1570
Target 2: 1600
Duration 1-2 weeks
50Rs SL per quantity trade as per your risk rewards capacity.

SBI Life Insurance Company Ltd SHORT OPPORTUNITY SHORT SBILIFE CMP 1429
1 Year trendline Breakdown and retest done
SHORT BELOW 1411
Target 1 - 1381
Target 2 - 1335
Target 3 - 1255
Sl Above 1490
This Is For Just Educational Purpose
Make Your Own Study Before Buy

SBILIFE TRENDLINE BREAKOUTSbilife breaking resistance trendline
with good volume building up
macd crossover seen
#target 1620 only after breaking 1570
EDUCATIONAL IDEA

SBILIFE Rally, Breakout. With Full details. Previous Long term resistance of 1380 has now become the support level for SBI LIFE.
When a resistance turns into a support it adds more confidence to the upcoming trend.
Currently we can see a breakout from a descending triangle pattern in the daily Time Frame.
Currently a good HH and HL is observed in Daily Candles there fore we can expect further movement towards the higher side unless observed otherwise.
Happy Trading,
Yamini Prabu
NSE, NISM Certified TA,
Indepedent Trader/Trainer

SBILIFE BullishStock is in Consolidation Phase, after making a Higher High.
Have a Tight SL for this Current Trade Set up.
Good RR favours.
Have your own Analysis before any trade.

Looks good for buying for the target 1566SBI Life Insurance looks bullish for the target of 1566 then 1685 in next two weeks. With small SL at 1435.

Positional_ SBI LifeSBI Life looks good for a positional trade.
Buying above Rs 1021, SL will be Rs 997.
Target to be decided afterwards.
Disclaimer: The views expressed in this article is of my own. You're solely responsible for any decision taken in the markets, resulting in financial gains or losses. The analysis I've shared is for informational and educational purposes only.

SBILIFE TRENDLINE RESISTANCE BREAKOUTSBILIFE breaking trendline resistance
good volume and rsi
trading above 20 ema
educational idea only

SBILIFE, 1D forms Evening StarNSE:SBILIFE formed an evening star after an uptrend.
Entry : 1334.2
Target : 1271
SL : 1395
RR : 1

Sbi Life Triangle BreakoutBuy Sbi Life At Cmp - 1003.15
Strict SL - 949 (DCB)
Target - 1130/1300/1500

SBI LIFE Short time good Buy with still High PE.📆 Recommendation on NSE:SBILIFE for the week starting 4th September 2023
📊 Current Status:
Closing Price: ₹1327.10 📈
52-Week High: ₹1374.00 🏔️
P/E Ratio: 70.36 📊 (High!)
Sector: Financials - Life Insurance 💼
📈 Technical Analysis:
1️⃣ Parabolic SAR: Recent buy signal as of 1st Sep '23 👍
2️⃣ Fibonacci Levels: Currently at 0.382; eyeing 0.5 and above 🎯
3️⃣ MACD: Showing a positive crossover 📈
4️⃣ Stochastics & RSI: Indicating oversold position, poised for a rebound 📊
5️⃣ %R and Fisher: On the higher end of the spectrum 📈
🎯 Recommendations:
Entry Point: 4th September 2023, if opening on a positive note 📅
For Speculators: Good for short-term percentage gains 📈
Target Price: Undefined yet, aimed for short-term gains 🎯
Stop Loss: Not specified (high-risk profile due to P/E) 🚫
🔎 Rationale:
Despite higher P/E ratios and below-expectation earnings, the technical indicators suggest a favorable short-term trade opportunity. The financial sector is currently hot, making this a key pick.
📣 Disclosure & Disclaimer:
This recommendation is for informational purposes only. Please consult a financial advisor before making investment decisions.
📱 Stay Updated:
Hit subscribe for real-time financial insights and stock recommendations! 🛎️
#SBILifeInsurance #StockPick #InvestSmart #WeeklyRecommendation #Finance #Investing

SBILife ATH breakout with IHNS patternSBILife has given ATH breakout with good volumes.
It is a Inverted head and shoulder pattern breakout.
Minimum target can be 1600. SL can be below 1225 DCB. Try to enter at retest in 1300-1325 zone.
Please note that swing trade of ATH breakouts in an FNO stock is always risky.
Idea shared for educational purposes only.

SBI LIFE INSURANCE LONGSBI Life is a long at current levels.
1. RSI>50
2. Trend Breakout
3. Retest
4.Good Volume
5.Weekly Crossover of MACD

SBILIFE- False Breakout gives a SHORT!Attached: SBILIFE Daily Chart as of 21st April 2023
For the Levels, it is already marked in the Chart (SELF EXPLANATORY)
Stop Loss > 1136
Downside Target 1= 1074
Downside Target 2= 1054
For the Thesis as to why it is a SHORT:
- the 17th April Candle was a Breakout Candle that turned out to be a BULL TRAP Candle, so all the Bulls that entered got Liquidated as the Low of the Candle was taken out
- with the 21st April Candle (latest candle) Bears entered the stock giving a Breakdown below POC of the Volume Profile
- All Insurance Stocks saw Selling on Friday, even HDFCLIFE is similar and Bears have taken over in that Stock as well. So a Weak Sector too
Note: Both SBILIFE and HDFCLIFE have Earnings on 26th April (the coming Wednesday)
