SBILIFE Double top Breakdown ??!!!Chart pattern look interesting for a short trade
Reasons
1. SBILIFE travelling in a Descending channel pattern ( hourly time frame)
2. Now, it has formed a DOUBLETOP pattern (with a perfect High & Lower High as the two tops )
3. Lower low too formed on Friday, increasing our probability and thus Breakdown!!!
4. SL & Target levels mentioned @ chart as horizontal dashed lines(red & green)
5. 2 hr candle escaping out of the channel(yellow) can be less risky SL.
6. On 15th Feb(wed), Sbilife formed a Superb Bullish Engulfing day candle, but couldnot sustain. ... showing the BEARS STRENGTH!!!!
7. 1113(1st target) level small gap remains unfilled!!!
Let's wait and watch how it moves!!!!
NOTE- Just sharing my view......not a tip nor advice!!!!
SBILIFE
HDFC Life Double Bottom RSI DivergencePrice has formed a double pattern on daily chart. while the RSI is making higher lows which is clear sign of RSI Bullish Divergence. We can take long trade.
Entry
We can go long on open of next candle.
Target
Target 1 will be the nearest resistance zone which will be also the neckline of W pattern as marked on chart.
Target 2 will be next next resistance zone after the neckline of W pattern is broken as marked on chart.
Stoploss
We can keep stoploss below the double bottom support zone.
Please like & Follow me.
@SBILIFE #SBILIFE : Almost 40% downside MOvement expected.@SBILIFE #SBILIFE
SBILIFE : Almost 40% MOvement expected.
almost 40% Profit
Breakdown Happened on lower timeframe, so first target is 1072, if it crosses 1072 and acts as resistance, the we can expect a huge downward movement upto 750 i.e 40% profit.
NOTE: Published Ideas are for ‘’EDUCATIONAL PURPOSE ONLY’’ trade at your own risk.
NOTE: RESPECT The risk. SL should not be more than 2% of the capital.
Happy Trading
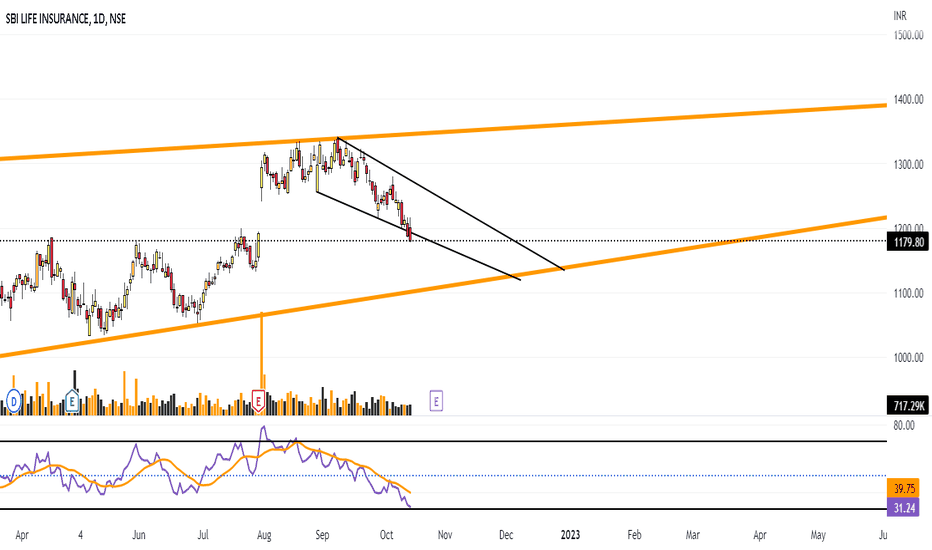
SBI Life is at supportSBI life can drop upto the last resistance line.
The insurance sector has taken a hit today due to budget. The tax rates are revised.
Never the less, we know insurance is a growing sector and every year percentage of insurance issued are increasing and people are becoming more aware.
All the costs will go up and eventually one can only afford it via insurance. E.g. Developed country the cost of opearation is so high that one cannot afford it without a insurance.
Long term this is a good opportunity to collect the stock.
Do provide your comments and rate my charts. I feel there are professional level.
I like to keep it simple, because success lies in simplicity.
SBI Life Triple Bottom PatternTriple bottom pattern is seen in SBI Life hourly chart. Also the price is making lower lows while the RSI is making higher lows which is clear sign of RSI Bullish divergence.
Entry
When a strong bullish candle is formed at support zone.
Target
The next résistance will the target as marked on chart.
Stoploss
Stoploss will be below the support zone.
Please like and follow me.
SBILIFE - Possible BOLooking at the chart -- once SBILIFE crosses the Previous month's HIgh - should trigger further upside movement.
Possible Breakout of channel pattern upside should support the same.
Also trading above all the indicators, Volumes are also above average from past 2-4 weeks.
Add to watch list -- may take you to station 1500 very soon NSE:SBILIFE .
SBI LIFE NSE:SBILIFE
Note :
1.One Can Go long with a Strict SL below the Trendline or Swing Low of Daily Candle.
2. Close, should be good and Clean.
3. R:R ratio should be 1 :2 minimum
4. Plan as per your RISK appetite
Disclaimer : You are responsible for your Profits and loss, Shared for Educational purpose!
SBI life Short trade (Intraday)SBI Life at a support level, you can go short once it breaks the support level. ⚠️ Enter after the close-in of 15min candle. The volume of the breakout/breakdown candle should be good enough.(/or the breakout candle should be strong). Target1 : 1230Rs/ 1% of the Stock Target2 : 1200Rs . Place Stop-loss logically // Ignore if the stock opens gap-up or gap-down. // Trade with your own risk // Trail your stop-loss once it reaches 50% of the target//
SBILIFE#Watchlist
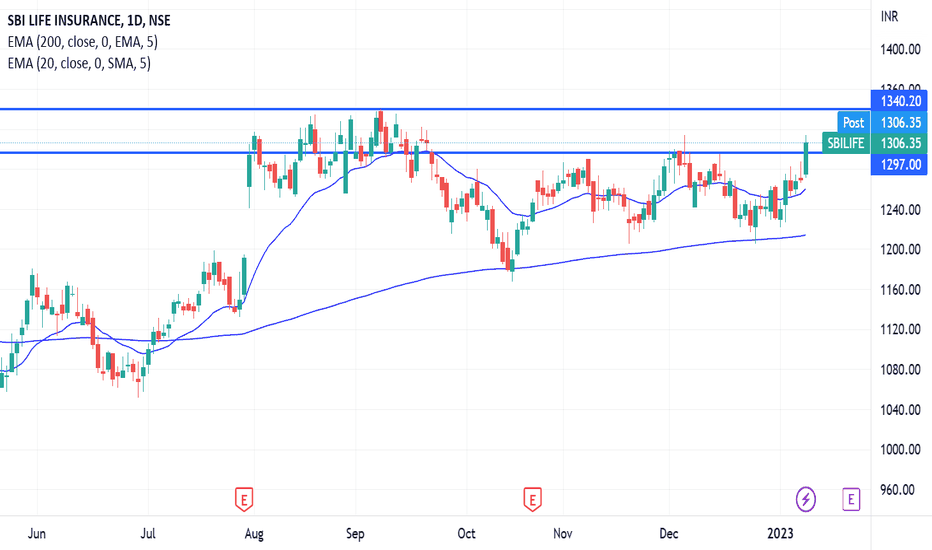
#SBILIFE (W):- CMP 1294 Looks Good above 1300 For More Upsides :)
Trading volume tends to drop off the longer congestion lasts. This is not always the case but is the general tendency. Volume tends to pick up when the congestion ends. The congestion is over when there is a breakout, typically on larger-than-recent volume, and the price moves outside the congestion range.
During a congestion period, the price will move between support and resistance. When the price breaks above resistance or below support, it indicates that the buyers or sellers have overpowered the other side, respectively.
Some investors will enter during congestion, assuming that the stock price will continue to rise after the congestion ends. This is more likely to be the case if the price was in an uptrend leading into the congestion period.
Other traders may wait for the price to break out of the congestion before entering a trade. For example, they may buy if the price moves out of the congestion price range on high volume.
#Disclaimer:- View shared is for educational purposes only. Conduct your due diligence before making any trading/investment decisions.


