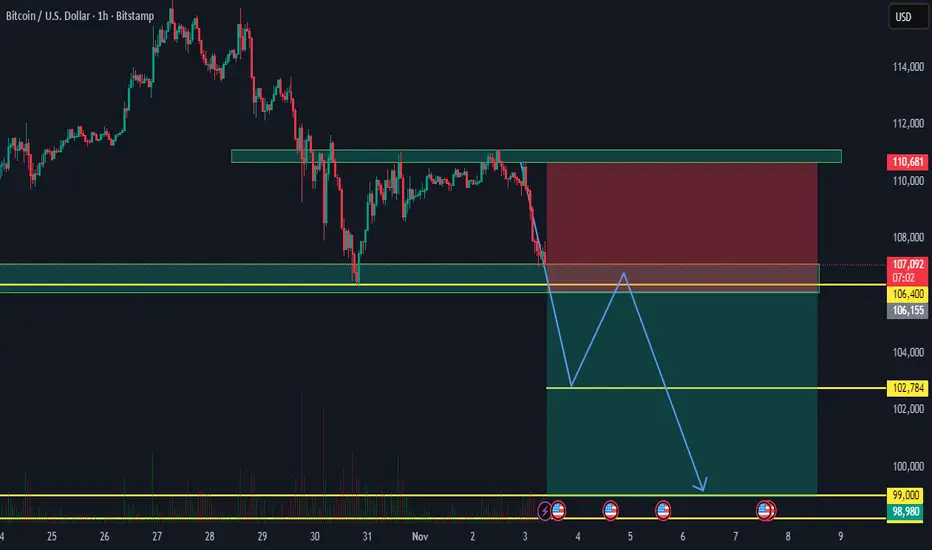
BITCOIN 1HRSWING TRADE
- EARN WITH ME DAILY 10K-20K –
BITCOIN Looking good for Downside..
When it break level 106400 and sustain.. it will go Downside...
SELL @ 106400
Target
1st 102784
2nd 99000
Enjoy trading traders.. Keep add this STOCK in your watch list..
Big Investor are welcome..
Like this Post??? Hit like button..!!!
Follow me for FREE Educational Post and Alert..
Community ideas
Darvas Box #Screener — Catch Stocks Before the Breakout!
🚨 Darvas Box #Screener — Catch Stocks Before the Breakout!
📉➡️📈
💥 Tight Consolidation = Big Momentum !
✅ Low Risk, High Reward Setups
✅ catch Big move with Trailing SL
XAG/USD (Silver vs USD) chart on the 2-hour timeframe...XAG/USD (Silver vs USD) chart on the 2-hour timeframe:
Price is moving within a descending channel, still below the Ichimoku cloud, indicating continued bearish pressure.
The recent candle is showing a rejection from the upper band of the channel / cloud resistance area (around 47.9–48.1).
My marked two target points on the chart — both aligning with the lower parts of the descending channel.
🎯 Target Zones (Bearish Outlook)
1. First target: around 46.00 – 46.20
→ This aligns with the mid-channel support and my first “target point” marking.
2. Final target: around 42.00 – 42.30
→ This corresponds to the lower channel boundary and my second, deeper target point on the chart.
🔹 Summary
Bias: Bearish below 48.10
Entry area: 47.8 – 48.0 rejection zone
Targets:
🎯 TP1 = 46.10
🎯 TP2 = 42.20
Invalidation: A sustained close above 48.20 would weaken this bearish structure and could trigger a cloud breakout.

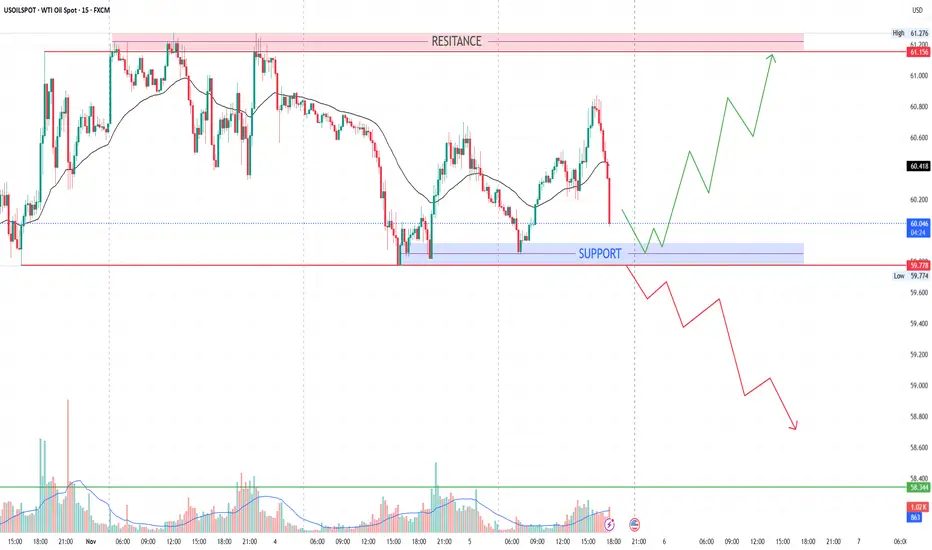
Today support & resistance for USOIL Here's a trading plan based on the provided USOILSPOT data:
**Trading Strategy**
* **Buy Entry:** Around 60.136 (as indicated in the "BUY" zone).
* **Sell Entry:** Around 60.096 (as indicated in the "SELL" zone).
* **Stop-Loss Placement:**
* For Buy Trades: Place your stop-loss slightly below the recent low (e.g., 60.080).
* For Sell Trades: Place your stop-loss slightly above the recent high (e.g., 60.140).
* **Target Price (Take Profit):**
* For Buy Trades: Consider a target around potential resistance levels (you'll need to analyze the chart for this).
* For Sell Trades: Consider a target around potential support levels (again, chart analysis is key).
**Important Considerations:**
* **Risk Management:** Always use stop-loss orders to limit potential losses. Adjust stop-loss and target levels based on your risk tolerance and the specific market conditions.
* **Chart Analysis:** This is a basic suggestion. Thoroughly analyze the USOILSPOT chart using different timeframes, technical indicators (moving averages, RSI, etc.), and patterns to confirm entries and exits.
* **News and Events:** Be aware of any relevant news, economic releases, or geopolitical events that could impact the price of oil.
* **Position Sizing:** Determine your position size based on your risk tolerance and account balance. Never risk more than you can afford to lose.
* **Disclaimer:** Trading involves risk. This is not financial advice. Always do your own research and consult with a financial advisor if needed.
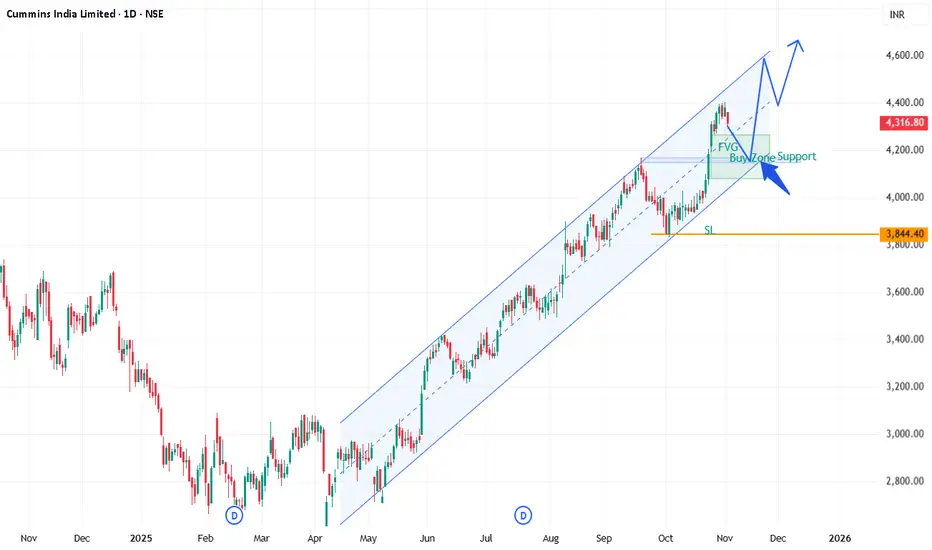
CUMMINSINDCUMMINSIND, Channel support, FVG entry, risk:reward 1:1.5
Cummins India Limited (CUMMINSIND) reported strong financial results for the second quarter (Q2) of FY 2025-26:
Revenue: ₹2,444 crore, up 31% YoY and 8% QoQ, driven by 47% domestic sales growth despite a 13% YoY export decline.
Net Profit: ₹591 crore, reflecting an 11.67% quarter-on-quarter increase and a 27.82% year-on-year rise.
Earnings Per Share (EPS): Around ₹16.3 for the recent quarter.
Market Capitalization: Around ₹1.2 lakh crore.
Price to Earnings Ratio (P/E): Approximately 55.76.
Stock price key levels: Traded around ₹4,317; 50-day moving average near ₹4,012; 200-day moving average near ₹3,342.
Cummins India demonstrates solid growth with strong domestic demand fueling revenue and profit expansion, maintaining a robust market position in the engineering sector
GBP/USD (1-hour) chart...GBP/USD (1-hour) chart:
Price is moving within a descending channel, and currently testing the upper boundary of that channel.
The Ichimoku cloud above the price suggests a bearish bias, as price remains below the cloud.
There’s a projected leg down (green arrow) marked on my chart — pointing toward the lower channel line.
🎯 Likely Target Zone
If the move respects the current channel and the upper rejection holds:
Short-term downside target: around 1.2910–1.2920, aligning with the lower channel trendline and my marked “target point.”
Intermediate resistance: near 1.3040–1.3060 (top of the cloud / channel upper edge).
Summary:
📉 Sell bias below 1.3040
🎯 Target: 1.2910–1.2920
❌ Invalidation: If price breaks above 1.3070 with strong candles (then potential reversal).

OGS LONGHello traders,
I'd like to post my analysis on OGS with a more timely and actionable observation. While the consolidation range of $79.50 - $83.10 is still valid, a clearer entry signal has just presented itself.
Context: Following the significant breakout on the week of September 22, OGS has been in a healthy consolidation.
Key Observation: The stock has now pulled back to test the precise level of its former breakout resistance. This "resistance-to-support flip" is a classic bullish confirmation.
The Entry Signal: The most critical development is the formation of a strong bullish reversal candle precisely at this new support level. This price action indicates that buyers are actively defending this new floor.
Multi-Timeframe Confirmation: The significance of this signal is amplified as this reversal pattern is visible on both the Weekly and Daily charts.

KPILAscending Channel (Main Structure)
• The stock is trading within an upward-sloping channel, making higher highs and higher lows.
• The lower trendline acts as dynamic support, and the upper trendline as resistance.
Rectangle / Box Range (Recent Phase)
• Price consolidated between 1,220–1,310 for several sessions — forming a rectangle pattern.
• This consolidation occurred within the channel, suggesting a pause before continuation.
Breakout Confirmation
• Price has just closed above the upper rectangle boundary with strong volume.
• EMA crossover is supportive — price above both short and medium EMAs.
• RSI > 70 indicates strong momentum, confirming the breakout.
Consider buying above the 1325 level, with the targets of 1355, 1370, and 1395

XAUUSDUS has 35 trillion dollars dept and its going to pay everyday interest of 25000 crs if jobs rates once completed we have clear about interest rate cut if i had happen US market is gonna crash and safest investment like gold ,silver and bonds gonna rise let’s hope all gonna good
Option Trading: Basic UnderstandingHow Options Work
Each option represents a contract between a buyer and a seller. The buyer pays a premium to the seller (also called the writer) in exchange for certain rights:
The call option buyer has the right to buy the asset at the strike price.
The put option buyer has the right to sell the asset at the strike price.
If the market moves in favor of the buyer, they can exercise the option to make a profit. If the market moves against them, they can simply let the option expire, losing only the premium paid.
Example:
Suppose a trader buys a call option on ABC Ltd. with a strike price of ₹100, expiring in one month, for a premium of ₹5.
If ABC’s price rises to ₹120, the trader can buy the stock at ₹100 and sell it at ₹120, making ₹20 profit minus the ₹5 premium = ₹15 net profit.
If ABC’s price stays below ₹100, the trader will let the option expire and lose only the ₹5 premium.
This limited loss and unlimited profit potential make call options attractive for bullish traders.

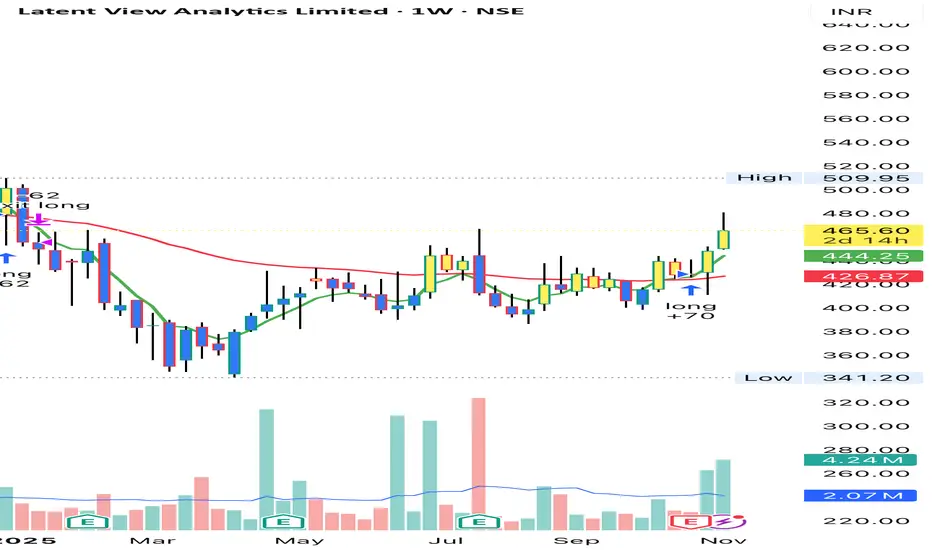
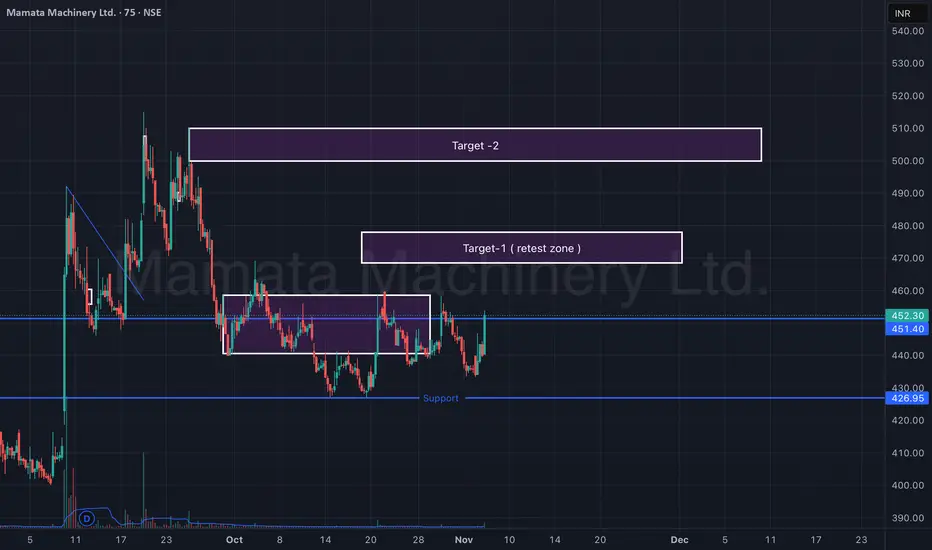
Mamata Machinery Ltd – Support Reversal & Retest Zone (75-min)Mamata Machinery is showing early signs of reversal from a strong support zone around ₹425–₹430. After forming a double-bottom-like structure, the stock has bounced sharply with rising volumes, indicating a possible short-term trend reversal.
Currently, price action is approaching a retest zone (Target-1) near ₹465–₹470. Sustaining above this level can open the path toward the next resistance cluster (Target-2) near ₹505–₹515.
🎯 Key Levels:
CMP: ₹452.30 (+3.81%)
Support Zone: ₹425 – ₹430
Target-1 (Retest Zone): ₹465 – ₹470
Target-2: ₹505 – ₹515
Stop-Loss: ₹425 (on 75-min close basis)
📊 Technical View:
Price rebounded from major support with visible volume spike.
Structure forming higher lows — early indication of momentum shift.
Short-term EMAs turning upward; potential crossover likely soon.
Sustained move above ₹470 can confirm breakout continuation toward ₹510+.
🧠 View:
Mamata Machinery has reversed from key support and is testing its retest zone. A breakout above ₹470 could trigger a short-term rally toward ₹510, while maintaining a stop-loss below ₹425.
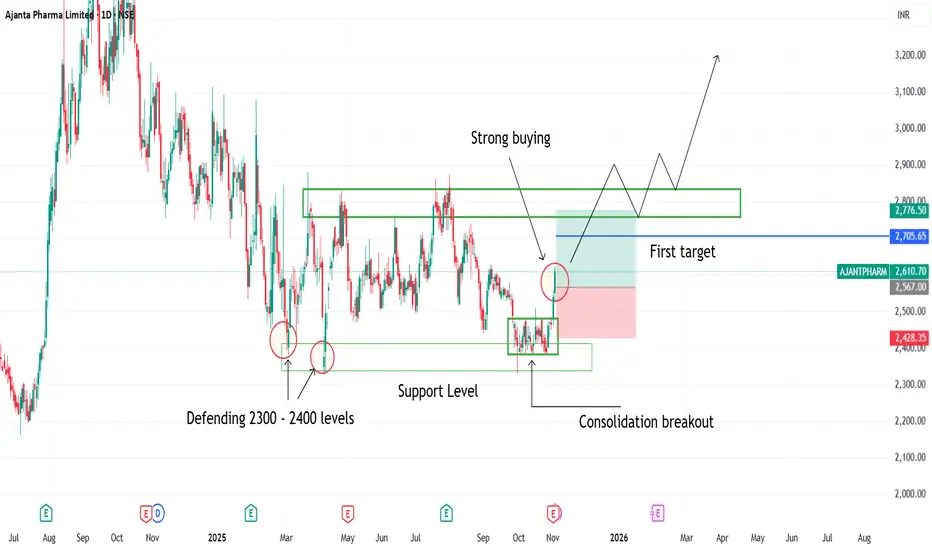
Consolidation breakout seen in ajanta pharma1. Consolidation breakout seen in ajanta pharma
2. Buyers defending 2300 2400 levels
3. Strong Bullish candles indicating strong buyers strength
4. Consolidation breakout has been happened on support levels
Part 1 Intraday Master ClassIntroduction to Options
Option trading is a type of financial trading that gives investors the right—but not the obligation—to buy or sell an underlying asset, such as stocks, indices, commodities, or currencies, at a predetermined price before or on a specific date. Unlike owning the asset itself, an option allows traders to speculate on price movements or hedge against potential risks in the market.
Options are powerful financial instruments because they can be used for leverage, income generation, and risk management. However, they also carry complexity and risk, making education essential for anyone interested in trading them.

USDJPY Setup preparing with 3x confluence?Intraday with M15 down to FIB Retracement zone (0.5 - 0.618) collab with FVG M15 and FVG 1H, thinking really strong support zone with setup: wait for liquility sweep --> BOS --> MSS. Confirmation: M5 - M15 need BOS or ingulfing candle really clearly strong pullup. Invalidation: 1H closed < 153.

Unlocking Trading Breakouts and Avoiding Costly Mistakes1. What Is a Breakout in Trading?
A breakout occurs when the price of a stock or asset moves outside a key support or resistance level with increased volume.
Resistance Breakout: Price moves above a resistance level (previous high or consolidation zone).
Support Breakout: Price drops below a support level (previous low or base).
This movement suggests that market sentiment is shifting—buyers or sellers are gaining control. A valid breakout often signals a new phase of volatility or the beginning of a strong trend.
For example, if a stock has been trading between ₹100 and ₹120 for weeks, a close above ₹120 on strong volume may signal a bullish breakout—potentially leading to a larger upside move.
2. Why Breakouts Matter
Breakouts often mark major transitions in supply and demand.
When price breaks above resistance, it shows that buyers have overpowered sellers.
When price breaks below support, it means sellers have overwhelmed buyers.
These moments attract large institutional traders and trigger algorithmic buying or selling. Breakout traders attempt to capture the early stage of a trend before the broader market catches on.
However, not every breakout leads to a sustainable move. Many fail quickly—these are known as false breakouts or “bull traps” and “bear traps.” Understanding how to differentiate them is key to success.
3. Characteristics of a Strong Breakout
To filter high-probability breakouts, traders should look for certain confirming signals:
a. High Volume
Volume is the heartbeat of any breakout. When price breaks a key level with high volume, it shows strong participation and conviction among traders. Low-volume breakouts often fail.
b. Tight Consolidation Before Breakout
A tight range or a base pattern (like a flag, pennant, or triangle) before breakout suggests accumulation or preparation for a major move.
c. Strong Close Beyond the Level
The price should close beyond the breakout point—not just spike intraday. Closing strength confirms that the breakout is genuine.
d. Favorable Market Context
Breakouts perform best in trend-supportive markets. A bullish breakout in a strong overall market (e.g., NIFTY 50 uptrend) has a higher chance of succeeding.
4. Common Types of Breakout Patterns
1. Horizontal Breakouts
Price breaks a flat support or resistance level, often after sideways movement or consolidation.
2. Trendline Breakouts
A long-standing trendline is breached, signaling a potential reversal or acceleration of momentum.
3. Chart Pattern Breakouts
Patterns like triangles, flags, rectangles, cups and handles, and head and shoulders often lead to breakouts. Each has its psychology of accumulation and release.
4. Volatility Breakouts
Price suddenly expands after a period of low volatility (e.g., after a squeeze on Bollinger Bands). Such breakouts are explosive but short-lived.
5. The Psychology Behind Breakouts
Understanding trader psychology is as important as chart analysis.
When price nears resistance, many traders expect rejection and place sell orders there. But once the price breaks above that level, short sellers are forced to cover, adding to buying pressure. Similarly, breakout traders jump in, driving price higher—a self-reinforcing cycle that fuels trends.
However, emotions can be dangerous. Many traders fear missing out (FOMO) and chase the price after the breakout has already extended too far. This often leads to losses when price retraces.
6. The Most Common Breakout Mistakes (and How to Avoid Them)
a. Entering Too Early
Jumping in before confirmation is a common trap. Wait for a daily or hourly candle close above resistance (or below support). Premature entries often get caught in false breakouts.
Solution: Be patient. Confirmation matters more than speed.
b. Ignoring Volume
Breakouts without volume often lack strength. Many traders ignore this and assume every move beyond a line is a breakout.
Solution: Use volume indicators (like Volume Profile or OBV) to confirm market participation.
c. No Stop-Loss Strategy
Many traders enter breakouts without pre-defined stop-loss levels, hoping the price will “eventually” go in their favor. This leads to big losses.
Solution: Always place a stop-loss just below the breakout point (for longs) or above it (for shorts). This protects against false breakouts.
d. Chasing Price
After the breakout, price may retest the breakout zone before resuming its trend. Impatient traders chase extended moves, only to see price pull back.
Solution: Wait for a retest or minor pullback before entering.
e. Ignoring Market Context
A breakout in a weak overall market is risky. Broader sentiment influences individual stock movement.
Solution: Align trades with broader trend direction. Bullish breakouts perform better in bull markets.
f. Over-Leveraging
Using high leverage amplifies both profit and loss. If the breakout fails, leveraged traders face margin calls.
Solution: Keep position sizes moderate—risk no more than 1–2% of capital per trade.
7. Smart Techniques to Trade Breakouts Effectively
a. Use Multi-Timeframe Analysis
Check higher timeframes (like weekly or daily) to confirm structure, and use lower ones (like 1-hour) for entries. This ensures alignment between short-term and long-term trends.
b. Employ Volume Profile
Volume Profile helps identify high-volume nodes (HVNs)—zones of strong support/resistance—and low-volume nodes (LVNs)—areas where breakouts are likely to accelerate.
c. Watch for Retests
Many valid breakouts come back to retest the broken level before continuing. This offers low-risk entry points.
d. Combine Momentum Indicators
Use RSI, MACD, or ADX to confirm momentum. If these show strength during breakout, chances of success rise.
e. Manage Emotions
Don’t let excitement or fear dictate action. Follow your trading plan strictly—discipline beats prediction.
8. Risk Management in Breakout Trading
Breakout trading works best with strict risk management because not all breakouts succeed.
Here’s how to manage risk effectively:
Stop-Loss: Place just beyond the opposite side of the breakout.
Position Sizing: Limit risk to 1–2% of capital per trade.
Trailing Stops: As price moves in your favor, trail your stop-loss to lock in profits.
Risk–Reward Ratio: Target at least 2:1. For every ₹1 risked, aim to gain ₹2.
Without proper risk control, even a few failed breakouts can wipe out profits from several successful ones.
9. Identifying False Breakouts
False breakouts happen when price temporarily breaches a key level and then reverses sharply. These are often caused by stop-hunting or lack of follow-through buying/selling.
How to Identify:
Breakout happens with low or average volume.
Price doesn’t close beyond the level.
Immediate reversal candle (like a shooting star or bearish engulfing).
How to Avoid:
Wait for confirmation on closing basis.
Avoid trading during major news events when volatility is erratic.
Use alerts instead of instant market entries.
10. Conclusion: Mastering the Art of Breakouts
Breakout trading offers tremendous potential—but only for disciplined traders who respect structure, volume, and risk. Successful breakout traders don’t chase—they anticipate, confirm, and control risk.
By focusing on volume confirmation, price structure, and broader trend context, you can distinguish between genuine and false breakouts. Equally important is patience—waiting for setups that align technically and psychologically.
Remember: every breakout is an opportunity, but only if you trade it with a plan. Stay objective, manage your emotions, and protect your capital. Over time, mastering breakout trading becomes less about prediction and more about precision—the art of entering when others hesitate and exiting when others panic.
The Power of Divergence in TradingParticipants in the Options Market
There are four main types of market participants, each with different motivations:
Buyers of Call Options: Expect the asset price to rise.
Sellers (Writers) of Call Options: Expect the asset price to remain stable or fall.
Buyers of Put Options: Expect the asset price to decline.
Sellers (Writers) of Put Options: Expect the asset price to remain stable or rise.
Each side of the trade involves a buyer and a seller, and each carries distinct risks and rewards.

Mid-Cap Index Fund: Risks and Rewards ExplainedWhat Are Mid-Cap Index Funds?
Mid-cap index funds are mutual funds or exchange-traded funds (ETFs) that replicate the performance of a mid-cap index, such as the Nifty Midcap 150 Index or the S&P BSE Midcap Index in India. These indices include companies ranked between 101 and 250 in terms of market capitalization.
Mid-cap companies are typically firms that have moved past the early growth stage of small-caps but have not yet reached the size and stability of large-caps. They are often expanding aggressively, gaining market share, or innovating within their sectors.
By investing in a mid-cap index fund, investors gain diversified exposure to a basket of such companies, reducing the risks associated with holding individual mid-cap stocks.
Rewards of Investing in Mid-Cap Index Funds
1. High Growth Potential
Mid-cap companies often experience faster growth than large-cap firms because they operate in the expansion phase. They may be entering new markets, developing innovative products, or improving operational efficiency. As a result, their earnings can grow rapidly, leading to significant stock price appreciation over time.
Historically, mid-cap indices have outperformed large-cap indices during periods of economic expansion. For instance, when GDP growth is strong, mid-caps tend to benefit more due to their agility and ability to capture emerging opportunities faster than larger corporations.
2. Diversification Benefits
Mid-cap index funds provide diversification across multiple sectors and companies, spreading out risk. Unlike investing in a handful of mid-cap stocks, a mid-cap index fund holds dozens (or even hundreds) of companies from different industries. This diversification helps cushion the impact if a few companies underperform.
For example, a fund tracking the Nifty Midcap 150 Index holds companies from sectors like finance, manufacturing, IT, pharmaceuticals, and consumer goods—offering balanced exposure to the broader economy.
3. Potential to Outperform Large-Cap Funds
Over long investment horizons, mid-cap index funds have shown the ability to outperform large-cap funds due to their higher growth potential. While large-cap companies have more stable earnings, their size often limits explosive growth. Mid-cap firms, being smaller, can expand revenues and profits at a faster pace, leading to superior long-term returns.
Many studies and market analyses indicate that over 10–15 years, the mid-cap segment can deliver higher compounded annual growth rates (CAGR) than the large-cap segment, especially in emerging markets like India.
4. Lower Expense Ratio (in Index Funds)
Since mid-cap index funds passively track an index, they do not require active fund management. This results in a lower expense ratio compared to actively managed mid-cap funds. Over time, lower costs can significantly improve net returns, especially in long-term compounding.
This cost efficiency makes mid-cap index funds attractive to investors seeking growth without the higher costs of active management.
5. Participation in India’s Growth Story
Mid-cap companies are often at the forefront of India’s growth sectors—such as renewable energy, infrastructure, technology, and manufacturing. Investing in mid-cap index funds allows investors to participate in the evolving economic landscape and benefit from rising domestic consumption, innovation, and industrial expansion.
Risks of Investing in Mid-Cap Index Funds
While mid-cap index funds offer exciting rewards, they also carry certain risks that investors must understand before investing.
1. Higher Volatility
Mid-cap stocks are generally more volatile than large-cap stocks. Their prices can swing significantly in short periods due to lower trading volumes, limited institutional coverage, and market sentiment shifts. During bearish or uncertain markets, mid-cap indices tend to fall more sharply than large-cap indices.
For example, during market corrections or economic slowdowns, investors often move their money to safer large-cap or defensive stocks, causing mid-caps to underperform temporarily.
2. Liquidity Risks
Mid-cap companies typically have lower liquidity compared to large-caps. This means fewer buyers and sellers are available at any given time, making it harder to buy or sell large quantities without affecting the stock price. During market stress, liquidity in the mid-cap segment can dry up quickly, leading to steep price declines.
Although an index fund itself is liquid (as it trades like a mutual fund or ETF), the underlying stocks can face liquidity issues, especially in times of panic selling.
3. Business and Operational Risks
Mid-cap firms are still in their growth phase, which means they face higher business risks—such as competition, management inefficiencies, regulatory changes, or funding challenges. They may also lack the financial strength of large corporations to weather long downturns or sudden market disruptions.
A few poor business decisions or operational inefficiencies can hurt profitability and, in turn, the stock’s performance.
4. Market Cycle Sensitivity
Mid-cap stocks perform best in bull markets or during periods of economic expansion. However, they are highly sensitive to market cycles. During recessions or market downturns, investors tend to favor large-caps for stability, leaving mid-caps lagging behind. This cyclical behavior means timing and patience play a crucial role in mid-cap investing.
Investors with a short-term horizon may find it difficult to handle the swings in mid-cap index performance.
5. No Active Management
Because mid-cap index funds are passively managed, fund managers do not have the flexibility to sell underperforming stocks or adjust portfolio allocation in response to market conditions. The fund must mirror the index composition, even if certain stocks are overvalued or declining.
This lack of active oversight can sometimes lead to underperformance compared to actively managed mid-cap mutual funds.
Who Should Invest in Mid-Cap Index Funds?
Mid-cap index funds are suitable for investors who:
Have a medium to long-term horizon (at least 5–7 years).
Can tolerate moderate to high volatility.
Want exposure to growth-oriented companies without active fund management costs.
Seek to diversify their portfolio beyond large-caps but with less risk than small-caps.
These funds fit well in a core-satellite investment strategy, where large-cap index funds form the core (stability) and mid-cap funds act as the satellite (growth booster).
How to Manage the Risks
Investors can manage mid-cap fund risks by:
Investing through SIPs (Systematic Investment Plans) to average out volatility.
Staying invested long-term, as mid-caps tend to outperform after full market cycles.
Balancing the portfolio with a mix of large-cap and mid-cap index funds.
Reviewing performance periodically to ensure it aligns with financial goals and risk tolerance.
Conclusion
Mid-cap index funds occupy a sweet spot in the investment landscape—offering a blend of growth and diversification. They represent the potential of companies that are ambitious, expanding, and capable of becoming tomorrow’s large-caps.
However, this opportunity comes with higher volatility and business risks compared to large-caps. Therefore, investors must approach mid-cap index funds with discipline, patience, and a long-term view. When held for 5–10 years or more, these funds can play a vital role in wealth creation, bridging the gap between stability and growth in a well-balanced portfolio.
In summary, mid-cap index funds reward those who stay the course—offering strong potential returns to investors willing to navigate the temporary bumps along the way toward long-term financial success.
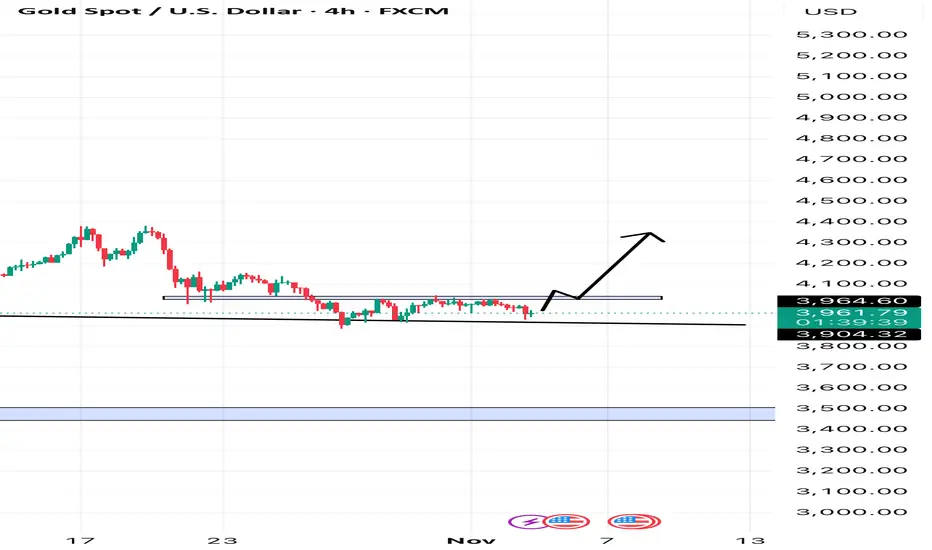
GOLD – TRIANGLE COMPRESSION ON H4 ✨ GOLD – TRIANGLE COMPRESSION ON H4, AWAITING A STRONG BREAKOUT IN WAVE 5 ✨
💬 Gold is accumulating in a compression triangle – when silence lasts too long, the market is about to speak.
Hi everyone 💖, Kristina is back with today's perspective on gold. I hope this analysis will help you – whether you're a new trader or have been trading gold for years – gain a clearer view to prepare for the upcoming breakout.
📉 Technical Analysis:
Currently, gold is moving within a triangle pattern on the H4 frame, indicating that market energy is being compressed. When the price breaks out of this area, the movement range could reach several tens of points.
Important support zone: 3960–3980
Strong resistance zone: 4035–4045
👉 When the price breaks one of these zones, the trend will be clearly confirmed.
According to Elliott Wave, Kristina is observing two scenarios:
1️⃣ Long-term: Wave (5) could be a downward wave, heading towards 3820.
2️⃣ Medium-term: Wave (5) can still rise if the price holds the 4000 zone, targeting around 4110–4130.
💎 Trading zone according to ICT:
Order Block around 4040 is a potential supply zone – a reversal signal is likely to appear.
The area around 4000 is a notable support point – it can create a bounce reaction if the price retests.
🎯 Reference trading scenarios:
Sell around 4040 when there is a reversal signal, SL 10 points, TP 4020–4000.
Buy around 4000 after the price retests the OB, SL 10 points, TP 4110.
If the price breaks 3970, wait to Sell around 3980, SL 10 points, TP 3820.
🕊️ Currently, gold is in a waiting phase – observe, don't rush, to act with the trend when the market "speaks."
🌷 The analysis reflects Kristina's personal perspective, not an investment recommendation.
If you share the same viewpoint or have a different perspective, please leave a comment below 💬💕

Positional Trading and Swing Trading in the Indian Market1. What Is Positional Trading?
Positional trading is a strategy where traders hold their positions for several weeks to months, depending on the trend and potential price movement. It’s based on the belief that once a trend starts, it will continue for a considerable period. Traders focus on identifying such long-lasting trends and patiently ride them out, ignoring short-term volatility.
Unlike intraday trading, positional trading doesn’t require constant monitoring. Traders rely heavily on fundamental analysis and technical indicators to determine the stock’s overall direction. The idea is simple — find fundamentally strong companies or technical setups that show signs of an uptrend or downtrend and hold them until the trend matures.
For example, if a trader notices a breakout on a weekly chart with strong volume and expects the stock to rise due to positive earnings or sectoral growth, they may hold the position for weeks or even months.
2. What Is Swing Trading?
Swing trading, on the other hand, is a short- to medium-term trading strategy aimed at capturing price “swings” that occur within a trend. These swings typically last from a few days to a few weeks. Swing traders don’t aim to catch the entire trend; instead, they seek to profit from smaller, predictable moves within the broader market direction.
In the Indian context, swing traders often focus on stocks with high liquidity, such as those in the Nifty 50 or Bank Nifty, since these provide enough volatility and volume to generate consistent opportunities.
Swing traders rely heavily on technical analysis, using indicators such as moving averages, RSI (Relative Strength Index), MACD, Fibonacci retracements, and candlestick patterns to time their entries and exits.
3. Tools and Analysis Methods
Both strategies depend on technical analysis, but positional traders often combine it with fundamental research, while swing traders primarily depend on price action.
For Positional Traders:
Fundamental Analysis: Checking company earnings, management quality, sectoral growth, and macroeconomic indicators.
Technical Tools: Weekly charts, long-term moving averages (50-day, 200-day), support and resistance zones, and trendlines.
Volume Analysis: Confirmation of trend strength through increased trading volume.
Sentiment Indicators: Market breadth or institutional buying trends.
For Swing Traders:
Technical Indicators: RSI, MACD, Bollinger Bands, Fibonacci retracements, and pivot points.
Candlestick Patterns: Reversals (Hammer, Shooting Star, Engulfing), breakouts, or continuation patterns.
Momentum Indicators: Used to identify short bursts of price action.
News Flow & Events: Earnings announcements, RBI policy, or global cues that can move prices quickly.
4. Risk and Reward Dynamics
Risk management is central to both trading styles, but the approach differs:
Positional Trading Risks:
Since positions are held for weeks or months, traders face overnight risk and gap-up/gap-down openings due to news, results, or global market movements. However, since the focus is on the bigger trend, small fluctuations are ignored. Positional traders often use stop losses based on weekly chart structures and risk smaller capital per trade.
Swing Trading Risks:
Swing traders face short-term volatility and need to manage tight stop losses. Since they target quick gains, even a minor reversal can affect profits. The advantage is limited exposure time — positions are not held too long, reducing prolonged uncertainty.
Reward-wise, positional trades often yield higher returns per trade but take time to materialize, while swing trades produce frequent smaller gains that can compound effectively.
5. Market Conditions for Each Strategy
Market conditions greatly influence which strategy works best:
Positional Trading Works Best In:
Trending markets — either bullish or bearish. Stocks or indices showing clear breakouts or breakdowns after consolidation phases.
Example: During a sectoral bull run (like IT in 2020–21 or PSU banks in 2023), positional traders could hold positions for months and ride the trend.
Swing Trading Works Best In:
Range-bound or moderately volatile markets. When the Nifty oscillates between support and resistance, swing traders capitalize on those moves.
Example: When Nifty trades between 22,000–23,000 for several weeks, swing traders buy near the support zone and sell near resistance.
6. Capital and Margin Requirements
In India, both strategies can be implemented using cash or futures and options (F&O).
Positional Trading: Typically requires more capital because trades are held longer, and margin funding costs can add up. Investors in delivery mode (cash segment) need full capital but have no daily margin calls.
Swing Trading: Requires less capital since traders can use leverage or trade in F&O. However, due to short holding periods, frequent transaction costs and taxes can slightly reduce profits.
7. Emotional and Psychological Factors
Positional Trading Psychology:
Demands patience and discipline. Traders must tolerate price pullbacks and avoid reacting to daily market noise. Emotional stability and conviction in analysis are crucial.
Swing Trading Psychology:
Requires quick decision-making and emotional agility. Traders must be comfortable with fast-paced setups, quick exits, and booking partial profits. Impulsiveness or hesitation can lead to missed opportunities.
8. Examples in the Indian Context
Let’s understand through two practical examples:
Positional Trade Example:
Suppose Tata Motors shows a breakout above ₹950 on a weekly chart after months of consolidation with rising volumes and improving earnings outlook. A positional trader buys and holds, targeting ₹1,200–₹1,300 over 2–3 months while keeping a stop loss at ₹880.
Swing Trade Example:
HDFC Bank rebounds from support near ₹1,450 with bullish candles and RSI divergence. A swing trader buys and holds for 4–6 trading days, aiming for a move to ₹1,520–₹1,550, keeping a tight stop loss at ₹1,435.
9. Which Strategy Is Better for Indian Traders?
There is no universal answer — the better strategy depends on one’s capital base, personality, and time commitment.
Choose Positional Trading if you:
Have a full-time job and cannot monitor markets daily.
Prefer fundamental strength and long-term trend riding.
Can tolerate drawdowns and be patient.
Choose Swing Trading if you:
Can actively watch markets for setups.
Enjoy technical analysis and momentum trading.
Prefer quicker profits and short-term engagement.
Many successful Indian traders blend both — they maintain positional trades in trending sectors and take swing trades for short-term opportunities.
10. Conclusion
Positional and swing trading are two of the most practical and flexible trading styles in the Indian market. While positional trading is about patience, conviction, and trend-following, swing trading emphasizes timing, agility, and momentum capture. Both demand disciplined risk management, a solid understanding of technicals, and awareness of market sentiment.
In essence, positional trading builds wealth gradually, while swing trading builds income through active participation. A balanced trader who understands when to switch between the two — depending on market conditions — can truly harness the best of both worlds in India’s dynamic stock market.

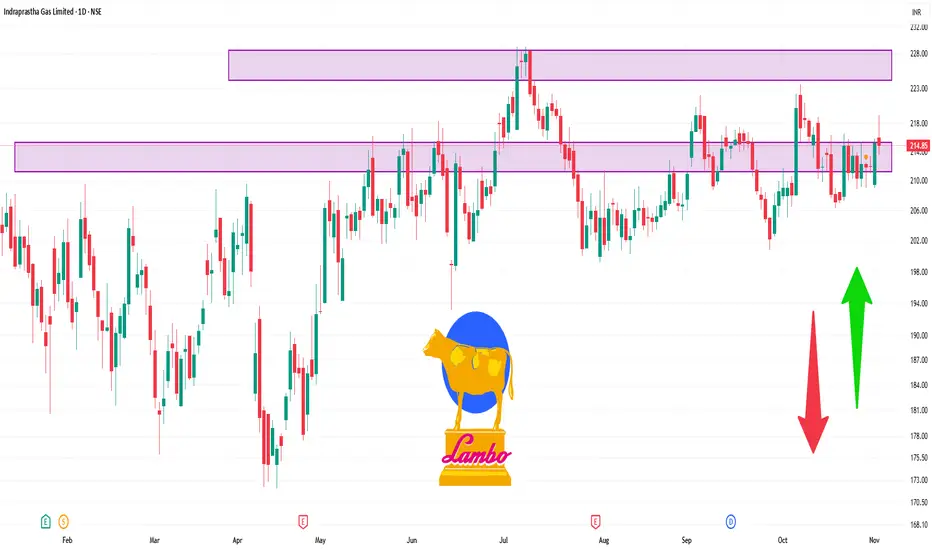
IGL 1 Day Time Frame 🔍 Current Price
Latest quoted price is ~ ₹ 212.33.
Previous close ~ ₹ 211.16.
The stock is trading above its 50-day, 100-day & 200-day moving averages (e.g., ~₹ 212.92 for 50-day) which suggests the medium-term trend remains intact.
📏 Key Pivot / Support & Resistance Levels (Daily)
Based on recent technical data the following levels are of interest:
Pivot / central range
Daily pivot point (approx): ~ ₹ 213.32.
Another source gives pivot ~ ₹ 211.14.
Support levels
Support 1 (S1): ~ ₹ 209.79 – ₹ 210.00.
Support 2 (S2): ~ ₹ 207.64.
Support 3 (S3): ~ ₹ 206.29.
Resistance levels
Resistance 1 (R1): ~ ₹ 213.29 – ₹ 213.50.
Resistance 2 (R2): ~ ₹ 214.64 – ₹ 215.00.
Resistance 3 (R3): ~ ₹ 216.79.
(ETH/USD, 3-hour imeframe...(ETH/USD, 3-hour timeframe, Bitstamp):
The chart clearly shows a descending channel with price breaking below the lower boundary, confirming strong bearish momentum.
The Ichimoku Cloud is fully bearish, and price action is below all major cloud levels — confirming continuation to the downside.
My chart already shows a target point marker at the lower projection level.
📉 Target analysis (based on my chart + structure):
Current Price: ≈ $3,511
Immediate Target (TP1): Around $3,400 (shown near the “target point” on my chart)
Next Target (TP2): Around $3,300 — previous horizontal support & channel extension
Extended Target (TP3): Around $3,180 – $3,200, if bearish momentum accelerates
🔒 Stop-loss (for short trades):
Above $3,650 – $3,700 (upper boundary of current consolidation zone / channel midline)
📈 Summary:
Trend: Bearish continuation
TP1: $3,400
TP2: $3,300
TP3: $3,180
SL: $3,650 – $3,700

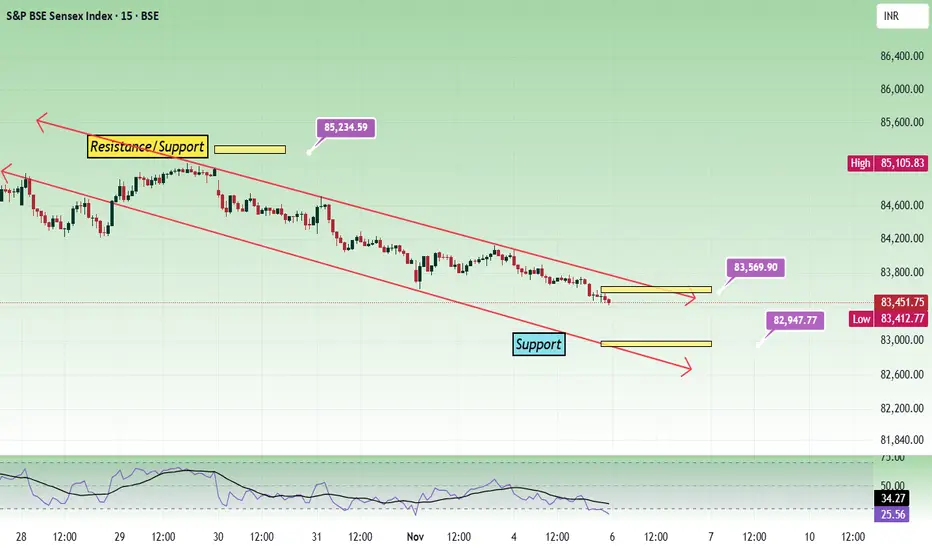
Sensex - Expiry Day Analysis Nov 6The price faced resistance at 85k and falling from there inside a descending channel. The daily chart shows that the price is having bearish strength. Channel movement is tricky to trade. Observing how the price is reacting at the channel support/resistance is important to take a trade with conviction.
If the price opens a gap up or above the channel resistance, buy above 83760 with the stop loss of 83640 for the targets 83860, 83980, 84060, 84200 and 84360.
If the price faces resistance at the 83500 to 83600 zone and if it shows bearish strength, sell below 83500 with the stop loss of 83640 for the targets 83400, 83260, 83120, 83020, 82900 and 82780.
Expected expiry day range is 83100 to 83900.
Always do your analysis before taking any trade.
Crypto and Digital Asset Regulations in India (Post-2025)1. Early Phase: From Uncertainty to Recognition
The Indian crypto journey began with skepticism. In 2013, the Reserve Bank of India (RBI) first issued warnings about virtual currencies like Bitcoin, citing risks of volatility, fraud, and lack of legal backing. Between 2017 and 2018, crypto trading volumes surged across Indian exchanges such as ZebPay and CoinDCX, prompting the RBI to impose a banking ban in April 2018. This prohibited regulated entities from providing services to crypto businesses, effectively stalling industry growth.
However, in March 2020, the Supreme Court of India overturned the RBI ban, ruling that it was unconstitutional. This verdict reopened doors for the crypto sector, allowing exchanges to restart operations. This was a landmark judgment that recognized crypto assets as a legitimate digital commodity, though not yet as legal tender.
2. Post-2021 Developments: Regulatory Consolidation
From 2021 onwards, the Indian government and financial regulators started formulating frameworks to oversee the growing digital asset ecosystem. The focus was on taxation, registration, and consumer protection, rather than outright prohibition.
In Budget 2022, the Finance Ministry took a crucial step by introducing a 30% tax on income from Virtual Digital Assets (VDAs). This was a clear signal that the government acknowledged the existence of digital assets but wanted to regulate them stringently. Additionally, a 1% TDS (Tax Deducted at Source) was applied to crypto transactions exceeding ₹10,000, aimed at tracking transactions and ensuring compliance.
While this tax structure made day trading less attractive, it marked a shift from banning to monitoring. The move was followed by exchanges being required to comply with Know Your Customer (KYC) and Anti-Money Laundering (AML) norms, integrating with India’s Financial Intelligence Unit (FIU-IND).
3. The Digital India Context: Blockchain Beyond Crypto
India’s broader Digital India initiative has greatly influenced crypto policy. The government recognizes that blockchain technology — which underpins cryptocurrencies — can revolutionize financial inclusion, supply chain management, and public records.
Projects such as the Central Bank Digital Currency (CBDC), launched by the RBI as the Digital Rupee (e₹) in 2023, have demonstrated India’s willingness to explore regulated digital currencies. The CBDC aims to provide the benefits of digital transactions while maintaining state control over monetary policy.
However, private cryptocurrencies like Bitcoin or Ethereum remain outside the legal tender framework — they can be traded, but not used as official currency.
4. Current Regulatory Structure (Post-2025)
As of post-2025, India’s crypto and digital asset framework revolves around four key pillars:
a) Legal Recognition & Definitions
The Virtual Digital Asset (VDA) category covers cryptocurrencies, NFTs (Non-Fungible Tokens), and certain tokenized assets. They are recognized as digital commodities or property, not as money. The term “crypto currency” is deliberately avoided in official documents to emphasize that these are assets for investment, not currency substitutes.
b) Taxation Framework
30% flat tax on profits from digital asset transfers.
1% TDS on each transaction for monitoring purposes.
No offset of losses between different digital assets or against other income.
Gifts in digital assets are also taxable under existing income tax rules.
This framework discourages speculative trading but supports transparency and record-keeping.
c) Regulatory Bodies
RBI (Reserve Bank of India) – Oversees monetary implications and CBDC operations.
SEBI (Securities and Exchange Board of India) – May regulate tokenized securities or investment contracts.
FIU-IND – Monitors compliance with AML and KYC norms.
Finance Ministry – Leads policy formation and taxation oversight.
d) Exchange & Custody Regulations
Crypto exchanges are now required to:
Register under FIU-IND as “reporting entities.”
Maintain complete transaction and user data for audit purposes.
Ensure compliance with international FATF (Financial Action Task Force) standards.
Implement cold wallet storage and cybersecurity frameworks for asset safety.
5. Investor Protection and Market Discipline
Post-2025, investor protection remains a top priority. Regulators aim to protect retail investors from frauds, Ponzi schemes, and misleading promotions. Exchanges must provide disclosures on risk, volatility, and regulatory uncertainty.
Educational campaigns are being promoted through both government and industry initiatives to help investors differentiate between legitimate projects and scams. The industry also follows self-regulatory codes, inspired by SEBI norms for mutual funds and brokers.
6. India’s Stance on Global Coordination
India has been actively engaging in G20 and FATF discussions to establish global crypto standards. As G20 president in 2023, India pushed for a global regulatory framework to avoid cross-border arbitrage.
In 2025, India’s policies align with the G20-endorsed framework that calls for:
Uniform tax reporting standards (similar to the OECD’s “Crypto-Asset Reporting Framework”).
Common KYC and anti-terrorism financing standards.
Information sharing between nations on suspicious crypto transactions.
This international collaboration helps prevent misuse of crypto for money laundering or terror financing while enabling legitimate innovation.
7. Central Bank Digital Currency (CBDC) – The Digital Rupee
The Digital Rupee (e₹) represents India’s official foray into state-backed digital assets. Issued by the RBI, it functions like a virtual version of the Indian Rupee, ensuring transparency, traceability, and low-cost transfers.
Key features include:
Pilot use in wholesale and retail segments.
Interoperability with UPI and bank apps.
Programmable transactions for specific purposes (like subsidies or government payments).
The CBDC complements rather than competes with private crypto assets — providing a regulated digital payment option backed by sovereign authority.
8. Emerging Trends: Tokenization and DeFi
India’s next wave of digital asset regulation focuses on tokenized real-world assets (RWA) and Decentralized Finance (DeFi). Tokenization allows physical assets such as real estate, art, or bonds to be represented digitally, creating liquidity and transparency.
However, regulators are cautious about DeFi projects due to the anonymity involved. The focus remains on regulated innovation, where blockchain is used under frameworks ensuring identity verification and financial stability.
9. Challenges Ahead
Despite progress, India faces several challenges:
Tax Burden: The 30% tax and 1% TDS discourage active participation.
Lack of Clear Legal Status: Crypto is not illegal, but not officially legal either.
Banking Hesitancy: Some banks remain cautious in offering services to exchanges.
Regulatory Fragmentation: Multiple agencies overlap in jurisdiction, slowing innovation.
Still, the policy direction is moving toward clarity, control, and co-existence.
10. The Road Ahead
Looking beyond 2025, India aims to establish a Comprehensive Digital Asset Regulation Bill that classifies different asset types (utility tokens, security tokens, stablecoins) and provides guidelines for their issuance, trading, and taxation.
The focus will be on:
Integrating blockchain in public infrastructure.
Encouraging innovation in Web3 and fintech startups.
Aligning with global best practices to make India a regulated digital asset hub.
With its young tech-driven population and strong fintech ecosystem, India has the potential to lead in responsible crypto innovation while maintaining financial sovereignty.
Conclusion
Post-2025, India’s crypto and digital asset regulations reflect a measured and pragmatic approach — not anti-crypto, but pro-regulation. The government acknowledges the transformative power of blockchain while safeguarding against financial risks. Through structured taxation, compliance requirements, and global coordination, India is building the foundation for a transparent, secure, and innovation-friendly digital asset ecosystem.
As policies mature, the country’s focus will likely shift from control to collaboration — enabling India to play a leading role in shaping the future of global digital finance.