BTC/USDT: forming bullish swing rejection pattern on RSI BTC/USDT #rank=1
As we all now few days for BTC where not good we saw corrections and several pullbacks which brought little bearishness to the market. Due to unstable nature of BTC other ALTS also got disturbed too and all these event created panic in the market. But as for now BTC looks like it is recovering and being stable.
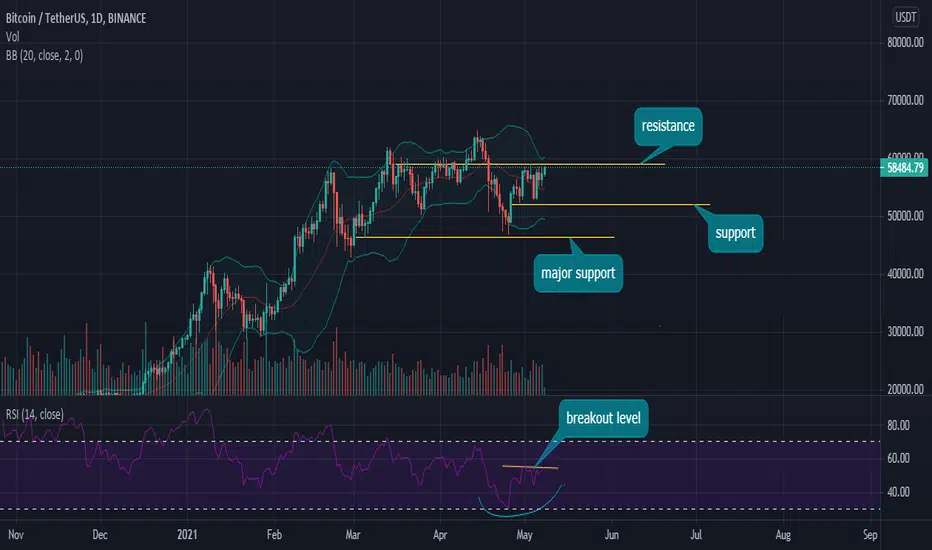
Presently, BTC is facing a resistance at $58.5k-$59k which can be clearly seen in the chart,i.e. price moves up touches that level and falls back again. So for BTC to start a strong upward trend again it has to break that resistance level . According to me a breakout coming very soon.
Because,
BTC is forming a bullish swing rejection on the RSI indicator which can be clearly seen on the RSI indicator chart, bullish swing rejection as name suggest is bullish pattern. RSI has formed the breakout level of the swing rejection and once the breakout level is breached BTC chart will also break the resistance and move further. For higher highs.
You all can also follow me on the Twitter..!!
Show your Support.
Thank you.
Search in ideas for "BTC USDT"
#BTC/USDT Primed for Breakout#BTC/USDT Technical Analysis: Two Potential Scenarios
Scenario 1: Symmetrical Triangle Formation
- **Current Pattern**: BTC/USDT is forming a symmetrical triangle, a common continuation pattern that usually indicates a period of consolidation before the price moves in the direction of the previous trend.
- **Upward Breakout**: If BTC breaks above the upper trendline of the triangle around $75,000, this could indicate a bullish continuation. Such a breakout would likely attract significant buying interest, potentially driving the price higher and grabbing liquidity above this key level.
- **Downside Risk**: Conversely, if BTC breaks below the lower trendline, the next major support level is around $61,000. This would suggest a bearish scenario where the price could decline further, testing this support level.
Scenario 2: Bullish Pennant Formation
- **Current Pattern**: BTC/USDT is also forming a bullish pennant, another continuation pattern that often occurs after a strong upward move. This pattern indicates a brief consolidation before the price continues in the direction of the prevailing trend.
- **Bullish Breakout**: If BTC breaks out from the pennant formation with strong volume and momentum, we could expect a significant upward move. The target for this breakout is around $85,000, based on the height of the initial flagpole leading into the pennant formation.
- **Confirmation**: For this bullish scenario to be validated, the breakout needs to occur with substantial volume, confirming the strength of the move.

#BTC/USDT Poised for Another Retest: Key Levels to Watch#BTC/USDT Analysis: Bearish Divergence and Decreasing Volume Indicate Potential Retest Levels
#Bearish Divergence
A bearish divergence occurs when the price of an asset is making higher highs, but the underlying technical indicator (in this case, the Relative Strength Index, or RSI) is making lower highs. This discrepancy suggests that the bullish momentum is weakening and a potential reversal or pullback could be on the horizon.
For #BTC/USDT, we've identified a bearish divergence forming on the daily chart. Despite Bitcoin reaching new highs, the RSI is not confirming this upward movement, indicating that the buying pressure is not as strong as it appears on the surface.
#Decreasing Volume
In addition to the bearish divergence, we are also seeing a significant decrease in trading volume. Volume is a critical indicator of market strength; decreasing volume during an uptrend suggests that the momentum is fading. This declining volume trend can signal a lack of conviction among buyers and potentially foreshadow a price reversal or retest of lower support levels.
#Potential Retest Levels
Given these technical indicators, it is likely that BTC/USDT might take a retest at certain key support levels:
1. **Retest Around $63,500**
- This level has previously acted as a strong support, and if Bitcoin's price retraces, it is likely to find initial support around this area. If the price manages to hold at $63,500, we might see a bounce-back, providing traders with a potential buying opportunity.
2. **Retest Around $61,000**
- If the $63,500 support does not hold, the next significant support level to watch is around $61,000. This level has historical significance and could act as a strong support. A retest around this level would provide a crucial juncture for BTC/USDT, determining whether it will consolidate or continue its downward trend.
#Trading Strategies
- **Cautious Approach**: Given the bearish divergence and decreasing volume, traders might consider a cautious approach, reducing their positions or waiting for confirmation before entering new trades.
- **Stop-Loss Orders**: Setting stop-loss orders just below the identified support levels ($63,500 and $61,000) can help mitigate potential losses in case of a further downturn.
- **Watch for Confirmations**: Look for confirmations such as bullish reversal patterns or increasing volume at support levels before considering long positions.
#Conclusion
#BTC/USDT is currently showing signs of potential weakness with bearish divergence and decreasing volume. Traders should be prepared for possible retests at $63,500 and $61,000. Monitoring key technical indicators and market sentiment will be crucial in making informed trading decisions during this period.

BTC/USDT is Going to up but waiting for BreakoutsBTC/USDT 1D chart , Right now btc moving in symmetrical triangle pattern and I am expecting a bounce from $36,100-$36,651 and if we break this symmetrical triangle above then btc may move to 48K but we have strong resistence at $39,800

btc usdt 15 min chatbtc usdt look like short term bearish if it break support then it will go down or if it break trend line it will go up to 48300 usdt


BTC USDT Perpetual Future BTC USDT Perpetual Future Making Flag and pole target can be lower zone for short
Bearish Flag on hr Time frame BTC USDT Binance
This is just an analysis and not a trading call/signal

BTC/USDTBTC/USDT
We need to bounce from this level, otherwise we will get 52k. Its strong for now, watching this with 4 eyes! The supports are given with box!

BTC/USDTBTC/USDT
-BTC is trading around $57800 after retracing from $55300
-BTC got rejected from $60000 level thrice in a row,which means bulls are not strong enough to cross that level
-Right now $60000 is a very strong resistance technically and besides that its a psychological level too and it has became a strong resistance
-EMA 200 is acting as a good bounce area and giving a good support around $55000
-We might see one more attempt to $60000 since BTC is forming a triangle,if we manage to break $60000 level then we will go to between $65000-$75000 this month and it will give confidence to alts to rise up

BTC/USDTBTC/USDT
Right now in consolidation, once manage to trade above 10500 and hold the level
we can see higher levels.
BTC needs to hold 10000 levels else we can see lower levels.


Btc/Usdt Short SetupBtc/Usdt showing false breakout, to wipe short trade stoplosses and then it start dumping to wipes out Long trades SL.
SIMPLE AS USUAL

#BTC/USDT Rebound Sparks Optimism#BTC/USDT has recently shown promising signs of a potential relief rally, supported by the formation of a double bottom pattern and bullish divergence. A double bottom typically indicates a reversal pattern, suggesting that selling pressure may have exhausted and buyers are stepping in. Concurrently, bullish divergence, where price forms lower lows while the indicator (like RSI) forms higher lows, signals weakening bearish momentum and a possible trend reversal.
This combination of technical indicators implies that Bitcoin could be poised for a relief rally, with a target retest of the $62,500 level. However, as with any market prediction, it's essential to monitor price action and volume to confirm the validity of the pattern and divergence. Traders should remain cautious and implement risk management strategies accordingly.

#BTC/USDT FORMED BULLISH DIVERGENCE #BTC/USDT formed bullish divergence, now pull back is coming almost 65000$ will be retested. mostly grab liquidity.

#BTC/USDT BULLISH DIVERGENCE FORMED#BTC/USDT formed bullish divergence and mostly one pullback will come around 62000$ grab liquidity.

#BTC/USDT is consolidating#btc/usdt showing strength to move upwards till 64800$ if it cross next resistance is 67500$..
in case goes below to we can see retest around 62500$

#BTC/USDT MOST LIKELY TO FORM BEARISH SHARK#BTC/USDT chances to move 3 direction :
1. CHACNCE to form bearish shark after retest 60k
2. consolidation near 62500 and move to 72500$
3. if lost 59200$ support, it will fall down to 53k level with 10 to 15% correction

BTC/USDT Weekly Higher High And Higher LowsBTC/USDT Weekly Higher High And Higher Lows I Have marked every Highs and lows of btc in weekly time please note that i have marked this highs and lows from 2021 to current time. Thank You.

Btc usdt pattern breakout 1 hour short tradeBtc usdt breakout from 1 hour chart spotted.nice setup for short trade

BTC USDT AnalysisBTC USDT Analysis
the situation is negative
Breaking the 20257 area made the situation negative for Bitcoin.
It may re-test the 20257 area, then go to the 19000 area


BTC/USDT DAY TRADING || LONGBTC/USDT DAY TRADING || LONG, long here and put the stoploss as mentioned below, you can either be satisfied with tp1 or if you're risk taker go for tp2

BTC/USDT BTC/USDT
#Update.
Btc had a perfect retest of trendline on 1D tf.
No it's trying to break 1D resistance 16889. Close 1D candle above this price. We can see pump till next supply zones as mentioned in chart. Close below resistance again we might retrace back to major support 15600.
#DYOR and take trades accordingly.
