Silver at Strong Support Level: Ideal Buy with Targets up to 12Silver has a level that is a strong potential support. Personally, I have been waiting for a retest of this level (87580) for quite some time. It is advisable to buy at this level.
From here, potential targets appear to be 96400, 100900, 102700, 106500, 120000, and 125000.
Search in ideas for "COMMODITY"

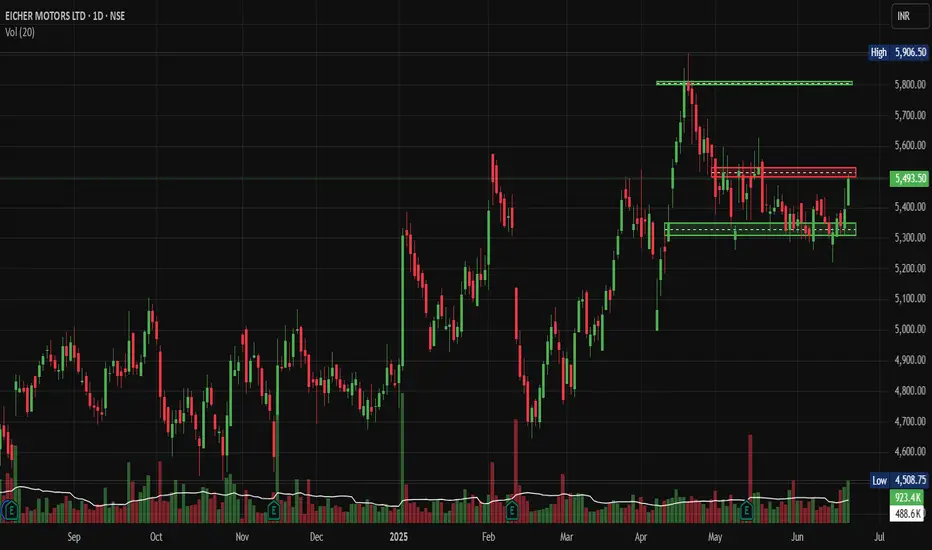
Eicher Motors: Hits Swing Highs, Signal More Upside AheadNSE:EICHERMOT Hits Swing Highs: This Technical Setup Could Signal More Upside Ahead
Price Action Analysis:
- Current Price: ₹5,493.50 (as of June 19, 2025)
- Day's Range: ₹5,410.00 - ₹5,506.50
- Price movement shows strong bullish momentum with recent breakout above resistance
- The stock has gained approximately 100.50 points (+1.86%) in the session
Volume Spread Analysis:
- Current session volume: 923.4K (89% above average)
- Average volume: 488.6K
- Volume surge during breakout phases confirms institutional buying
- Declining volume during consolidation phases shows controlled profit-taking
- Volume spike of 923.4K against average of 488.6K indicates institutional participation
- Volume has been increasing over the past 3 Days.
Volume Pattern Insights:
- Volume expansion on up moves and contraction on down moves
- Accumulation pattern visible in the base formation phase
- Recent volume spike suggests renewed buying interest
Chart Patterns:
- A clear ascending triangle pattern formed between March and May 2025
- Breakout above the ₹5,800 resistance level in April with strong volume confirmation
- Current consolidation phase between ₹5,300-₹5,500 range
- Higher lows pattern since March 2025 indicates underlying bullish sentiment
Key Technical Levels:
Support Levels:
- Immediate Support: ₹5,300 (previous resistance turned support)
- Secondary Support: ₹5,100 (20-day moving average zone)
- Major Support: ₹4,800 (previous consolidation base)
- Critical Support: ₹4,500 (long-term uptrend line)
Resistance Levels
- Immediate Resistance: ₹5,600 (short-term ceiling)
- Key Resistance: ₹5,800 (previous breakout level)
- Major Resistance: ₹5,900 (all-time high zone)
- Extended Target: ₹6,200 (measured move projection)
Base Formation
- Primary base formed between September 2024 - March 2025
- Consolidation range: ₹4,400 - ₹5,200
- Duration: 6 months (healthy accumulation phase)
- Breakout confirmation in April 2025 with volume expansion
Technical Indicators Assessment:
Momentum Indicators:
- Price trading above key moving averages
- Bullish crossover pattern maintained
- Momentum favours bulls in the short to medium term
Trend Analysis:
- Primary trend: Bullish (uptrend intact since September 2024)
- Secondary trend: Consolidation within an uptrend
- Trend strength: Strong (confirmed by volume analysis)
Trade Setup:
Long Position Strategy:
- Entry Strategy: Buy on dips approach
- Accumulation zone: ₹5,300 - ₹5,400
- Momentum entry: Above ₹5,550 with volume confirmation
- Investment horizon: 3-6 months
Entry Levels:
- Conservative Entry: ₹5,320 (near support)
- Aggressive Entry: ₹5,480 (current levels)
- Breakout Entry: ₹5,560 (above resistance)
Exit Strategy:
- Target 1: ₹5,800 (12% upside from current levels)
- Target 2: ₹6,000 (20% upside potential)
- Target 3: ₹6,200 (extended target for long-term holders)
Stop-Loss Levels:
- Conservative SL: ₹5,200 (below key support)
- Aggressive SL: ₹5,350 (tight stop for short-term trades)
- Investment SL: ₹4,800 (major support violation)
Position Sizing & Risk Management:
Position Sizing Guidelines:
- Conservative approach: 2-3% of portfolio allocation
- Moderate approach: 4-5% of portfolio allocation
- Aggressive approach: 6-8% of portfolio allocation (only for high-risk tolerance)
Risk Management Framework:
- Maximum risk per trade: 2% of total capital
- Risk-reward ratio: Minimum 1:2 preferred
- Portfolio correlation: Consider auto sector exposure
- Stop-loss discipline: Strict adherence to predetermined levels
Capital Allocation Strategy:
- Entry in tranches during the consolidation phase
- Average up strategy on breakout confirmation
- Profit booking at predetermined target levels
- Position sizing adjustment based on volatility
Sectoral Backdrop:
Automobile Sector Overview:
- The two-wheeler segment is showing a strong recovery post-COVID
- Rural demand improvement supporting premium motorcycle sales
- Electric vehicle transition creating new opportunities
- Government infrastructure spending boosts commercial vehicle demand
Industry Trends:
- The premium motorcycle segment is growing faster than the mass market
- Export opportunities expanding in international markets
- Supply chain normalisation is improving production efficiency
- Raw material cost pressures are stabilizing
Fundamental Backdrop:
Company Fundamentals:
- May 2025 sales up 26% YoY with a total of 89,429 units sold
- International sales up 82%, showing strong export growth
- Achieved a significant milestone of selling over 100,000 units in March with 33.7% YoY growth
- Fundamentals look strong and suitable for long-term investment
Market Position:
- Continues to dominate >350cc space with >85% market share
- Increased market share from 32.9% in Q4FY22 to ~36% in Q1FY23 in >125cc segment
- Market cap of ₹1,50,676 crores, appearing financially stable compared to competitors
- Average analyst price target of ₹5,426 from 21 research reports
Financial Health:
- Trailing 12-month revenue of $2.19 billion as of March 2025
- Strong balance sheet with healthy cash flows
- Consistent dividend payment track record
- Efficient capital allocation and ROE metrics
Growth Catalysts:
- New product launches, including Hunter 350, are receiving a positive response
- Market share expansion in the premium segment
- International market penetration opportunities
- Electric vehicle portfolio development
Risk Factors:
Company-Specific Risks:
- Dependence on Royal Enfield brand performance
- Raw material cost inflation impact on margins
- Competition intensification in the premium motorcycle segment
- Regulatory changes in emission norms
Market Risks:
- Economic slowdown affecting discretionary spending
- Interest rate changes may impact vehicle financing
- Commodity price volatility
- Currency fluctuation impact on exports
Technical Risks:
- Breakdown below ₹5,200 could trigger selling pressure
- Volume declining during upward moves would be concerning
- Broader market correction affecting sector sentiment
- Profit booking pressure at higher levels
My Take:
Overall Assessment:
The technical setup for NSE:EICHERMOT appears constructive, with the stock maintaining its uptrend structure. The recent consolidation phase provides an opportunity for fresh accumulation. Strong fundamentals support the technical outlook with robust sales growth and market share expansion.
Investment Recommendation
Buy on dips strategy recommended for medium to long-term investors. The risk-reward profile remains favourable with multiple technical targets achievable. However, strict stop-loss discipline and position sizing are crucial for risk management.
Time Horizon:
- Short-term (1-3 months): Consolidation with upward bias
- Medium-term (3-6 months): Bullish with a target of ₹6,000
- Long-term (6-12 months): Positive outlook with potential for new highs
The combination of strong fundamentals, healthy technical setup, and favourable sector dynamics makes NSE:EICHERMOT an attractive investment proposition for quality-focused portfolios.
Keep in the Watchlist.
NO RECO. For Buy/Sell.
📌Thank you for exploring my idea! I hope you found it valuable.
🙏FOLLOW for more
👍BOOST if you found it useful.
✍️COMMENT below with your views.
Meanwhile, check out my other stock ideas on the right side until this trade is activated. I would love your feedback.
Disclaimer: "I am not a SEBI REGISTERED RESEARCH ANALYST AND INVESTMENT ADVISER."
This analysis is intended solely for informational and educational purposes and should not be interpreted as financial advice. It is advisable to consult a qualified financial advisor or conduct thorough research before making investment decisions.
GOLD GEARS UP FOR THE NEXT MOVE? All Eyes on Middle East & FedXAUUSD – GOLD GEARS UP FOR THE NEXT MOVE? All Eyes on Middle East & Fed
🌐 MACRO VIEW – WHAT'S MOVING GOLD?
🔺 Fed stays on hold, but Powell remains hawkish – His recent speech signals that inflation may persist due to ongoing geopolitical risks and rising commodity costs...
🔥 Middle East tensions could be the game-changer for gold prices:
If the US steps in as a mediator to de-escalate tensions between Israel and Iran, gold could see a deeper correction toward the 3,357–3,345 support zone, possibly lower...
On the other hand, Trump’s reported alignment with Israel and possible airstrikes on Iran would likely send gold soaring back to 3,417–3,440 levels, acting as a safe haven trigger.
📉 TECHNICAL SETUP (M30)
Gold is moving inside a descending channel, compressing within key EMAs (13–34–89–200).
A potential inverse head & shoulders pattern is forming at the bottom, signaling possible bullish breakout if confirmed.
Support remains firm around 3,345–3,357, while price struggles to break above the upper trendline.
✅ TRADING PLAN
🔵 BUY ZONE: 3,345 – 3,357
Entry: Look for bullish rejection and confirmation
SL: Below 3,342
TP: 3,373 → 3,384 → 3,403 → 3,417 → 3,440
🔴 SELL ZONE: 3,417 – 3,440
Entry: Wait for rejection and bearish confirmation near resistance
SL: Above 3,445
TP: 3,403 → 3,384 → 3,373 → 3,357
💬 FINAL THOUGHTS FOR INDIAN TRADERS
Even though the broader trend remains bullish, gold is not yet ready for a breakout – consolidation continues. Smart traders should stay patient, watch for clean setups, and manage risk well. Keep an eye on political developments, especially involving Iran, Israel, and the US, as they could trigger sharp moves in gold.
Trade smart. Let the market come to you.

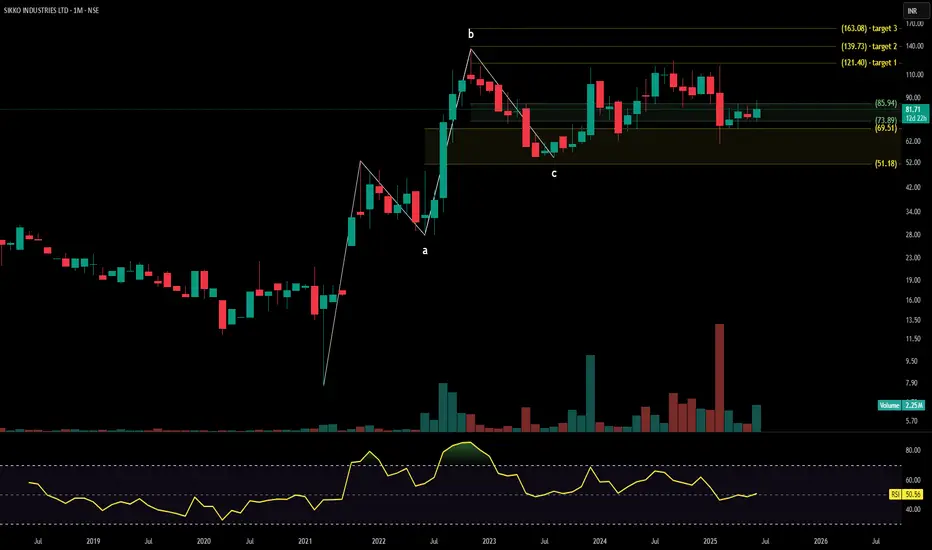
SIKKO INDUSTRIES techno funda analysisSikko Industries Ltd. (NSE: SIKKO) is currently trading at INR 81.71, reflecting a moderate gain over recent months. The company specializes in agriculture chemicals, fertilizers, and biotech solutions, catering to sustainable farming and industrial needs.
Key Levels
Support Levels: INR 85.94, INR 73.89, INR 69.51, INR 51.18
Swing Level: INR 121.40
Possible Upside Levels: INR 139.73, INR 163.08
Technical Indicators
RSI: The Relative Strength Index (RSI) is at 50.56, indicating neutral momentum, suggesting price consolidation before a directional move.
Volume: Trading volume has shown steady participation, though increased volume confirmation near resistance levels would support bullish continuation.
Sector and Market Context
Sikko Industries operates in the agrochemical and biotechnology sector, benefiting from government initiatives promoting organic farming, sustainable fertilizers, and enhanced crop yields. The industry remains robust, backed by seasonal demand cycles and rising agricultural modernization efforts. However, commodity price fluctuations, regulatory approvals, and environmental concerns may affect growth stability.
Latest News and Developments
Market Trends: Increased institutional interest in organic fertilizers and biotech-driven agricultural inputs, supporting long-term demand.
Analyst Ratings: Mixed outlooks, with some analysts pointing to stable growth while others highlight raw material pricing challenges.
Quarterly Results: Sikko Industries has reported steady revenue improvements, driven by higher demand for bio-fertilizers and export market expansion.
Dividend Update: The company has announced a dividend payout of ₹2.50 per share, reinforcing investor confidence in financial sustainability.
Analysis Summary
Sikko Industries Ltd. presents a balanced technical setup, with RSI and volume trends suggesting potential accumulation before an upward movement. Sector growth remains favorable, driven by rising agricultural demand and government support for sustainable farming, though input cost pressures and seasonal trends should be monitored. Investors should track price action near swing levels, broader industry trends, and company-specific financial releases before making strategic decisions.
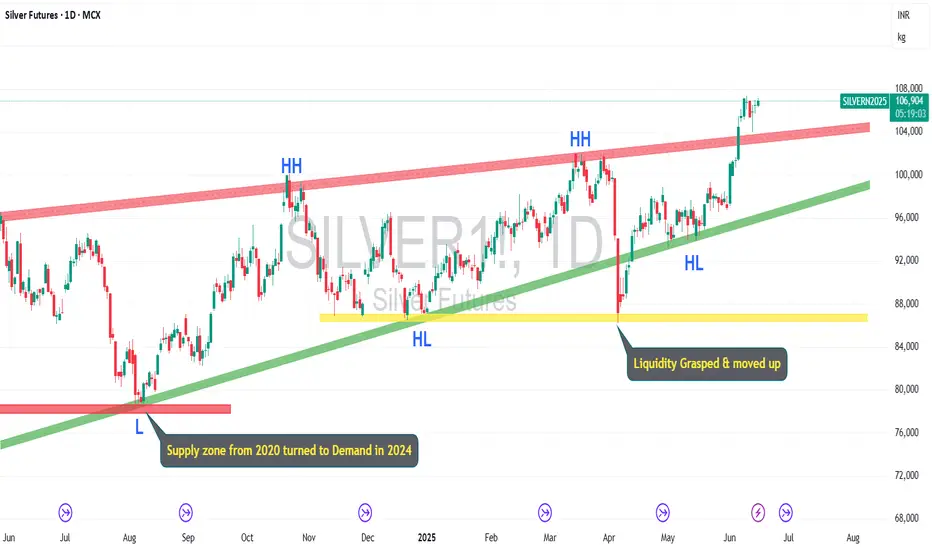
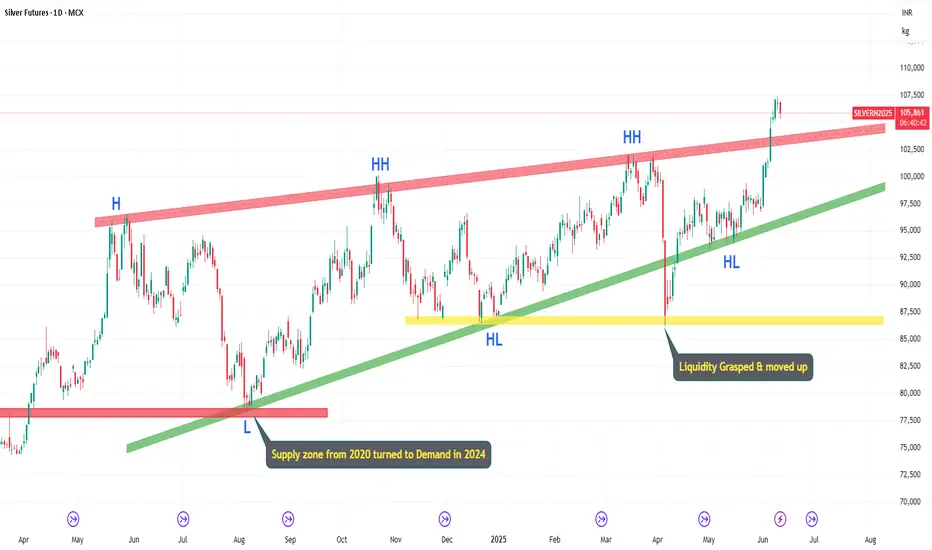
Silver Surges to New Highs After a Decade-Long RallyTechnical Analysis
Silver has had a rollercoaster journey over the past decade. In 2015, silver futures were trading near ₹35,000, but by 2025, prices have tripled, reaching around ₹1,05,000. The journey, however, wasn't smooth.
From 2016 to 2020, silver consistently faced strong resistance between ₹49,000 and ₹51,000. This range capped every bullish move during that period. In 2020, the resistance was finally broken, and silver surged to create a new high at ₹78,000. But post that, silver saw a sharp correction, pulling back significantly.
Interestingly, the same ₹49,000–₹51,000 zone, which acted as resistance for years, now transformed into a strong demand/support zone. This zone offered multiple supports over the following years, solidifying its importance on the chart.
From 2023 to 2024, the ₹78,000 level turned into a fresh resistance, as silver tested this level multiple times without a breakout. Finally, in April 2024, silver broke above ₹78,000 and initiated a strong higher highs and higher lows structure.
On 5th June 2025, silver broke its last higher high, marking a major breakout, and is now trading near ₹1,05,000. This indicates a strong continuation of the bullish trend.
Upside Targets:
🎯 ₹1,08,000 🎯 ₹1,12,000 🎯 ₹1,15,000
Support Levels to Watch:
🔻 ₹1,02,000 – Recent breakout level
🔻 ₹94,000 – Recent higher low
🔻 ₹86,000 – Major demand zone
If silver breaks below ₹86,000, the bullish structure could be invalidated, and a deeper correction may follow.
Fundamental Analysis
Silver is gaining attention as both an industrial metal and a precious asset. The rally in 2025 is not just technical — it's supported by strong fundamentals:
Industrial Demand: Silver is critical for solar panels, electric vehicles, and electronics, all of which are booming sectors.
Supply Constraints: Global mining output has remained tight, causing supply concerns.
Safe-Haven Appeal: Like gold, silver attracts buyers during economic uncertainty.
Global Inflation: Rising inflation has pushed investors toward commodities, particularly silver.
Impact on Related Stocks
Companies that benefit from rising silver prices include:
Hindustan Zinc – major producer of silver in India.
Vedanta – involved in silver extraction as a by-product.
MCX & Commodity Brokers – gain from increased silver trading volumes.
Investment Considerations
✅Pros:
Strong historical performance
Hedge against inflation and currency devaluation
High demand from industrial and green energy sectors
❌Cons:
High volatility compared to gold
Dependent on industrial demand cycles
Not suitable for short-term investors without proper risk management
Investment Options
Silver ETFs – Convenient and low-cost exposure
Silver Futures – For active traders
Physical Silver – Traditional but involves storage issues
Stocks linked to silver – Indirect but potentially high returns
Conclusion
Silver has shown massive strength in 2025, overcoming key resistances and forming a bullish chart structure. With demand rising and technicals confirming strength, silver could continue to shine. However, traders must remain cautious at key support levels, and align their strategy with their risk profile and investment goals.
Whether you're a long-term investor or a short-term trader, silver offers exciting opportunities — just remember to watch the chart and respect the levels!
Disclaimer: lnkd.in
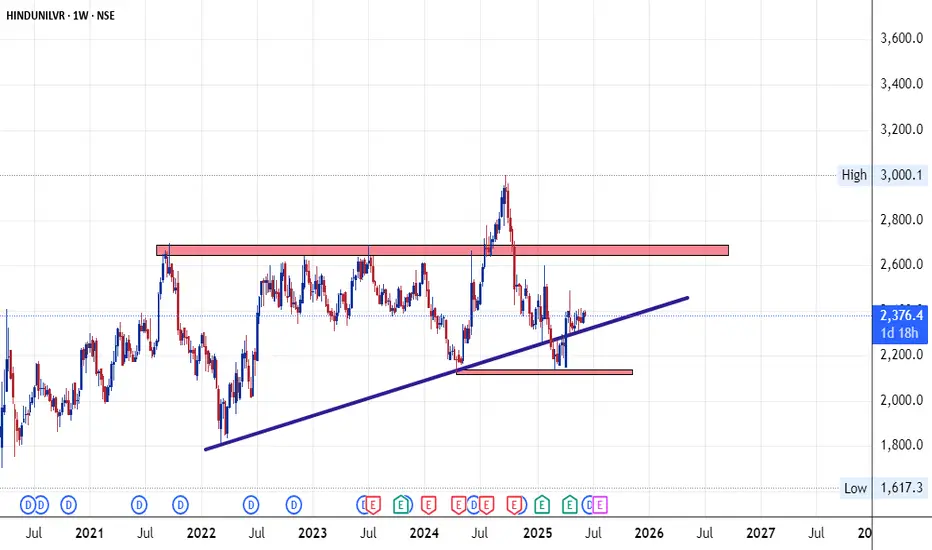
HUL Bullish View **Hindustan Unilever Ltd (HUL) Business Model**:
---
### **Hindustan Unilever Ltd (HUL) – Business Model Overview**
**1. Company Profile:**
* **Founded:** 1933
* **Headquarters:** Mumbai, India
* **Parent Company:** Unilever PLC (UK)
* **Industry:** FMCG (Fast-Moving Consumer Goods)
* **Market Cap (as of 2024):** ₹6.5+ lakh crore
---
### **2. Core Business Segments:**
HUL operates across **three main segments**:
| Segment | Products Included |
| -------------------------- | ---------------------------------------------------------- |
| **Home Care** | Surf Excel, Rin, Vim, Domex, Comfort, etc. |
| **Beauty & Personal Care** | Dove, Lux, Lifebuoy, Clinic Plus, Sunsilk, Pepsodent, etc. |
| **Foods & Refreshments** | Brooke Bond, Lipton, Knorr, Horlicks, Boost, Kissan, etc. |
---
### **3. Revenue Model:**
* **Primary Revenue Source:** Sale of FMCG products via retail and online channels.
* **Secondary Revenue Source:** Royalties & licensing fees from Unilever IP.
* **Strategy:** High-volume, low-margin model; focus on scale and reach.
---
### **4. Key Business Strategies:**
| Strategy | Description |
| ------------------------------ | ---------------------------------------------------------------------------- |
| **Brand Portfolio Management** | Owns 50+ brands across categories; premium to mass-market coverage. |
| **Distribution Network** | Over 8 million retail outlets across India; strong rural & urban reach. |
| **Innovation & R\&D** | Focus on local consumer needs, product customization, sustainable packaging. |
| **Digital Transformation** | Leveraging data, analytics, and e-commerce platforms for sales and outreach. |
| **Sustainability Focus** | Water conservation, plastic recycling, and zero-waste manufacturing. |
---
### **5. Cost Structure:**
* **Raw Materials:** A significant portion of costs; affected by global commodity prices.
* **Marketing & Advertising:** High spend to maintain brand recall.
* **Distribution & Logistics:** Critical for reach in both urban and rural areas.
---
### **6. Target Market:**
* **Urban Middle & Upper-Class**
* **Rural Consumers**
* **Health-Conscious & Youth Segments** (growing focus)
---
### **7. Competitive Advantages:**
* Strong **brand loyalty**.
* Deep **distribution** network.
* Parent support from **Unilever Global**.
* **Scale of operations** gives cost efficiency.
---
### **8. Challenges:**
* Rural slowdown or inflation impacting volumes.
* Raw material price volatility.
* Intense competition from both domestic (Patanjali, Dabur) and global players (P\&G, Colgate).
---
### **9. Growth Drivers:**
* Premiumization of products.
* Expanding into wellness, ayurveda, and healthy food.
* Increasing e-commerce and digital sales channels.
* Rural penetration and aspirational consumption.
---
### **10. Conclusion:**
HUL runs a **resilient, scalable, and consumer-centric business model** that thrives on branding, distribution, and deep consumer insight. With a focus on **sustainability, innovation**, and **digitalization**, it remains a leader in the Indian FMCG space.
---
Thanks & Regards
The Golden Farms of Equity

Hindustan Uniliver Bullish StructureHere's a detailed explanation of the **Hindustan Unilever Ltd (HUL) Business Model**:
---
### **Hindustan Unilever Ltd (HUL) – Business Model Overview**
**1. Company Profile:**
* **Founded:** 1933
* **Headquarters:** Mumbai, India
* **Parent Company:** Unilever PLC (UK)
* **Industry:** FMCG (Fast-Moving Consumer Goods)
* **Market Cap (as of 2024):** ₹6.5+ lakh crore
---
### **2. Core Business Segments:**
HUL operates across **three main segments**:
| Segment | Products Included |
| -------------------------- | ---------------------------------------------------------- |
| **Home Care** | Surf Excel, Rin, Vim, Domex, Comfort, etc. |
| **Beauty & Personal Care** | Dove, Lux, Lifebuoy, Clinic Plus, Sunsilk, Pepsodent, etc. |
| **Foods & Refreshments** | Brooke Bond, Lipton, Knorr, Horlicks, Boost, Kissan, etc. |
---
### **3. Revenue Model:**
* **Primary Revenue Source:** Sale of FMCG products via retail and online channels.
* **Secondary Revenue Source:** Royalties & licensing fees from Unilever IP.
* **Strategy:** High-volume, low-margin model; focus on scale and reach.
---
### **4. Key Business Strategies:**
| Strategy | Description |
| ------------------------------ | ---------------------------------------------------------------------------- |
| **Brand Portfolio Management** | Owns 50+ brands across categories; premium to mass-market coverage. |
| **Distribution Network** | Over 8 million retail outlets across India; strong rural & urban reach. |
| **Innovation & R\&D** | Focus on local consumer needs, product customization, sustainable packaging. |
| **Digital Transformation** | Leveraging data, analytics, and e-commerce platforms for sales and outreach. |
| **Sustainability Focus** | Water conservation, plastic recycling, and zero-waste manufacturing. |
---
### **5. Cost Structure:**
* **Raw Materials:** A significant portion of costs; affected by global commodity prices.
* **Marketing & Advertising:** High spend to maintain brand recall.
* **Distribution & Logistics:** Critical for reach in both urban and rural areas.
---
### **6. Target Market:**
* **Urban Middle & Upper-Class**
* **Rural Consumers**
* **Health-Conscious & Youth Segments** (growing focus)
---
### **7. Competitive Advantages:**
* Strong **brand loyalty**.
* Deep **distribution** network.
* Parent support from **Unilever Global**.
* **Scale of operations** gives cost efficiency.
---
### **8. Challenges:**
* Rural slowdown or inflation impacting volumes.
* Raw material price volatility.
* Intense competition from both domestic (Patanjali, Dabur) and global players (P\&G, Colgate).
---
### **9. Growth Drivers:**
* Premiumization of products.
* Expanding into wellness, ayurveda, and healthy food.
* Increasing e-commerce and digital sales channels.
* Rural penetration and aspirational consumption.
---
### **10. Conclusion:**
HUL runs a **resilient, scalable, and consumer-centric business model** that thrives on branding, distribution, and deep consumer insight. With a focus on **sustainability, innovation**, and **digitalization**, it remains a leader in the Indian FMCG space.
---
Thanks & Regards
Mohinder Singh
Silver Surges to New Highs After a Decade-Long RallyTechnical Analysis
Silver has had a rollercoaster journey over the past decade. In 2015, silver futures were trading near ₹35,000, but by 2025, prices have tripled, reaching around ₹1,05,000. The journey, however, wasn't smooth.
From 2016 to 2020, silver consistently faced strong resistance between ₹49,000 and ₹51,000. This range capped every bullish move during that period. In 2020, the resistance was finally broken, and silver surged to create a new high at ₹78,000. But post that, silver saw a sharp correction, pulling back significantly.
Interestingly, the same ₹49,000–₹51,000 zone, which acted as resistance for years, now transformed into a strong demand/support zone. This zone offered multiple supports over the following years, solidifying its importance on the chart.
From 2023 to 2024, the ₹78,000 level turned into a fresh resistance, as silver tested this level multiple times without a breakout. Finally, in April 2024, silver broke above ₹78,000 and initiated a strong higher highs and higher lows structure.
On 5th June 2025, silver broke its last higher high, marking a major breakout, and is now trading near ₹1,05,000. This indicates a strong continuation of the bullish trend.
Upside Targets:
🎯 ₹1,08,000 🎯 ₹1,12,000 🎯 ₹1,15,000
Support Levels to Watch:
🔻 ₹1,02,000 – Recent breakout level
🔻 ₹94,000 – Recent higher low
🔻 ₹86,000 – Major demand zone
If silver breaks below ₹86,000, the bullish structure could be invalidated, and a deeper correction may follow.
Fundamental Analysis
Silver is gaining attention as both an industrial metal and a precious asset. The rally in 2025 is not just technical — it's supported by strong fundamentals:
Industrial Demand: Silver is critical for solar panels, electric vehicles, and electronics, all of which are booming sectors.
Supply Constraints: Global mining output has remained tight, causing supply concerns.
Safe-Haven Appeal: Like gold, silver attracts buyers during economic uncertainty.
Global Inflation: Rising inflation has pushed investors toward commodities, particularly silver.
Impact on Related Stocks
Companies that benefit from rising silver prices include:
Hindustan Zinc – major producer of silver in India.
Vedanta – involved in silver extraction as a by-product.
MCX & Commodity Brokers – gain from increased silver trading volumes.
Investment Considerations
✅ Pros:
Strong historical performance
Hedge against inflation and currency devaluation
High demand from industrial and green energy sectors
❌ Cons:
High volatility compared to gold
Dependent on industrial demand cycles
Not suitable for short-term investors without proper risk management
Investment Options
Silver ETFs – Convenient and low-cost exposure
Silver Futures – For active traders
Physical Silver – Traditional but involves storage issues
Stocks linked to silver – Indirect but potentially high returns
Conclusion
Silver has shown massive strength in 2025, overcoming key resistances and forming a bullish chart structure. With demand rising and technicals confirming strength, silver could continue to shine. However, traders must remain cautious at key support levels, and align their strategy with their risk profile and investment goals.
Whether you're a long-term investor or a short-term trader, silver offers exciting opportunities — just remember to watch the chart and respect the levels!
SREE RAYALSEEMA technical analysisSree Rayalaseema Hi-Strength Hypo Ltd. (NSE: SRHHYPOLTD) is currently trading at INR 635.55, reflecting a 9.75% increase. The company is a leading manufacturer of inorganic chemicals, serving industries such as water treatment, pharmaceuticals, and agriculture. This company is part of TGV SRAAC Group.
Key Levels
Support Levels: INR 414.80, INR 522.95
Swing Level: INR 635.55
Possible Upside Levels: INR 922.75, INR 1,071.65, INR 1,261.30
Technical Indicators
RSI: The Relative Strength Index (RSI) is at 53.41, indicating neutral to bullish momentum, suggesting potential price strength with further upside possibilities.
Volume: Trading volume is 993.96K, reflecting active investor participation, which may validate movements toward higher price levels if sustained.
Sector and Market Context
Sree Rayalaseema Hi-Strength Hypo Ltd. operates within the chemical manufacturing sector, which has seen consistent demand growth driven by industrial expansion, water purification needs, and increasing pharmaceutical applications. The industry benefits from government regulations favoring environmental sustainability and chemical safety standards. However, global raw material cost fluctuations, export restrictions, and regulatory shifts could impact profitability. Investors continue to monitor commodity price trends and policy changes influencing chemical manufacturers.
Latest News and Developments
Market Trends: Growing demand for water treatment chemicals and pharmaceutical-grade hypo solutions, strengthening industry prospects.
Analyst Ratings: Some analysts maintain a positive outlook, citing steady revenue generation and operational efficiency.
Quarterly Results: The company posted stable earnings, supported by higher industrial orders and improved export margins.
Dividend Update: Sree Rayalaseema Hi-Strength Hypo Ltd. has declared a dividend payout of ₹7 per share, reinforcing investor confidence in its financial stability.
Analysis Summary
Sree Rayalaseema Hi-Strength Hypo Ltd. presents a strong technical structure, with RSI and volume trends confirming positive investor sentiment. The stock benefits from sector tailwinds, driven by rising industrial demand and regulatory support, though macro risks such as raw material costs and trade policies should be monitored. Investors should track price action near resistance levels, broader chemical industry trends, and company-specific financial updates before making strategic decisions.

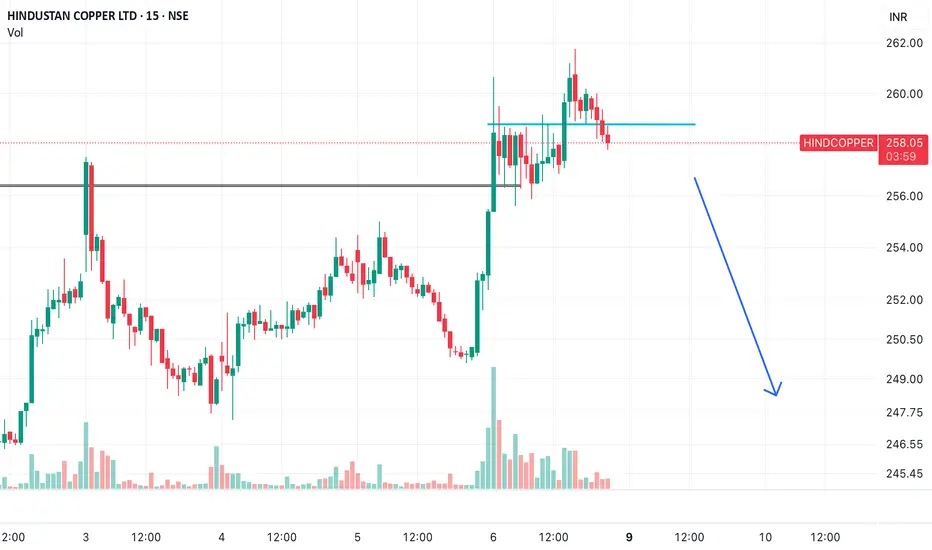
Time to Short the Spark Out of Hindustan Copper
Trade Type:
Short – Breakdown Trade (Technical)
Rationale:
Hindustan Copper (NSE: HINDCOPPER) is exhibiting a classic intraday breakdown below its immediate support level near ₹258, confirmed on the 15-minute chart. The stock attempted to hold above the ₹260 consolidation range but failed to sustain, triggering a bearish setup.
Recent price action indicates distribution after a strong vertical rally, followed by lower highs and a clean support retest. The breakdown is accompanied by declining volume on the retest and loss of buying interest, suggesting increased probability of a short-term retracement.
This short call is purely tactical and is based on weakness in short time frames. There are no fundamental changes to the long-term outlook at this time.
Trade Details:
• Entry: Sell below ₹257.80
• Stop Loss: ₹260.20 (above resistance retest)
• Targets:
• T1: ₹252.50
• T2: ₹248.00
• Extended: ₹245.00 (only if momentum sustains)
Risk Management:
• Risk-to-reward ratio: Approx. 1:2.5 (for first two targets)
• Position sizing should be conservative, considering general market volatility and sectoral strength in metals.
Remarks:
No confirmation from broader commodity cues; this is a structure-led trade. Any intraday bullish reversal or closing back above ₹260 will negate the setup.
Why RADICO KHAITAN’S Moves Against the Industry TrendStrong Financial Performance and Premiumization Strategy:
Q4 FY25 Results: Radico reported a robust 70.78% increase in net profit to ₹92.07 crore and a 20.90% rise in sales to ₹1,304.08 crore for the quarter ended March 2025, compared to the previous year. For the full year, net profit grew 31.83% to ₹345.61 crore, and sales rose 17.79% to ₹4,851.15 crore. This strong financial performance, particularly in the Prestige & Above (P&A) category (14% volume growth and 19% value growth in Q1 FY25), indicates successful premiumization, setting Radico apart from competitors facing slower growth.
Luxury Brand Focus: Radico’s strategic pivot toward luxury and premium segments, with launches like Ankahi Zaffran Spiced Liqueur at ProWein 2025 and brands like Rampur Asava and Jaisalmer Gold Edition, positions it to capture the growing demand for high-end spirits in India and globally. This focus on premiumization contrasts with regional players focusing on lower-margin segments, giving Radico a competitive edge.
Global Ambitions: The company’s efforts to establish Indian Single Malts as a global standard and its partnership with Saregama for innovative marketing (e.g., Magic Moments Music Studio) enhance brand visibility, potentially driving market share gains despite industry challenges.
Stock Price Volatility and Market Trends:
Short-Term Declines: Despite strong fundamentals, Radico experienced stock price declines in February 2025, with losses ranging from 3.03% to 3.52% on specific days, underperforming the sector on occasions (e.g., -0.81% vs. sector on Feb 28). These declines align with broader market volatility and sector-specific challenges, such as rising input costs (food grain inflation) and delayed excise policies during elections, which impacted industry volumes by 3-4%.
Rebounds and Outperformance: Radico also showed resilience, with notable rebounds like a 3.3% gain on Feb 27 and a 3.02% gain on Feb 19, outperforming the sector by 4.91% and 0.78%, respectively. These recoveries suggest market recognition of Radico’s strong fundamentals, even amidst sector downturns.
Moving Averages: The stock’s position below short-term moving averages (5-day, 20-day) but above longer-term ones (100-day, 200-day) during parts of 2025 indicates mixed sentiment—short-term bearish trends due to market volatility but longer-term bullishness driven by fundamentals.
Analyst Optimism and Market Sentiment:
Analyst Ratings: Analysts remain bullish, with 14 analysts rating RADICO as a “buy” and a 1-year price target of ₹2,733.64 (max ₹3,000, min ₹2,483) as of June 2025. Motilal Oswal initiated coverage with a “Buy” call and a ₹3,000 target, reflecting confidence in Radico’s growth trajectory.
Stock Price Targets: Forecasts suggest significant upside, with a potential increase to ₹2,920.34 in one year (+15.21%) and ₹4,787.14 by 2030 (+88.86%), driven by Radico’s strong brand portfolio and market positioning. This contrasts with the sector’s mixed performance, where competitors may not have similar growth prospects.
Industry-Specific Challenges:
Sector Volatility: The Breweries & Distilleries sector faced challenges in 2025, including a 3.61% sector decline on Feb 12 and broader market fluctuations. Radico’s underperformance on certain days (e.g., -3.11% on Feb 11) reflects these industry headwinds, but its ability to outperform on others (e.g., +0.65% vs. sector on Jan 1) highlights its relative strength.
Input Cost Pressures: Food grain inflation and volatile commodity prices slightly reduced gross margins (41.5% in Q1 FY25 vs. 43.6% prior year). However, Radico’s leadership expects stabilization, supported by government management of rice stocks, which may mitigate sector-wide cost pressures more effectively for Radico due to its backward integration efforts.
Competitive Landscape:
Regional vs. National Players: Radico faces competition in the P&A and luxury segments from organized players, but its leadership believes it is ahead due to innovative marketing and product quality. Regional players are more active in lower segments, not directly competing with Radico’s premium focus.
Market Positioning: Radico’s extensive distribution network and brands like Magic Moments Vodka (1.9 million cases sold in Q1 FY25, sixth largest vodka brand globally) provide a competitive moat, allowing it to navigate industry challenges better than smaller or less diversified peers.
Why RADICO Moves Against the Industry Trend:
Outperformance: Radico’s focus on premium and luxury segments, strong financial growth (e.g., 31.83% net profit increase in FY25), and global brand-building efforts drive periods of outperformance, as seen in its 55.57% stock price increase over the past year (vs. Sensex’s 8.14%) and all-time high of ₹2,665 on May 7, 2025.
Underperformance: Short-term declines (e.g., -15.21% in Feb 2025 vs. Sensex’s -0.74%) reflect broader market volatility, sector-specific challenges like input cost inflation, and election-related excise policy delays, which temporarily align Radico with or exaggerate industry downturns.
Resilience: Radico’s ability to rebound (e.g., +3.3% on Feb 27) and maintain analyst confidence (strong buy ratings) suggests that its strategic focus on premiumization and operational efficiencies (e.g., near debt-free target by FY26) allows it to recover faster than the sector average.
Conclusion:
Radico Khaitan’s movement against the industry trend in 2025 stems from its strategic focus on premium and luxury segments, robust financial performance, and strong analyst backing, which drive outperformance during bullish periods. However, short-term declines reflect sector-wide challenges like market volatility, input cost pressures, and regulatory hurdles, where Radico occasionally underperforms due to its high valuation (noted as an “Expensive Performer”). Its long-term outlook remains positive, with analysts forecasting significant growth, supported by premiumization and global expansion efforts.

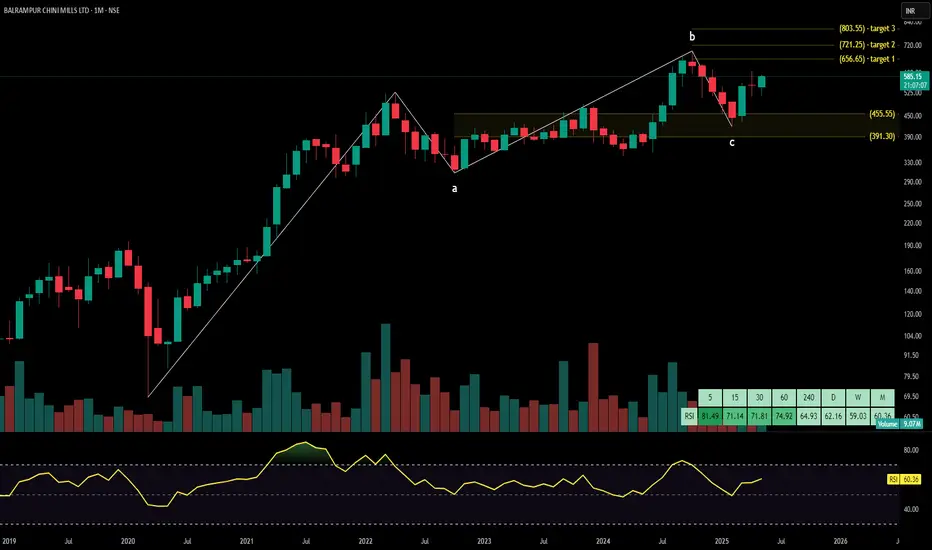
BALRAMPUR CHINI MILLS technical analysisBalrampur Chini Mills Ltd. (NSE: BALRAMCHIN) is currently trading at INR 585.15. The company is one of India's leading integrated sugar manufacturers, engaged in sugar production, ethanol manufacturing, and cogeneration of power from sugarcane byproducts.
Key Levels
Support Level: INR 391.30, INR 455.55, INR 483.40, INR 523.25
Swing Level: INR 585.15
Possible Upside Levels: INR 656.65, INR 721.25, INR 803.55
Technical Indicators
RSI: The Relative Strength Index (RSI) is currently at 60.36, suggesting strong momentum as the stock approaches the overbought zone. This indicates bullish sentiment with potential for further price gains.
Volume: Trading volume is 9.07M, reflecting high investor participation. Increased volume around key price levels may confirm breakouts or trend reversals.
Sector and Market Context
Balrampur Chini Mills Ltd. operates in the sugar industry, which remains highly cyclical and dependent on government policies, weather conditions, and global sugar prices. The ethanol blending initiative in India has boosted industry-wide demand, with sugar mills increasingly focusing on ethanol production to diversify revenue streams. Additionally, government-imposed minimum support prices for sugarcane and export restrictions continue to shape pricing dynamics. The broader market outlook suggests positive momentum for sugar stocks, driven by higher ethanol demand, stable domestic sugar consumption, and global supply constraints.
Latest News and Developments
Market Trends: Institutional investors remain bullish on sugar stocks due to strong ethanol demand and favorable regulatory policies.
Analyst Ratings: Some analysts forecast steady revenue growth, highlighting ethanol's increasing contribution to earnings.
Quarterly Results: The company reported improved earnings, supported by higher sugar prices and stable ethanol production margins.
Dividend Update: The firm has maintained a consistent dividend payout, reinforcing confidence in long-term profitability.
Analysis Summary
Balrampur Chini Mills Ltd. exhibits strong technical momentum, with RSI and volume indicating continued investor interest. Sector dynamics remain favorable, driven by government support for ethanol and steady sugar consumption. Investors should monitor commodity price trends, policy developments, and macroeconomic indicators before making strategic decisions. A balanced approach is advisable, considering cyclical industry risks alongside growth opportunities.
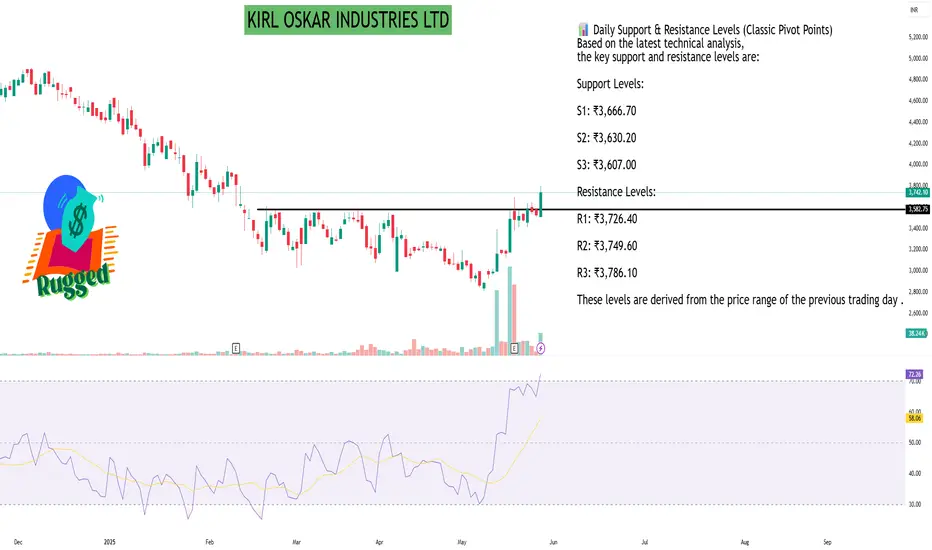
KIRL OSKAR INDUSTRIES LTDAs of May 28, 2025, Kirloskar Industries Ltd. (NSE: KIRLOSIND) is trading at ₹3,739.20, marking a 6.03% increase from the previous close .
📊 Daily Support & Resistance Levels (Classic Pivot Points)
Based on the latest technical analysis, the key support and resistance levels are:
Support Levels:
S1: ₹3,666.70
S2: ₹3,630.20
S3: ₹3,607.00
Resistance Levels:
R1: ₹3,726.40
R2: ₹3,749.60
R3: ₹3,786.10
These levels are derived from the price range of the previous trading day .
📈 Technical Indicators Overview
Relative Strength Index (RSI): 77.5 – Indicates overbought conditions.
MACD (12,26): 47.84 – Suggests bullish momentum.
Commodity Channel Index (CCI): 165.79 – Points to strong upward movement.
Moving Averages: The stock is trading above its 5-day, 10-day, 20-day, 50-day, 100-day, and 200-day simple and exponential moving averages, indicating a strong bullish trend .
🔍 Market Sentiment
The technical indicators collectively suggest a strong bullish sentiment for Kirloskar Industries Ltd. However, the RSI indicates that the stock is in overbought territory, which may lead to a short-term correction. Investors should monitor the support and resistance levels closely for potential breakout or pullback scenarios.
Please note that stock market investments are subject to market risks, and it's essential to conduct thorough research or consult with a financial advisor before making investment decisions.
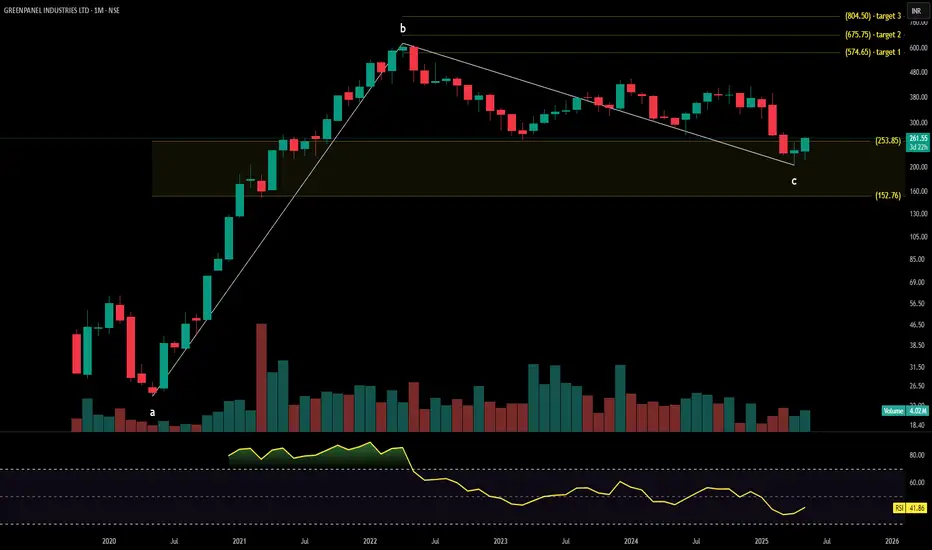
GREENPANEL INDUSTRIES technical analysisGreenpanel Industries Ltd. (NSE: GREENPANEL) is currently trading at INR 261.55. The company specializes in medium-density fiberboard (MDF) and plywood manufacturing, serving both domestic and export markets with a strong focus on innovation and sustainable production.
Key Levels
Support Level: INR 198.75
Swing Level: INR 305.60
Possible Upside Levels: INR 574.65, INR 675.75, INR 804.50
Technical Indicators
RSI: The Relative Strength Index (RSI) is at 41.86, indicating neutral momentum with a slight downward bias. RSI below 50 often suggests mild bearish sentiment.
Volume: Trading volume is moderate, reflecting steady investor participation. Increased volume near resistance levels could validate upward movement, while declining volume near support may suggest consolidation.
Sector and Market Context
Greenpanel Industries operates within the building materials and furniture manufacturing sector, which has witnessed steady demand growth due to urbanization, real estate expansion, and rising consumer preference for MDF-based furniture. However, the sector is also subject to commodity price fluctuations, interest rate cycles affecting real estate, and import-export policy changes. Market conditions indicate cautious optimism, with investors tracking housing sector performance and raw material cost trends.
Latest News and Developments
Market Trends: Institutional interest in building materials stocks remains strong, though rising input costs could pressure margins.
Analyst Ratings: Recent reports suggest mixed sentiment, with some analysts projecting gradual demand recovery in the domestic market.
Quarterly Results: Greenpanel Industries posted stable revenue, though margins saw compression due to rising material costs.
Dividend Update: No recent dividend announcements, indicating continued reinvestment in operational efficiency and expansion.
Analysis Summary
Greenpanel Industries Ltd. presents a balanced technical outlook, with RSI and key levels indicating potential price stabilization before trend confirmation. The stock benefits from sector tailwinds, though macroeconomic risks—such as input costs and demand cycles—must be monitored. Investors should watch price action near swing levels, volume trends, and sector-wide developments before making decisions. A calibrated approach is advisable, considering both the growth potential and inherent market risks.
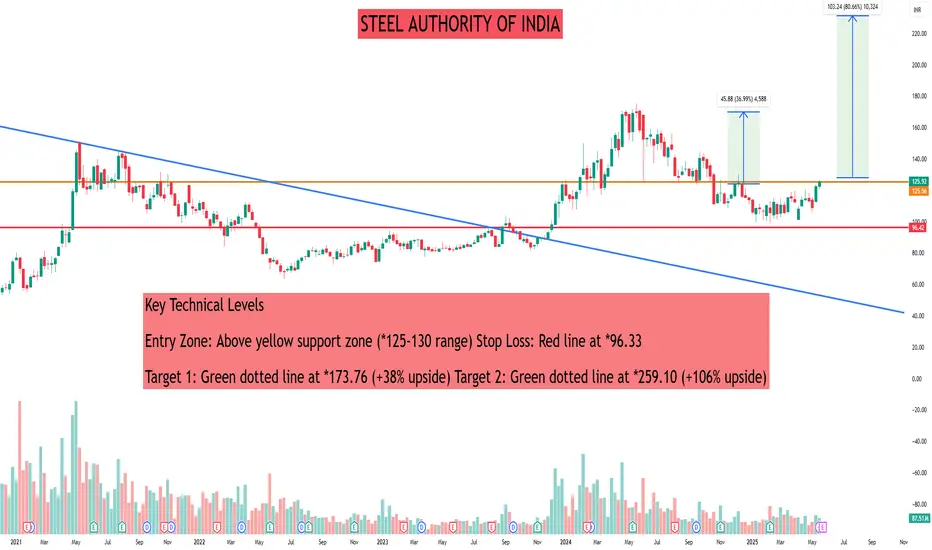
STEEL AUTHORITY OF INDIASTEEL AUTHORITY OF INDIA
Sail long.....
SAIL Technical Breakout Setup
Current Price: *125.74 (+2.66%)
Date: May 23, 2025
Key Technical Levels
Entry Zone: Above yellow support zone (*125-130 range) Stop Loss: Red line at *96.33
Target 1: Green dotted line at *173.76 (+38% upside) Target 2: Green dotted line at *259.10 (+106% upside)
Technical Analysis
Pattern Recognition:
SAIL is forming a long-term triangular consolidation pattern
Stock is approaching the apex of a multi-year triangle
Blue diagonal trendline acts as major resistance since 2008 highs
Yellow horizontal zone provides strong support
Current Market Structure:
Price is holding above the critical yellow support zone
Recent bounce shows buying interest at these levels
Volume appears to be picking up on the recent move
Probability Assessment
Target 1 (*173.76) Probability: Moderate to High
This level represents the previous resistance zone
If breakout sustains above ₹130, this becomes achievable
Risk-reward ratio: Approximately 1:1.6
Target 2 (*259.10) Probability: Lower
This is an ambitious target requiring significant momentum
Would need broader market support and sector rotation
Risk-reward ratio: Approximately 1:5.5
Trading Strategy
For Aggressive Traders:
Enter on sustained close above *130
Partial booking at Target 1
Trail stop loss for Target 2
For Conservative Traders:
Wait for weekly close above *135
Smaller position size given the risk
Risk Management:
Strict stop loss at *96.33 (23% downside risk)
Position sizing should reflect the volatility
Important Notes:
Steel sector performance depends on infrastructure spending
Global commodity prices impact fundamentals
This is a technical setup - fundamental analysis required separately
This analysis is for educational purposes. Trade at your own risk.
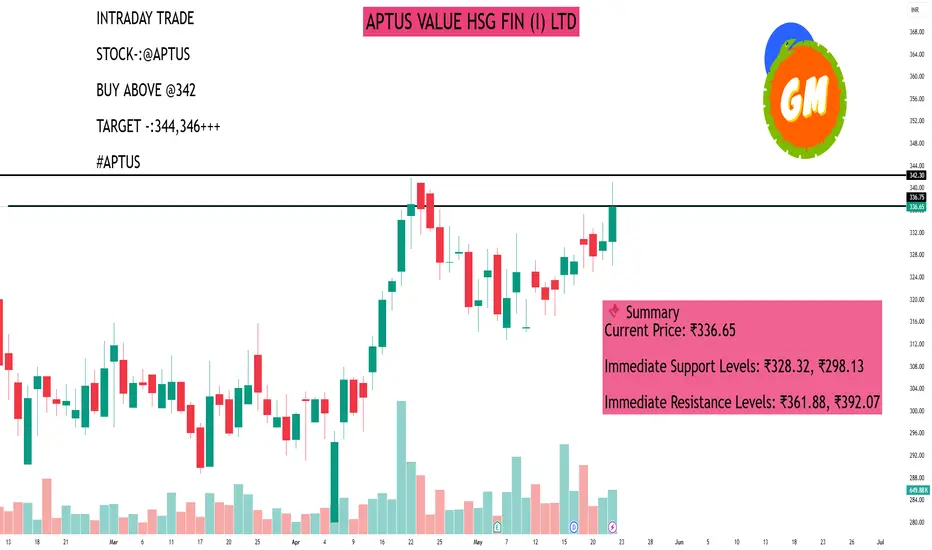
APTUS VALUE HSG FIN (I) LTDAs of May 22, 2025, Aptus Value Housing Finance India Ltd (NSE: APTUS) closed at ₹336.65, marking a 1.89% increase from the previous session.
📊 Daily Support and Resistance Levels
Based on technical analysis, the following support and resistance levels have been identified for Aptus Value Housing Finance India Ltd:
Classic Pivot Points:
Pivot Point: ₹328.32
Support Levels:
S1: ₹298.13
S2: ₹264.57
S3: ₹234.38
Resistance Levels:
R1: ₹361.88
R2: ₹392.07
R3: ₹425.63
Fibonacci Retracement Levels (from recent downtrend):
Resistance Levels:
23.6%: ₹319.49
38.2%: ₹323.75
50%: ₹327.20
61.8%: ₹330.65
76.4%: ₹334.91
📈 Technical Indicators Overview
Relative Strength Index (RSI): 43.56 (indicates a bearish trend)
Stochastic RSI: 11.05 (oversold condition)
MACD: 0.47 (bullish crossover)
Average Directional Index (ADX): 31.01 (indicates a strong trend)
Commodity Channel Index (CCI): -165.91 (suggests the stock is oversold)
📌 Summary
Current Price: ₹336.65
Immediate Support Levels: ₹328.32, ₹298.13
Immediate Resistance Levels: ₹361.88, ₹392.07
Given the current technical indicators and support/resistance levels, traders should exercise caution. Monitoring the stock's movement around these key levels can provide insights into potential trading opportunities. It's advisable to consider these technical factors in conjunction with broader market trends and fundamental analysis before making investment decisions.
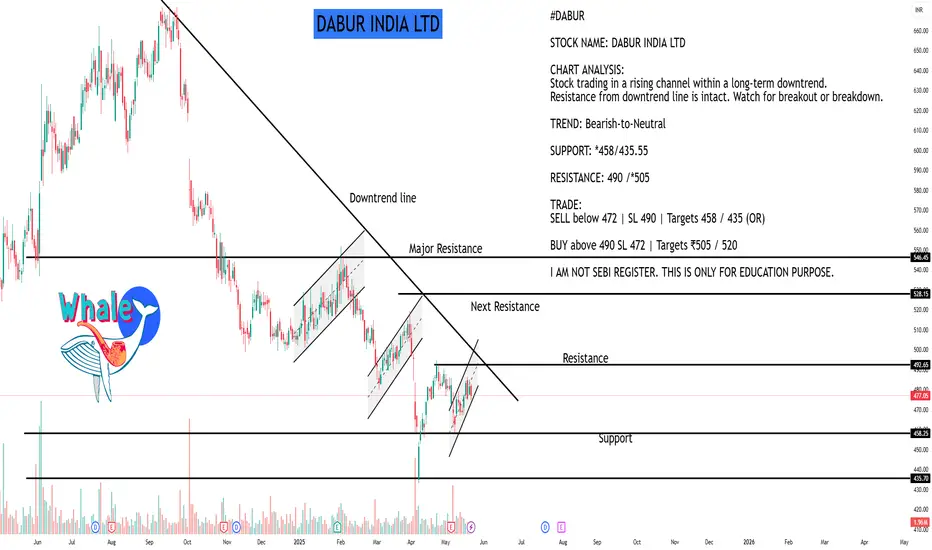
DABUR INDIA LTDAs of May 22, 2025, Dabur India Ltd (NSE: DABUR) closed at ₹477.05, reflecting a 0.98% decline from the previous session.
📊 Daily Support and Resistance Levels
Based on technical analysis, the following support and resistance levels have been identified for Dabur India Ltd:
Classic Pivot Points:
Pivot Point: ₹476.48
Support Levels:
S1: ₹474.61
S2: ₹473.23
S3: ₹471.36
Resistance Levels:
R1: ₹477.86
R2: ₹479.73
R3: ₹481.11
Additional Support and Resistance Levels:
Support: ₹470.28, ₹473.67, ₹478.38
Resistance: ₹481.77, ₹486.48, ₹489.87
📈 Technical Indicators Overview
The current technical indicators suggest a bearish outlook for Dabur India Ltd:
Relative Strength Index (RSI): 43.56 (indicates a bearish trend)
Stochastic RSI: 11.05 (oversold condition)
MACD: 0.47 (bullish crossover)
Average Directional Index (ADX): 31.01 (indicates a strong trend)
Commodity Channel Index (CCI): -165.91 (suggests the stock is oversold)
📌 Summary
Current Price: ₹477.05
Immediate Support Levels: ₹474.61, ₹473.23, ₹471.36
Immediate Resistance Levels: ₹477.86, ₹479.73, ₹481.11
Given the current technical indicators and support/resistance levels, traders should exercise caution. Monitoring the stock's movement around these key levels can provide insights into potential trading opportunities. It's advisable to consider these technical factors in conjunction with broader market trends and fundamental analysis before making investment decisions.
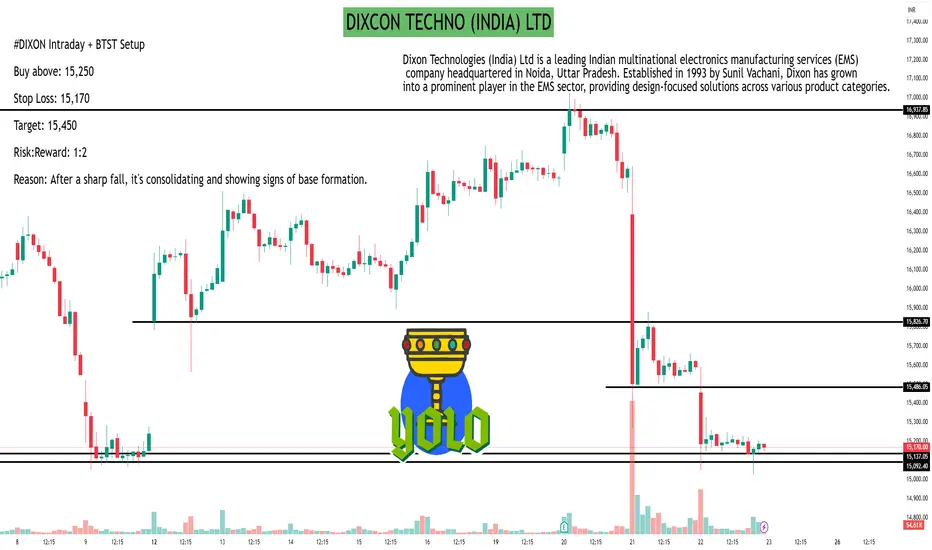
DIXCON TECHNO (INDIA) LTDAs of May 22, 2025, Dixon Technologies (India) Ltd (NSE: DIXON) closed at ₹15,170.00, reflecting a 2.84% decline from the previous close of ₹15,612.00.
30-Minute Support and Resistance Levels
Based on the 30-minute technical analysis, the following pivot points have been identified:
Classic Pivot Points:
Resistance Levels:
R1: ₹15,184.66
R2: ₹15,305.33
R3: ₹15,383.66
Support Levels:
S1: ₹14,985.66
S2: ₹14,907.33
S3: ₹14,786.66
Pivot Point: ₹15,106.33
Fibonacci Pivot Points:
Resistance Levels:
R1: ₹15,182.35
R2: ₹15,229.31
R3: ₹15,305.33
Support Levels:
S1: ₹15,030.31
S2: ₹14,983.35
S3: ₹14,907.33
Pivot Point: ₹15,106.33
Camarilla Pivot Points:
Resistance Levels:
R1: ₹15,082.24
R2: ₹15,100.48
R3: ₹15,118.73
Support Levels:
S1: ₹15,045.76
S2: ₹15,027.52
S3: ₹15,009.27
Pivot Point: ₹15,106.33
These levels can serve as reference points for intraday trading strategies.
Technical Indicators Overview
The current technical indicators suggest a bearish outlook:
Relative Strength Index (RSI): 30.31, indicating the stock is approaching oversold territory.
Moving Average Convergence Divergence (MACD): -311.32, signaling downward momentum.
Average Directional Index (ADX): 53.38, suggesting a strong trend.
Commodity Channel Index (CCI): -112.93, indicating a potential oversold condition.
Rate of Change (ROC): -8.43, reflecting negative momentum.
Bull/Bear Power: -681.10, emphasizing bearish dominance.
Overall, the technical analysis points to a strong sell signal.
Analyst Ratings
Analyst consensus on Dixon Technologies is mixed:
Strong Buy: 8 analysts
Buy: 8 analysts
Hold: 3 analysts
Sell: 6 analysts
Strong Sell: 1 analyst
This distribution indicates a cautious stance among analysts, with a notable number recommending buying the stock, while others advise selling.
Sail long .....SAIL Technical Breakout Setup 📈
Current Price: ₹125.74 (+2.66%)
Date: May 23, 2025
Key Technical Levels
Entry Zone: Above yellow support zone (₹125-130 range)
Stop Loss: Red line at ₹96.33
Target 1: Green dotted line at ₹173.76 (+38% upside)
Target 2: Green dotted line at ₹259.10 (+106% upside)
Technical Analysis
Pattern Recognition:
SAIL is forming a long-term triangular consolidation pattern
Stock is approaching the apex of a multi-year triangle
Blue diagonal trendline acts as major resistance since 2008 highs
Yellow horizontal zone provides strong support
Current Market Structure:
Price is holding above the critical yellow support zone
Recent bounce shows buying interest at these levels
Volume appears to be picking up on the recent move
Probability Assessment
Target 1 (₹173.76) Probability: Moderate to High
This level represents the previous resistance zone
If breakout sustains above ₹130, this becomes achievable
Risk-reward ratio: Approximately 1:1.6
Target 2 (₹259.10) Probability: Lower
This is an ambitious target requiring significant momentum
Would need broader market support and sector rotation
Risk-reward ratio: Approximately 1:5.5
Trading Strategy
For Aggressive Traders:
Enter on sustained close above ₹130
Partial booking at Target 1
Trail stop loss for Target 2
For Conservative Traders:
Wait for weekly close above ₹135
Smaller position size given the risk
Risk Management:
Strict stop loss at ₹96.33 (23% downside risk)
Position sizing should reflect the volatility
⚠️ Important Notes:
Steel sector performance depends on infrastructure spending
Global commodity prices impact fundamentals
This is a technical setup - fundamental analysis required separately
This analysis is for educational purposes. Trade at your own risk.

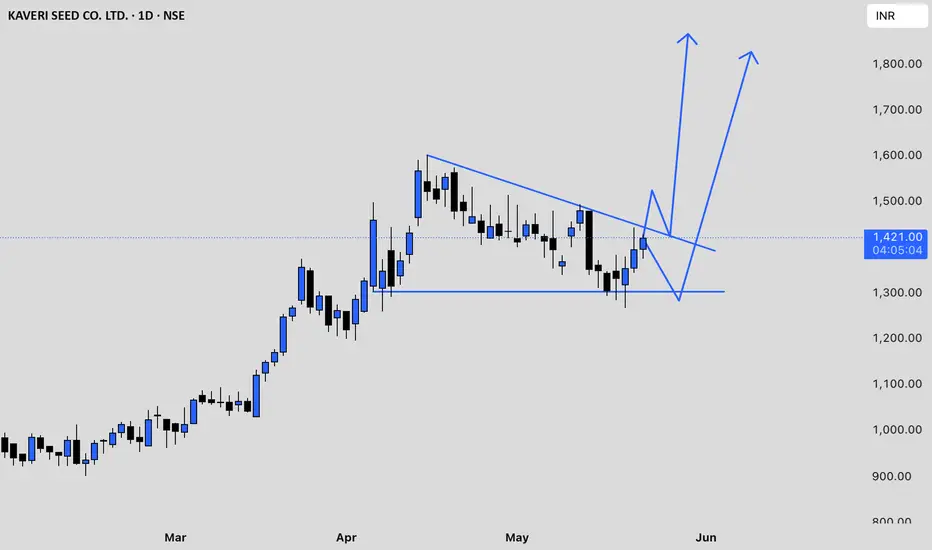
KSCL chart analysisKaveri Seed Company Ltd (KSCL) has recently experienced significant volatility. After reaching a peak above ₹1,480 in mid-May 2025, the stock corrected sharply, falling to the ₹1,305–₹1,345 range by May 16, marking a notable pullback of nearly 9% in a single session. Trading volumes have been high, indicating strong market participation during both the rally and the subsequent sell-off.
From a technical perspective, KSCL’s price remains above its 50-day, 100-day, and 200-day exponential moving averages, which suggests that the longer-term trend is still bullish. However, momentum indicators such as the Relative Strength Index (RSI) and Commodity Channel Index (CCI) are both in oversold territory, signaling that the recent correction may have been overdone and that a technical bounce could be possible if market sentiment improves. The Moving Average Convergence Divergence (MACD) is below its signal line, and the Average Directional Index (ADX) indicates the presence of a short-term downtrend.
Immediate support for KSCL is seen around ₹1,232, with further support at ₹1,174 and ₹1,116. On the upside, resistance is expected near ₹1,399, then at ₹1,457 and ₹1,515. The near-term pivot area is around ₹1,340–₹1,350.
Recent company developments—including the acquisition of a 30% stake in Aditya Agri Tech Pvt Ltd and the release of Q4 and FY25 results—may be influencing the current price action. The company has also been working to address challenges in receivables management, which could impact future performance.
In summary, KSCL is in a corrective phase after a strong rally, with oversold technical indicators suggesting potential for a short-term rebound if support holds. However, the short-term trend remains down, so traders should watch for stabilization above key support levels before considering new long positions. The longer-term outlook stays positive as long as the price remains above major moving averages, but caution is advised due to ongoing volatility and bearish momentum signals.
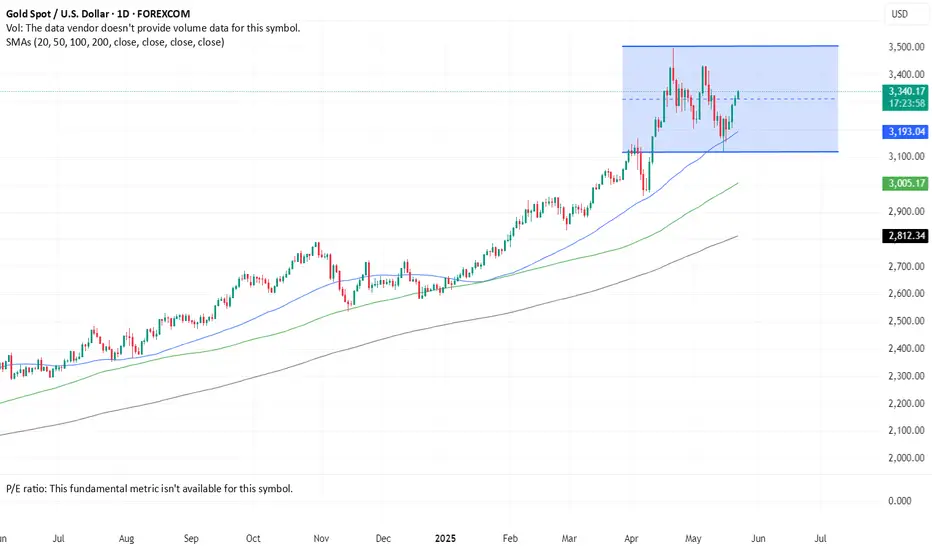
Gold - Consolidating in Parallel ChannelGold has been steadily rising since decisively crossing the all-time high of 2075 on March 1, 2024.
The safe-haven commodity retracted after a long shadow candle on April 22, 2025, ending a year-long bull run.
Gold is now in a parallel channel between 3120 (lower) and 3500 (higher).
Consolidation may continue, with a bias towards profit booking.
The 50 SMA acts as a strong support level, providing low-risk entry when prices dip below it.
Gold should be part of a portfolio, but current prices seem high for investment. Traders can consider entering based on their risk-reward appetite, taking cues from the 50 SMA and parallel trend.
Disclaimer : This post does not recommend any trade. It aims to better understand the chart.
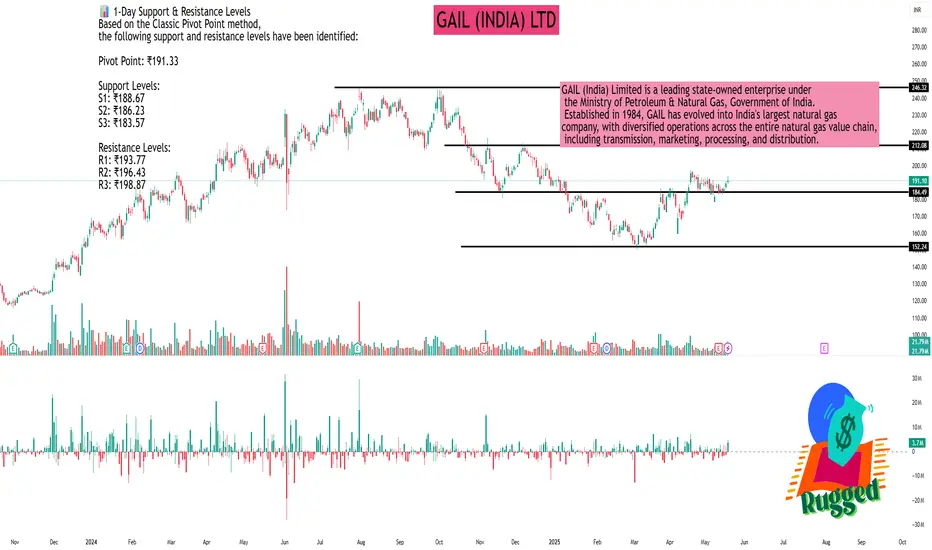
GAIL (INDIA) LTDAs of May 21, 2025, GAIL (India) Ltd. (NSE: GAIL) is trading at ₹191.10, reflecting a 0.86% increase from the previous close.
📊 1-Day Support & Resistance Levels
Based on the Classic Pivot Point method, the following support and resistance levels have been identified:
Pivot Point: ₹191.33
Support Levels:
S1: ₹188.67
S2: ₹186.23
S3: ₹183.57
Resistance Levels:
R1: ₹193.77
R2: ₹196.43
R3: ₹198.87
📈 Technical Indicators
Relative Strength Index (RSI): 60.63 – Indicates bullish momentum.
MACD (12,26): 1.34 – Suggests a bullish crossover.
Average Directional Index (ADX): 35.59 – Reflects a strong trend.
Commodity Channel Index (CCI): 48.46 – Neutral.
Rate of Change (ROC): 2.75 – Positive momentum.
Money Flow Index (MFI): Not specified.
📉 Moving Averages
50-day EMA: ₹226.29
200-day EMA: Not specified.
The current price is below the 50-day EMA, indicating a potential bearish trend in the short term.
🔍 Market Outlook
GAIL (India) Ltd. is exhibiting mixed signals. While technical indicators like RSI and MACD suggest bullish momentum, the stock trading below its 50-day EMA indicates caution. Traders should monitor the support and resistance levels closely; a breach above R1 (₹193.77) could indicate further upside, while a drop below S1 (₹188.67) might suggest a potential decline.
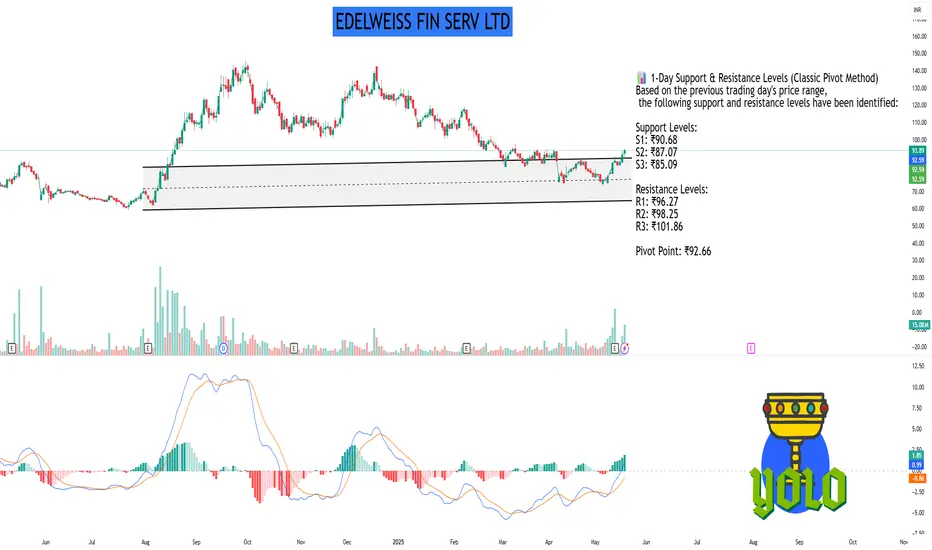
EDELWEISS FIN SERV LTDAs of May 21, 2025, Edelweiss Financial Services Ltd. (NSE: EDELWEISS) is trading at ₹93.89, marking a 2.84% increase over the previous day.
TradingView
📊 1-Day Support & Resistance Levels (Classic Pivot Method)
Based on the previous trading day's price range, the following support and resistance levels have been identified:
Support Levels:
S1: ₹90.68
S2: ₹87.07
S3: ₹85.09
Resistance Levels:
R1: ₹96.27
R2: ₹98.25
R3: ₹101.86
Pivot Point: ₹92.66
🔍 Technical Indicators
Relative Strength Index (RSI): 58.01 (indicates uptrend)
Commodity Channel Index (CCI): 62.68 (indicates uptrend)
Money Flow Index (MFI): 74.25 (indicates strong uptrend)
📈 Moving Averages
20-day EMA: ₹90.32
50-day EMA: ₹88.93
100-day EMA: ₹86.66
200-day EMA: ₹84.35
📝 Trading Insights
The current price is above the pivot point, suggesting a bullish stance. If the price continues to rise, it may test the resistance levels. Conversely, a drop below the pivot could lead to testing the support levels.