USDT.D looks again bearish USDT.D likely to bleed but we need to see us markets opening and performance .
#Bitcoin #nft #bnb #eth #btc #BSC #Binance #trading #altcoins #cryptocurrency #crypto #sol
Search in ideas for "CRYPTO"

USDT.D looks bearish USDT forming bearish shark harmonic bat pattern if pattern move successfully we can see the alt coins rally.
#Bitcoin #nft #bnb #eth #btc #BSC #Binance #trading #altcoins #cryptocurrency #crypto #sol

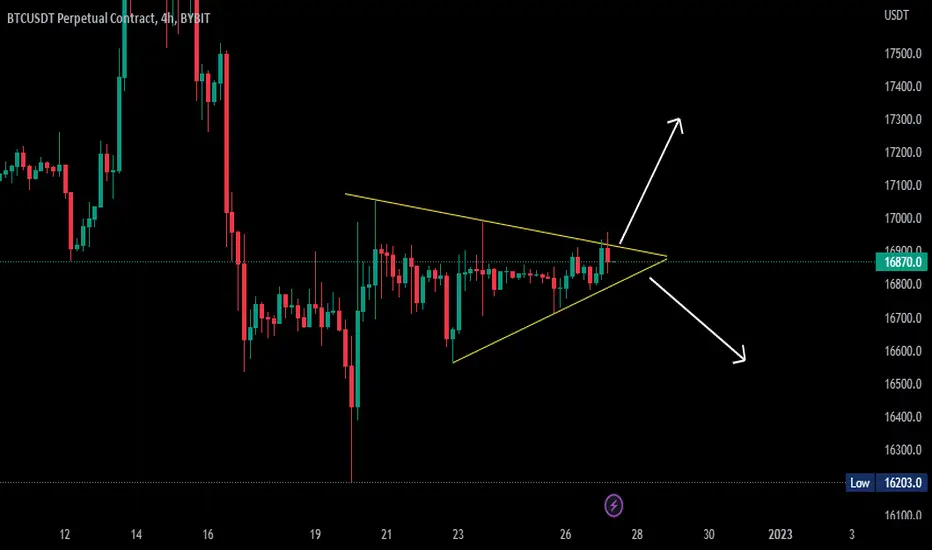
BTC formed symmetrical triangle patternWe need to observe breakout, if it is downside btc will bearish up to 16000, if it move upwards we can see btc will try to touch 17100.
#Bitcoin #nft #bnb #eth #btc #BSC #Binance #trading #altcoins #cryptocurrency #crypto #sol
USDT IN SYMMETRICAL TRAINGLEIf it breaks upside we can see total market will bleed in case in breaks downside we can expect market will be bullish. so no proper idea in market market is consolidation face so better to trade less and invest more.
#Bitcoin #nft #bnb #eth #btc #BSC #Binance #trading #altcoins #cryptocurrency #crypto #sol

USDT.D will decide the market direction.IF usdt breaks support market will rally orlse market will take more correction, Core PCE Price Index m/m data will also decide.#Bitcoin #nft #bnb #eth #btc #BSC #Binance #trading #altcoins #cryptocurrency #crypto #sol

ETH MOSTLY LOOKS MOVE UPSIDE#eth move is depends on US markets , if the markets move will that will help ETH to move. #Bitcoin #nft #bnb #eth #btc #BSC #Binance #trading #altcoins #cryptocurrency #crypto #sol

MOSTLY BTC WILL MOVE UPSIDEBtc move is depends on US markets , if the markets move will that will help btc to move. #Bitcoin #nft #bnb #eth #btc #BSC #Binance #trading #altcoins #cryptocurrency #crypto #sol

ETH WILL MOVE VILOIENTLY AT 1050 PRICE We can expect bullish move of eth but as of now it is bearish becoz of usdt breakout and bull flag in usdt, if usdt will start slow down then we can start longs on eth. #Bitcoin #nft #bnb #eth #btc #BSC #Binance #trading #altcoins #cryptocurrency #crypto #sol

BTC IS LOOKING BOUNCE FROM 15700 AREA we are seeing bullish pattern in btc , it will bleed for some time becoz of usdt breakout. #Bitcoin #nft #bnb #eth #btc #BSC #Binance #trading #altcoins #cryptocurrency #crypto #sol

ALTCOINS HAVE HIGH CHANCE TO MOVE UPSIDEUSDT.D is seeing little correct at the same time we can observe correction in BTC.D in Harmonic pattern, mostly move upwards. if it lost support market will bleed more, be careful market sentiment is worst. #Bitcoin #nft #bnb #eth #btc #BSC #Binance #trading #altcoins #cryptocurrency #crypto #sol

ALTCOINS ARE GOING TO BLEED BTC.D is looking double bottom and most important support area of high demand , we can see the alts are going to bleed for 2 days.
#Bitcoin #nft #bnb #eth #btc #BSC #Binance #trading #altcoins #cryptocurrency #crypto #sol

USDT WAITING FOR BREAKOUTonce direction is decided we may see massive breakout and correction in alts , mostly 13th USA CPI data will determine.
#Bitcoin #nft #bnb #eth #btc #BSC #Binance #trading #altcoins #cryptocurrency #crypto #sol

#USDT.DOMINANCE 1DAY UPDATE !!USDT DOMINANCE ANALYSIS
USDT dominance support label 100 MA and USDT dominance breaks 100 MA to the downside then can see the usdt dominance 5.84% and also 5.33 altcoin will be pump and BTC will pump
This is not a piece of financial advice. All investment made by me is at my own risk and I am held responsible for my own profit and losses. So, do your own research before investing in this trade.
Thanks for your time, we hope our work is good for you, and you are satisfied, we wish you a good day and big profits.
THANK YOU.

#USDT.DOMINANCE 4Hr UPDATE !!USDT DOMINANCE ANALYSIS
As we can see just like BTC USDT dominance too currently trading in range-bound mode.
Currently, USDT DOMINANCE is rejected from the upper resistance level and now moving down to the lower support zone.
Just like before from the support level it can reverse again so be cautious with your trades at this level and keep an eye on it.
Break below support level will be great for alt coins to print more green candles.
Let's see how ut performs in upcoming hours.
This is not a piece of financial advice. All investment made by me is at my own risk and I am held responsible for my own profit and losses. So, do your own research before investing in this trade.
Sorry for my English it is not my native language.
Do hit the like button if you like it and share your charts in the comments section.
Thank you.

Descending Channel Unfortunately Doge had suffered a strong loss just like the Other big Cryptos right after News with China banning all Cryptocurrency.
This has happened previously in 2013, 2017
Its not the first time China has done this.
This is what they do to manipulate the Price.
The price is likely to Drop to the lower support line around 0.22s

Intense Fall Yesterday Bitcoin had suffered an intense Crash with the price falling below 30k usd right after the News with China banning all Cryptocurrency.
This has happened previously in 2013, 2017
Its not the first time China has done this.
This is what they do to manipulate the Price.

[CRYPTO] BUY IOTABTC AROUND 3880IOTA looks good around 3880 levels for marked targets with green lines until 3160 is intact on a closing basis.
To motivate me, Please like the idea If you agree with the analysis.
Happy Trading!
InvestPro India Team

TRX/USDT ( TRON ) LONGGGG !!!!- Cryptos have turned bullish after the recent correction .
- TRX has broken previous high and retesting that level right now .
- Long trade setup has been given above . Trade according to the levels
- Maintain strict stoploss
- Message me to learn how to TRADE crypto currency in INDIA .
- Message me to learn how I fix my targets.

TRX / USD Price Analysis: Alone In The DarkTRON / USD Short-term price analysis
TRON has a neutral short-term trading bias, with the cryptocurrency rallying back towards its 200-period moving average on the four-hour time frame.
The four-time frame continues to show a large head and shoulders pattern, with TRX / USD buyers still unable to invalidate the bearish pattern.
Technical indicators on the four-hour time frame are bullish and continue to point to further upside in the short-term.
Pattern Watch
Traders should note that the April 16th swing-high currently offers the strongest form of near-term technical resistance for the TRX / USD pair.
Relative Strength Index
The Relative Strength Index has turned bullish on the four-hour time frame and shows scope for further upside.
MACD Indicator
The MACD indicator has turned bullish on the four-hour time frame and also shows scope for further upside.
Fundamental Analysis
Tron is making gains after its CEO Justin Sun made Binance an offer to deposit 7,000 BTC worth of USDT ($40 million USDT) to buy BNB, BTC, and TRX. This was done to ‘support’ the exchange (which had plenty in reserve) after hackers were able to withdraw 7,000 BTC from its hot wallet.
Yesterday, Justin Sun also announced that TRX will be back to Top-10 in June. Although this sounds like an attempt to pump the coin, it is still possible that Sun knows more than the rest of the market.
It is also possible that Sun continues to spout hype instead of substance. Last night’s ‘generous’ offer to cover the 7,000 BTC security breach at Binance, seems to be another of his thinly-disguised and regular taunts at other cryptocurrency community members.
Sun’s regular trolling of Ethereum figures, and his go-it-alone philosophy, may pay dividends if he can create substantial adoption of the cryptocurrency – or it may backfire, leaving TRON isolated in an industry that values partnerships.
TRON / USD Medium-term price analysis
TRON has a bullish medium-term outlook, with the TRX / USD pair moving back towards key trendline resistance on the daily time frame.
Bullish MACD price divergence is still evident on the daily time frame, which could be reversed if the bullish inverted head and shoulders pattern on the mentioned time frame is triggered.
Technical indicators on the daily time frame are starting to turn bullish, following the latest rally in the TRX / USD pair.
TRX / USD Daily Chart by TradingView
Pattern Watch
Traders should note that the June 21st, 2018 swing-high is the initial upside target of the inverted head and shoulders pattern on the daily time frame.
Relative Strength Index
The RSI indicator is still bullish on the daily time frame and shows scope for further upside.
MACD Indicator
The MACD indicator on the daily time frame has turned bullish and is generating a buy signal.
Fundamental Analysis
In the medium term, the project looks speculative. Although it deploys an aggressive marketing strategy, its technology still suffers from security flaws. For example, the recently discovered security breach could have been used to shut down the network with just one computer.
Conclusion
TRON is attempting to recover bullish trading momentum, with short-term buyers now needing to rally the TRX / USD pair even higher to invalidate the bearish pattern on the four-hour time frame.
If buyers can ignite the inverted head and shoulders pattern on the daily time frame a bullish technical breakout rally is likely to occur over the medium-term.

ZEN / BTC Price Analysis: ArisingHorizen / Bitcoin Short-term price analysis
ZEN has a bullish short-term trading bias against BTC, with the ZEN / BTC pair trading well above its 200-period moving average on the four-hour time frame.
The four-hour time frame is showing that the ZEN / BTC pair is gaining bullish trading momentum and attempting to correct back towards the April monthly trading high.
Technical indicators are bullish on the four-hour time frame, although they are starting to appear overstretched.
Pattern Watch
Traders should note that an inverted head and shoulders pattern will form on the four-hour time frame if bulls move price back towards the April trading high.
Relative Strength Index
The RSI indicator on the four-hour time frame is bullish, although it has moved into overbought territory.
MACD Indicator
The MACD indicator on the four-hour time frame is also bullish, although it is starting to appear overstretched.
Fundamental Analysis
In April, Horizen partnered with Horizen Labs which has raised 4$ million from Digital Currency Group (DCG) and Liberty City Ventures. Horizen Labs will be working with businesses to help them build their own sidechains on top of the Horizen’s public blockchain. This is likely the reason why ZEN’s price has been growing for the past several weeks.
Horizen / Bitcoin Medium-term price analysis
ZEN has a bullish bias against BTC over the medium-term, with the ZEN / BTC pair trading back above its 200-day moving average.
The daily time frame shows a large inverted head and shoulders pattern, with buyers rallying the ZEN / BTC pair back above the neckline of the bullish pattern.
Technical indicators across the daily time frame are currently rising and issuing a strong bullish signal.
ZEN / BTC Daily Chart by TradingView
Pattern Watch
Traders should note that the November 18th, 2018 swing high is the overall upside target of the inverted head and shoulders pattern on the daily time frame.
Relative Strength Index
The RSI indicator is also bullish on the daily time frame, although it is approaching overbought territory.
MACD Indicator
The MACD indicator is bullish on the daily time frame and is currently generating a strong buy signal.
Fundamental Analysis
Horizen looks interesting on the fundamental level. It has a good development team and plans a number of technological improvements to its platform in 2019. Along with Horizen Labs the project can potentially increase the level of adoption of its platform, which can have a positive effect on the value of the network in the medium term.
Conclusion
ZEN is growing increasingly bullish against BTC over both time frames as the cryptocurrency attempts to recover from last month’s trading losses.
If bulls can maintain the bullish momentum and continue to rally the ZEN / BTC pair, a much stronger rally towards the November 18th swing high may occur.

TRX / USD Price Analysis: Resisting PressureTRON / USD Short-term price analysis
TRX has a bearish short-term trading bias, with the cryptocurrency now trading below its 200-period moving average on the four-hour time frame.
The four-hour time frame shows the presence of a head and shoulders pattern with the TRX / USD pair edging towards the neckline of the bearish pattern.
Technical indicators on the four-hour time frame are bullish and continue to point to further upside in the short-term.
Pattern Watch
Traders should note that the TRX / USD pair could fall to a new 2019 trading low if the head and shoulders pattern on the four-hour time frame is triggered.
Relative Strength Index
The Relative Strength Index has turned bullish on the four-hour time frame and shows scope for further upside.
MACD Indicator
The MACD indicator has turned bullish on the four-hour time frame and is currently issuing a buy signal.
TRON / USD Medium-term price analysis
TRX has a bullish medium-term outlook, with the TRX / USD pair still maintaining price above its key 200-day moving average.
The daily time frame continues to show a large inverted head and shoulders pattern, with bullish MACD price divergence still evident from June 2018.
Technical indicators on the daily time frame are attempting to stabilize following the recent decline in the TRX / USD pair.
TRX / USD Daily Chart by TradingView
Pattern Watch
Traders should note that the June 21st, 2018 swing-high is the upside target of the inverted head and shoulders pattern on the daily time frame.
Relative Strength Index
The RSI indicator is still bearish on the daily time frame, although it is attempting to recover higher.
MACD Indicator
The MACD indicator on the daily time frame is flat and is currently failing to generate a clear trading signal.
Conclusion
TRX is under pressure in the short-term, with the bearish pattern on the four-hour time frame issuing a warning that the cryptocurrency could still decline further.
The prospects for the TRX / USD pair remain bright, with the inverted head and shoulders pattern and the presence of bullish MACD divergence on the daily time frame still pointing to more upside over the medium-term.

VET / USD Price Analysis: Overcoming Selling PressureVET / USD Short-term price analysis
VET has a bearish short-term outlook, with the cryptocurrency now trading below its 200-period moving average on the four-hour time frame.
The four-hour time frame is also showing that a large head and shoulders pattern is starting to take shape. Bulls need to move price above the April 19th swing-high to invalidate the bearish pattern.
Technical indicators on the four-hour time frame have turned bullish and signal a potential upside.
Pattern Watch
Traders should note that the VET / USD pair will fall towards its current 2019 trading low if the head and shoulders pattern is triggered.
Relative Strength Index
The RSI indicator on the four-hour time frame is bullish and is showing scope for future upside.
MACD Indicator
The MACD indicator on the four-hour time frame is currently bullish, with the MACD signal line and MACD histogram both generating strong buy signals.
Fundamental Analysis
VET has been up for the past several weeks with some positive news. During the VET Summit in San Francisco, the company has announced that it is working with BMW on building the VerifyCar app which addresses the mileage fraud problem present in one-third of vehicles in Germany. Deloitte has also announced that it will develop a blockchain solution based on VEThor and migrate from the Ethereum network.
VET / USD Medium-term price analysis
VET has a bullish medium-term trading outlook, with the VET / USD pair still trading above its trend-defining 200-day moving average.
The daily time frame is showing that the VET / USD pair has started to come under technical selling pressure after price fell below key trendline support.
Technical indicators on the daily time frame are attempting to correct higher following the recent decline in the VET / USD pair.
VET / USD Daily Chart by TradingView
Pattern Watch
Traders should note that a valid falling wedge pattern is also present on the daily time frame.
Relative Strength Index
The RSI indicator on the daily time frame has started to turn bullish and shows scope for further upside.
MACD Indicator
The MACD indicator is neutral on the daily time frame, with the MACD indicating currently failing to generate a clear trading signal.
Fundamental Analysis
VET has shown strong fundamentals at the beginning of 2019 which should positively affect the adoption of its network. The team continues to develop strong partnerships and is starting to present working products that utilize its blockchain. These factors should help the project to grow in the medium-term.
Conclusion
VET is attempting to recover higher after relinquishing a portion of its recent gains. Short-term bulls will need to work hard to negate the bearish pattern on the four-hour time frame, while the daily time frame is showing that buyers must move price above key trendline resistance or downside pressures could return.

Waves / USD Price Analysis: Destructive InterferenceWaves / USD Short-term price analysis
Waves has a bearish short-term outlook, with the cryptocurrency now trading well below its 200-period moving average on the four-hour time frame.
The four-hour time frame is also showing a bearish breakout from a descending triangle pattern. The bullish breakout above the triangle pattern that occurred earlier this month now appears to be a false breakout.
Technical indicators across the four-hour time frame have turned bearish, although they now appear oversold.
Pattern Watch
Traders should note that a bearish head and shoulders pattern is now also visible across the four-hour time frame.
Relative Strength Index
The RSI indicator on the mentioned time frame is also bearish, although it is now extremely oversold.
MACD Indicator
The MACD indicator on the four-hour time frame is heavily bearish, with the MACD signal crossing issuing a strong sell signal.
Waves / USD Medium-term price analysis
Waves has a bearish medium-term outlook, with the cryptocurrency now technically bearish and trading below its 200-day moving average.
The daily time frame chart shows that the Waves/USD pair has now fallen below a symmetrical triangle pattern and remains vulnerable to further losses.
Technical indicators on the daily time frame have turned bearish and show scope for further downside.
WAVES / USD Daily Chart by TradingView
Pattern Watch
Traders should note that following the bearish triangle breakout the Waves/USD pair has fallen to a new 2019 trading low.
Relative Strength Index
The RSI indicator on the daily time frame has also turned bearish and shows scope for further downside.
MACD Indicator
The MACD indicator has turned bearish on the daily time frame, with the MACD histogram and the MACD signal line both generating a clear sell signal.
Conclusion
Waves has now turned bearish across both time horizons, with the recent decline in the cryptocurrency forcing the Waves / USD pair into a much lower trading range.
The bearish patterns seen across the four-hour and daily time frames may lead to further losses towards the December 2018 trading low.
