💡Don't miss the great buy opportunity in IOTABTCTrading suggestion:
". There is a possibility of temporary retracement to the suggested support line (0.0000307).
. if so, traders can set orders based on Price Action and expect to reach short-term targets."
Technical analysis:
. IOTABTC is in a range bound, and the beginning of an uptrend is


[CRYPTO] BUY IOTABTC AROUND 3880IOTA looks good around 3880 levels for marked targets with green lines until 3160 is intact on a closing basis.
To motivate me, Please like the idea If you agree with the analysis.
Happy Trading!
InvestPro India Team


💡 It's a great buy opportunity in IOTA/BTC @iota @BitcoinTrading suggestion:
. There is a possibility of temporary retracement to the suggested support line (0.00002155). If so, traders can set orders based on Price Action and expect to reach short-term targets.
Technical analysis:
. IOTABTC is in a uptrend and the continuation of uptrend is expected.

There is a trading opportunity to buy in IOTABTCMidterm forecast:
While the price is above the support 18.20995, beginning of uptrend is expected.
We make sure when the resistance at 26.50000 breaks.
If the support at 18.20995 is broken, the short-term forecast -beginning of uptrend- will be invalid.
Technical analysis:
A trough is formed in

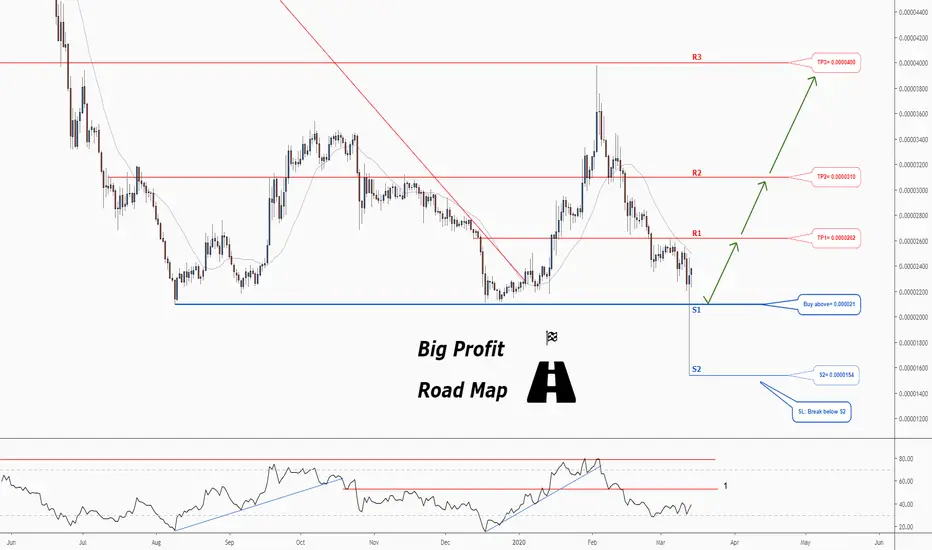
Don't miss the great buy opportunity in IOTABTCTrading suggestion:
. There is a possibility of temporary retracement to suggested support line (0.000021). if so, traders can set orders based on Price Action and expect to reach short-term targets.
Technical analysis:
. IOTABTC is in a range bound and the beginning of uptrend is expected.
There is a trading opportunity to buy in IOTABTCTechnical analysis:
. Miota/Bitcoin is in a range bound and the beginning of uptrend is expected.
. The price is below the 21-Day WEMA which acts as a dynamic resistance.
. The RSI is at 40.
Trading suggestion:
. There is a possibility of temporary retracement to suggested support zone (0.

There is a trading opportunity to buy in IOTABTCTechnical analysis:
. Miota/Bitcoin is in a range bound and the beginning of uptrend is expected.
.The price is above the 21-Day WEMA which acts as a dynamic support.
. The RSI is at 63.
Trading suggestion:
. There is a possibility of temporary retracement to suggested support zone (0.00002


See all ideas