Can Heightened Social Metrics Drive Momentum In NEAR ProtocolCan Heightened Social Metrics Drive Momentum In NEAR Protocol
The social metrics have surged indicating a heightened user engagement in the asset.
The daily chart highlights the formation of a declining channel pattern with the price hovering near the boundary.
NEAR Protocol price has loomed back towards the recent demand of $3.5 level following the chaos in the broader markets. The Blue chip cryptocurrencies like Bitcoin and Ethereum are slipping towards the lows raising concerns about a further drawdown in the altcoins.
At the time of writing, Bitcoin had wiped out nearly 2.9% in intraday and was headed towards the psychological level of $55K. Whereas, Ethereum traded near $2380 losing 2.8% a day.
Moreover, the NEAR Protocol which had been in a correction phase for the last couple of months seemed to be stabilizing near the recent support amid the broader market's turmoil. Recently, the bulls attempted for a recovery which seemed to be vanishing after the broader market weakened.
Despite all, few on-chain metrics are pointing towards a possible recovery in the asset's price. Let's analyze and try to find whether the drawdown may continue or a recovery is likely in NEAR.
Social Metrics On the Rise: A Recovery is Likely?
The recent sessions saw a price rejection from the higher levels amid the rising investor concerns in the broader markets. However, the analysts have observed a notable change in the social metrics and transaction volume which suggests a recovery might be round the corner.
The social metrics is an on-chain data including social dominance and social volume. As per the analysts, the social metrics curve was observed to be headed upwards indicating the increasing participation of the social media users.
The social activities including Twitter news, Twitter followers, and social volume (including active users of Telegram and Twitter) reflects how much it is talked about, valued, and sought after by the crypto community.
Moreover, the transaction volume has increased from $130 Million a day to $160 Million at present suggesting a heightened demand in the asset. The volume to market cap ratio at 3.89% indicates low volatility in the crypto.
With a live market capitalization of $4.2 Billion NEAR protocol ranks 20th in the cryptoverse.
Bullish Or Bearish: Where Is NEAR Headed This Month?
The daily chart highlights the formation of a declining channel pattern with the price hovering between the upper and lower boundary of the channel. For the Majority of August, NEAR Protocol's price hovered in a range bounded zone with $3.5 as support and $5 level as resistance.
On the higher side, Near protocol has enough space till the psychological $7 level which is the upper boundary of the channel. However, it required a breakout above the psychological $5 level. The long term trend outlook is on the bearish side which may make it difficult for the bulls to overcome challenges on the higher side.
Also, NEAR price hovers below all the key Exponential moving averages of 20, 50 and 200 days suggesting a weak trend outlook and more favorable condition for the sellers. On the lower side, if the price breaks below the $3.5 level it indicates a bearish continuation and may drag the price towards the $3 level.
The RSI and 14 day SMA line were observed to be flat and hovering below the mean line indicating a neutral to bearish outlook in the short run.
Search in ideas for "Ethereum"

Dash Price Plummets 23%, Cryptocurrency Investors in FrenzyDash Price Plummets 23%, Cryptocurrency Investors in Frenzy
The broader markets have experienced a heavy selloff in the last couple of sessions.
Dash price is on a 5 day losing streak eroding nearly 23% of its value in the period.
The broader markets crashed in the last couple of sessions after the investors feared a recession. At the time of writing, Bitcoin was exchanging hands close to $53.1K having lost over 9% whereas Ethereum unfolded by over 12% to $2350 in intraday.
The crash in the blue chip cryptocurrencies triggered a panic among the investors. Moreover, the altcoins also followed the market leaders and plummeted the same way. Dash price has slumped in the recent sessions losing nearly 23% in the last five sessions.
At the time of writing, Dash price was hovering near a critical zone which if breached more worse in the price may be experienced. Whereas, if the price bounces off, it may head for a recovery.
Open Interest Contracts Drops By Over 30%
Dash price is on a five day losing streak after the price slipped below the short term EMA of 20 and 50 days. Dash cryptocurrency is an open-source blockchain focused on offering a fast, cheap global payments network that is decentralized in nature.
Moreover, In tandem with the price decline, there has been a significant drop in the open interest contracts as per the app.santiment.net. On analysis, it was observed that the OI data has dropped from $7.7 Million to $5.1 Million in the last five intraday sessions.
The OI data has dropped by over 30% in the recent session highlights a long unwinding among the short term traders and investors. Furthermore, the transaction volume has grown by 94.3% to $59.34 Million a day. It ranks 148th with a live market capitalization of $263.37 Million.
Dash Price At The Risk Of Falling TO A Multi Year Low.
The daily chart highlights Dash price at a risk of falling to a multi year low. At the time of writing, DASH was hovering close to $21.9 recording a swift intraday loss of 1.6%.
On the lower side, the $20 level may act as a critical and psychological support which the bulls need to defend in order to keep the turn in their favor. The EMA analysis shows that the price lags 200 day EMA by 25% suggesting the domination of the bears over the trend.
Now, if the price breaks below the $20 level it may slump towards the next major support of $15 level. At present time, the MACD line was placed below the zero line suggesting a bearish trend prevailing.
The broader crypto market crashed due to recession fears. Bitcoin and Ethereum lost over 9% and 12% respectively triggering fear in the market. Dash crypto crashed nearly 23% in the last five days. A 30% drop in the Open interest data reflects long unwinding among the speculators.
Additionally, the trading volume is high but price is at risk of falling to a multi-year low. Bulls need to defend $20 support level, otherwise price may fall to $15.

zkSync Price Analysis: Can ZK Reclaim All Time High This Month? zkSync Price Analysis: Can ZK Reclaim All Time High This Month?
As per the analysts, zkSync has reclaimed the bullish territory and is poised to Show Gains Further.
The transaction volume has surged by 35.98% indicating a heightened demand in ZK price.
zkSync price is on a three day gaining streak and has reclaimed the bullish territory. The bulls made a strong comeback from the lower levels as the price made an impressive run of nearly 21% a week.
Earlier, ZK price noted a sharp rejection from the record highs of $0.309 and slumped shifting short term trend towards bearish side. The weakness in the broader market added more to worse and thus falling towards a record low of $0.131.
However, The bulls made a strong comeback amid the broader market recovery in the last couple of weeks. The price surged nearly 30% and entered positive territory above $0.187. Now, what's next for zkSync, will it continue to rise or suffer from the CMP.
zkSync Still 37% Lower From ATH
Despite gaining over 30% in the last couple of weeks, zkSync price still lies nearly 37% below it's All time high. At the time of writing, ZK price was hovering close to $0.197 recording a positive development of nearly 3.7% a day.
Moreover, the recent sessions have noted a rise in demand that could keep fueling the price to keep soaring higher. The transaction volume has surged by 35.98% as per the coinmarketcap.com.
The daily transaction volume has surged to $173.9 Million a day indicating a heightened demand. Additionally, the volume to market cap ratio was 24.03% suggesting a high volatility.
zkSync is a Layer-2 protocol designed to enhance Ethereum's scalability using advanced zero-knowledge (ZK) technology. Apart from boosting Ethereum's throughput, It aims to uphold core principles of freedom, self-sovereignty, and decentralization at scale.
Can zkSync Continue to Soar Higher or Decline Again?
The last couple of weeks saw a strong recovery reaffirming the confidence of the investors. The price surged nearly 30% from $0.14 to $0.18 and claimed a positive territory.
The increased transaction volume and volatility points to a bullish continuation in the short term. As per the analysts, ZK price may keep forming a higher low pattern on the charts and may reclaim All time high of $0.30 level.
The price lies above the 20 day EMA indicating a positive outlook ahead. Also, the RSI at 58.4 and above the SMA line at 44.5 highlights a positive trend prevailing. Additionally a bullish divergence was observed on the charts adding validation to a trend continuation.
Can zkSync Reclaim ATH?
zkSync price has surged over the past three days, reclaiming bullish territory with a 21% weekly gain. After a sharp drop from its high of $0.309, the recent demand has driven the price up by 30% to $0.18. Additionally, the transaction volume increased by 35.98%, reaching $173.9 million daily, indicating strong demand.
Furthermore, Analysts suggest a bullish continuation, with the price potentially reaching its all-time high of $0.30. The price is above the 20-day EMA, and RSI at 58.4 supports a positive trend, with bullish divergence observed on the charts.

Justin Sun Reveals Gas-Free Stablecoin Transfers on TRON NetworkTRON founder Justin Sun announced that his team is developing a stablecoin solution to increase institutional adoption of such assets.
On July 6, Sun revealed that a gas-free stablecoin solution will launch on the TRON network in the fourth quarter of this year.
Gas-Free Stablecoin Solution
Sun explained that this innovation means users will not need to pay a gas fee for stablecoin transactions. Instead, the stablecoins will cover the fees themselves. This solution will initially be available on the TRON Network before expanding to Ethereum and other Ethereum Virtual Machine (EVM)-compatible public chains.

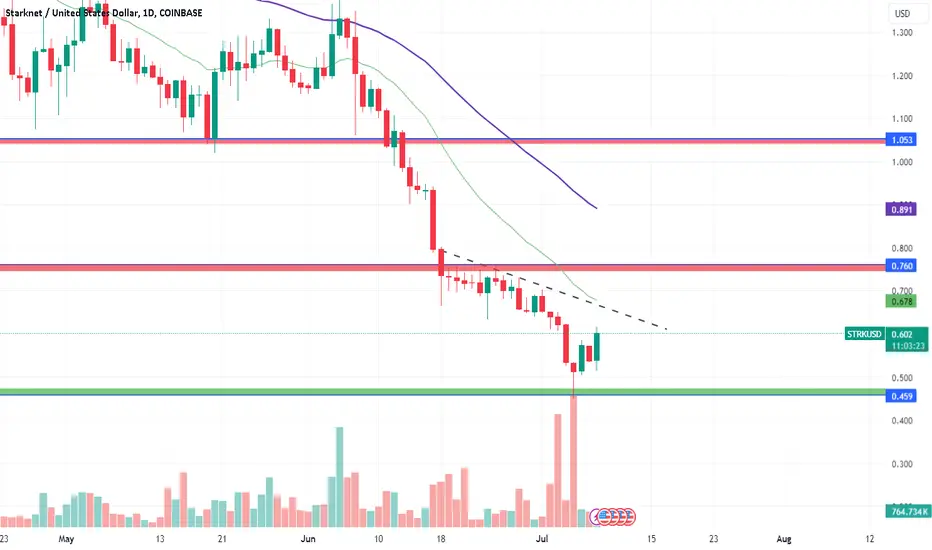
Community Event & Token Unlocks: A Prelude to Starknet Price RalCommunity Event & Token Unlocks: A Prelude to Starknet Price Rally
Starknet announced a community conference scheduled for 10th July in Belgium.
Starknet price has showcased signs of recovery ahead of community conference and has surged by over 13.06%.
On July 15th over 63.9 Million STRK token unlock is scheduled for the investors and early contributors.
The Starknet ecosystem is all set for a community gathering scheduled for July 10th in Belgium. The Starknet crypto has showcased signs of a strong comeback ahead of the community gathering thus rejoicing the Investors.
At the time of writing, Starknet price was up over 13.06% and was exchanging hands close to $0.611. Apart from the community gathering which aims to bring together industry leaders, developers and other users, another token unlock event is also scheduled for this week.
Over 63.9 Million token unlock is scheduled for the investors and early contributors. The token unlock event is scheduled by the end of this week probably on 15th July.
Starknet Community Conference Key Highlights.
StarknetCC is poised to illuminate the path forward for Ethereum's scalability, leveraging the innovative Starknet technology. Moreover, the event, taking place at The EGG Brussels in Belgium, will feature an impressive lineup of over 40 panels, seminars, and hands-on workshops. The organizers anticipate a robust turnout of around 450 attendees.
The conference's agenda is thoughtfully curated to cater to both newcomers and experienced developers in the Cairo programming language. It's an opportunity for attendees to forge valuable connections, engage in thought-provoking discussions, and gain insights through interactive sessions.
Delving into the multifaceted Starknet ecosystem, StarknetCC offers participants a deep dive into the network's offerings and its transformative potential for Ethereum's scalability challenges. To top off a day filled with learning and networking, the event will conclude with a celebratory gathering, marking the culmination of a day dedicated to innovation and community spirit.
Over $63.9 Million Token Unlocks Scheduled This Week!
Starknet, which unlocked 63.9 million tokens in May and 63.9 million tokens in June, will release another batch of tokens in July. The project will release 63.9 million STRK tokens worth $38.34 million on 15th July.
Of the total allocations, nearly 30.43 Million STRK worth of $18.07 are allocated for the Investors and 33.5 million tokens worth of $19.93 million are allocated for early contributors.
Starknet Price Rebounds From The Bottom
This Week might emerge as a turnaround phase for Starknet with various events scheduled linearly. While the price has taken a rebound from the bottom amid the enthusiasm of the event scheduled, the broader market recovery has also helped regain Investors trust and amplified the intraday rise.
Despite the intraday recovery the technical indicators stance have not changed much except RSI. At the time of writing, the RSI line and the 14 day SMA line seemed to be returning back after entering into an oversold region.
Starknet cryptocurrency has a long way to recover as the price still hovers at a monthly loss of nearly 50%. The bulls require a continuous effort to recover and shift STRK price to a bullish territory.
On the higher side, the key 20 and 50 day Exponential moving averages have been acting as dynamic resistance and may act as a hurdle for the price to rise further.
Despite the Intraday rise, the trend outlook reveals a bearish trend prevailing which may add a risk of potential seller’s comeback near the key EMAs.
Bitcoin Technical Analysis - Bitcoin is currently trading with a very choppy price action.
- Investor's sentiment washout has been done for 2 months where altcoins got nuked and beaten down badly
- What's cooking next, IMO if you are planning to buy every dip that you see then its better that you do not, crypto in terms of Bitcoin and Ethereum has stayed strong but altcoins are making new lows every day so I prefer adding Bitcoin Solana Ethereum instead of alts
- I am going to keep my eyes on 55,000-56,000$ for Bitcoin it might revisit that
- Don't forget aggressive short sellers are going to open more aggressive shorts that might lead to another round of shorts liquidation up to 68,000$

Short Lived Surge for Blast Crypto: A Prelude to Another Price WShort Lived Surge for Blast Crypto: A Prelude to Another Price Wave?
Blast crypto is an Ethereum layer 2 (L2) with native yield for ETH and stablecoins.
Blast crypto gained traction soon after dipping lower and surged an impressive 40% from record lows today.
Blast crypto seemed to be retreating after rising to a record high of $0.029. The bulls. Blast crypto has been volatile since its inception yesterday at price $0.022. The crypto loomed nearly 20% lower yesterday and then surged back nearly 43% higher from the record low of $0.0186 in intraday to record high in intraday today.
Blast stands out as the Ethereum Layer 2 (L2) solution offering native yields on both ETH and stablecoins. Moreover, This yield is generated through ETH staking and Real-World Asset (RWA) protocols, which seamlessly distribute the earnings back to the users.
Unlike other L2 solutions that typically offer a 0% default interest rate, Blast provides a competitive 3.4% yield for ETH and an impressive 8% for stablecoins. Moreover, Blast empowers developers with innovative tools such as built-in yield generation and gas revenue sharing, setting a new standard for L2 platforms.
Blast Crypto Volume Analysis
At the time of writing, Blast crypto was up over 8.5% intraday with a massive growth in the volume inflow in Intraday. The transaction volume has surged by 85.98% a day to $592.44 Million a day.
Moreover, the volume to market cap ratio at 158.19 suggests very high volatility in the crypto. It has a live market capitalization of $400.26 ranking at 145th among all the cryptocurrencies.
Out of a total 100 Billion BLAST tokens as the total supply, only 17% of it i.e. only 17 Billion tokens are currently under circulation.
Can Blast Crypto Break Past Its ATH?
From a price point of view, Blast crypto retreated after rising to a record high. The hourly chart illustrates that the crypto has been in a consolidation zone with $0.0248 as the resistance and $0.0227 as the support.
On the higher side, any break above the resistance may indicate the completion of a pullback and the price may rally towards the record highs of $0.029 level. However, if the crypto slumps below the $0.0227, it may indicate a bearish continuation and the price may retrace its All time low value.
The RSI line and SMA line currently lies above the mean lines adding a bullish confirmation. investors need to watch closely as to which side the consolidation breaks.
What’s Next for Blast?
Blast crypto seemed to be consolidating with significant volatility in Intraday. The price has been volatile with 20% dip after inception and then a rebound of 43% from a low of $0.0186. At the time of writing, the crypto was exchanging hands close to $0.0238 with a positive development of nearly 8%.
With a market cap of $400.26 million, it ranks 145th and only 17 billion of the 100 billion total BLAST tokens are in circulation. Currently, the crypto has been in a consolidation with resistance at $0.0248 and support at $0.0227. A break above could signal a rally, while falling below may lead to record lows. The technical indicators RSI and SMA trends suggest a bullish outlook ahead.

Near Protocol Gains Strength: Is A Bullish Reversal On The HorizNear Protocol Gains Strength: Is A Bullish Reversal On The Horizon?
NEAR reclaimed the top spot in the number of users among blockchains, boasting around 16.3M addresses in the last month.
NEAR Protocol price surged nearly 15% in the recent sessions and reclaimed back the bullish territory above the 20 day EMA.
NEAR protocol price gained traction and reclaimed back bullish territory above the 200 day Exponential moving average. The bulls awoke after the price crashed near the annual low and initiated a recovery.
The broader market seemed to be still under pressure as Bitcoin and Ethereum were down nearly 1% in intraday today. The selling pressure in market leaders has also dragged the NEAR Protocol price lower by nearly 3% in intraday today.
Moreover, the NEAR Protocol has reported an impressive rise in the number of users which might have factored the price recovery. Let's analyze combining all the available resources to reach a conclusion about where NEAR price could lead in the upcoming sessions.
NEAR Protocol Reclaims Top Spot In The Number Of Active Users!
A recent tweet by Planeta which reveals the number of users among the different blockchains. The tweet mentioned that the NEAR protocol reclaimed the top spot in the number of active addresses in thee last month.
As per the tweet, the NEAR Protocol boasts at 16.3 Million addresses, beating other popular chains like Solana which had 14.6 Million active addresses and Polygon having 9.7 Million Active Addresses. Arbitrum claimed the fourth spot with 9.57 Million active addresses whereas Ethereum remained at 5th with 6.99 Million active addresses in the last month.
Active addresses are a key metric, reflecting the count of users engaging in transactions within a timeframe. A greater number of active addresses suggests enhanced liquidity and attractiveness to investors, indicating a vibrant and engaged network.
What's next For NEAR Protocol: Can It Recover Or Slump Again?
Now, that some positive news is driving the NEAR Protocol price higher, on the other hand the weakness in the broader market is dragging the price down again lower in intraday. Currently, the price hovers at a critical zone that lacks a clear direction.
Now, if the bulls dominate and defend the price above the previous day's low, then the price may show a bullish continuation. On the flip side, if the sellers dominate and drag the price below the 50% of the recent recovery, it may indicate a bearish continuation.
At the time of writing, the RSI line and the 14 day SMA showcases a bullish crossover indicating the possibility of a bullish scenario ahead. However the RSI and 14 day SMA line needs to surpass the mean line to turn bullish in the short term.
Conclusion.
NEAR Protocol price has recently surged, moving above the 200-day EMA, signaling a bullish trend after a dip to yearly lows. Despite a general market downturn, NEAR's active user base has grown to 16.3 million, the highest among other blockchains, which has contributed to its price recovery.
Currently, The price hovers at a pivotal point. Now, if the price is maintained above the previous day low value, a bullish trend may continue. Conversely, a drop below 50% of the recovery suggests a bearish trend. The RSI and 14-day SMA indicate a potential bullish outlook, but they must cross the mean line for confirmation.
Disclaimer
The views and opinions stated by the author, or any people named in this article, are for informational purposes only and do not establish financial, investment, or other advice. Investing in or trading crypto or stock comes with a risk of financial loss.
Keyword: Near Protocol
Meta Description: NEAR Protocol price surged nearly 15% in the recent sessions and reclaimed back the bullish territory.

Starknet (STRK)Starknet (STRK)
StarkNet (STRK) is a decentralized ZK-Rollup. It operates on Ethereum as an L2 network, offering dApps the ability to scale computations infinitely while maintaining Ethereum's security and composability, thanks to its reliance on the robust STARK cryptographic proof system.
Starknet crypto has been on a constant decline since April. The long term trend outlook has shifted to a bearish side below the key EMAs of 50 and 200 days. The bears are in complete domination and the price might continue to slump more in the upcoming sessions.
Moreover, for a bullish reversal, the STRK crypto needs to surpass the $1 level and sustain above it. At the time of writing, the Starknet Crypto was exchanging hands close to $0.72 recording a swift intraday rise of 0.70%. It ranks 73rd in the overall crypto market with a live market capitalization of $941.47 Million.

Injective (INJ)Injective (INJ)
Injective Protocol stands out by offering robust foundational financial primitives that applications can utilize. It includes an on-chain order book that is fully decentralized and resistant to Miner Extractable Value (MEV). Moreover, it supports a comprehensive range of financial markets spot trading, perpetual contracts, futures, and options all operating entirely on-chain.
The protocol's decentralized bridging infrastructure facilitates cross-chain interactions, ensuring compatibility with Ethereum, blockchains enabled by the Inter-Blockchain Communication (IBC) protocol, and even non-Ethereum Virtual Machine (EVM) chains like Solana. It makes Injective a versatile platform for various financial transactions in the blockchain space.
Injective claims the third largest AI cryptocurrency with a live market capitalization of $2.48 Billion ranking at 40th among all. Despite being down nearly 47.62% from it's All time high of $52.75, injective has bagged 349% return over the last 1 year.
At the time of writing, the crypto was trading close to $26.59 recording a 7.68% drop in intraday. Out of a 100 million total supply, 93.40 Million INJ tokens are currently in circulation.

Will It open the doors to new all-time high pricesAs of press time, Ethereum has traded at $3,812.6 with a market cap of $457.62 Billion. Ethereum’s price is approaching high-time-frame resistance at $4050, and surpassing would lead it toward $4700. after passing the all-time high of $4700, which was built in November 2021, could open the doors to new all-time high prices.
On the contrary, situation, if the price faces resistance from the nearest resistance, then the price could test the support levels at $3240.0, and $2850.0.

breakout rallies stronglyThe Ethereum price has displayed remarkable fluctuations, initially favoring bulls but shifting to bears. However, recent developments highlight a shift back to bullish sentiment, with a 1.00% rise in price and positive growth in 24-hours trading volume with a 32.59% optimism.
An analyst, Redblack officials, Tweeted with the bullish sentiment on X platform, that a breakout has taken place out of a falling wedge pattern on the daily chart.
Similarly, based on the analyst tweet, the ETH asset daily chart shows that it has been increasing from support and it remains above the 200-day EMAs, which portrays bullish strength in the long term.
Likewise, the MACD portrays a bullish cross, with a rising histogram in ETH at -27.0, and the RSI flashed at 51.48. It portrayed that the crypto is not a losing steam yet and could continue to climb higher in future sessions.
Therefore, if the breakout rallies strongly, then the next goal for the ETH price could be to reach the levels above, such as $3355.0 and $3725.0.
On the contrary, the tweet also stated that if the price plunges and trades inside the pattern again, the bullish pattern would lose its significance and would be invalid.
Likewise, in this scenario, if the Ethereum crypto price fails to stay above the $2855.0 level, it could decline further,as well.

Divergence In Quant Price and OI data: Is A Reversal On the HoriDivergence In Quant Price and OI data: Is A Reversal On the Horizon?
The rising Open Interest figures suggest a disparity with the current price trend, hinting at an impending market upturn.
The Quant price may bottom out if the bulls are able to reclaim the $100 level and sustain above it.
The broader crypto market is on an upward trajectory intraday, attempting to offset recent declines. Leading the charge, Bitcoin has risen by 2.35%, while Ethereum has also seen a 1.65% increase compared to its previous day's close.
In tandem with these market giants, the altcoin Quant is making similar progress, having risen by approximately 1.92% at the time of writing. Moreover, a noticeable divergence between open interest data and price points to a potential trend reversal in the crypto sphere.
Let's explore more using the metrics and try to find insights into potential price movements in upcoming trading sessions.
Open Interest data and Price is showing a divergence!
According to information from the financial analytics platform app.santiment.net, a noticeable divergence has emerged between the price of Quant and the aggregate value of open contracts denominated in USD. Specifically, since May 5th, there has been a consistent uptrend in Open Interest data.
Conversely, during the same timeframe, the price of QNT has been on a decline, further accentuating the divergence. This increase in Open Interest suggests that major players may be positioning themselves in anticipation of a price reversal, despite the ongoing price decline.
The uptick in Open Interest could signal an upcoming reversal for QNT. Nevertheless, investors should look for confirmation in both price and trading volume before drawing conclusions.
Could Quant Crypto Bottom Out If the Market Recovers.
Quant's price trajectory has been on a downward trend, facing significant resistance around the $110 mark before falling below the key $100 level.
Currently, the price hovers around $90, aligning with its prior low point. Now, If the bulls manage to uphold this level and the $90 mark, it could potentially lead to the formation of a double bottom pattern.
Furthermore, A successful ascent above the $110 neckline might then signal a reversal in Quant's price direction. This scenario, however, hinges on a broader market revival.
Conversely, should the decline persist, Quant could descend to new multi-month lows, perpetuating the current bearish momentum.
Conclusion.
The crypto market is rebounding, with Bitcoin and Ethereum posting intraday gains. Quant's price has also surged by 1.92%, despite a divergence between rising Open Interest and falling prices since May 5th, hinting at a potential reversal.
As of Now, Investors should seek confirmation in price and volume. Quant faces a critical juncture: if it maintains the $90 level, a double bottom pattern could indicate a trend reversal, contingent on broader market recovery. Otherwise, the downtrend may continue, leading to new lows for Quant.

#ETH/USDT Bulls in Control#ETH/USDT pair has recently formed a double bottom pattern, finding significant support within a crucial trend box area. This pattern suggests a potential reversal of the previous downtrend and signifies a bullish sentiment in the market. With the double bottom formation in place, Ethereum is likely to experience upward momentum, aiming to retest the $3000 resistance level. Traders and investors are closely monitoring this development, anticipating a continuation of the bullish trend as Ethereum moves towards challenging key resistance levels. This pattern highlights a shift in market sentiment, with buyers gaining confidence and driving the price higher in anticipation of further gains.

Areweave Nears Multi Month Peaks: Is Market Confidence Restoring
Arweave crypto registered a growth of nearly 12% a month despite the broader market correction.
In recent sessions, there has been a significant increase in social volume, reflecting a rise in user activity.
The broader crypto market has been full of fears in the last month, with most major cryptocurrencies experiencing a steep decline from their recent peaks. Market giants Bitcoin and Ethereum experienced a loss of nearly 18% in value during this period.
While other cryptocurrencies are seeking solid footing, Arweave crypto is on an upward trajectory, aiming to surpass its multi-month highs. In the last month, it has shown remarkable growth. Despite the prevailing market trepidation and downturn, the cryptocurrency has yielded returns exceeding 12% for its investors.
Let's take a closer look and explore the reasons why this cryptocurrency might continue to surpass market frontrunners like Bitcoin and Ethereum in the current month as well.
AR Crypto: The Daily Chart Says It All
Arweave cryptocurrency has exhibited a bullish trend within the broader market, consistently achieving higher peaks and troughs. Despite the ongoing market correction, the cryptocurrency has succeeded in delivering positive returns to its investors. The bullish sentiment was strong, with investors aiming to reach and surpass the multi-month high of the $43.5 mark.
The daily chart indicates that Arweave was not immune to the market-wide downturn that began in April. Yet, in contrast to the leading cryptocurrencies, Arweave managed to rebound from its mid-month losses and was able to extract positive returns for its investors.
Social Enthusiasm on the rise
As per the data obtained from the app.santiment.net website, there's been a notable increase in the social sentiment curve. This indicates that Arweave (AR) cryptocurrency is gaining considerable traction across social media platforms such as Twitter, Telegram, and more. The heightened community sentiment has played a role in the cryptocurrency's growth.
The social sentiment metrics, including social volume and social dominance, gauge the extent of discussion, valuation, and demand for the cryptocurrency within the community. An uptick in social engagement often correlates with an increase in the cryptocurrency's value.
Arweave Crypto Price Forecast.
On a closer look, Arweave crypto appears to be trading within an ascending parallel channel, adhering to its lower and upper limits for support and resistance, respectively. Currently, the price is near the channel's upper edge, suggesting potential for a downward adjustment in value.
On the upside, the $43.5 mark could pose a challenge for the bullish trend, but overcoming this barrier might propel the price rapidly toward the $50 threshold. Conversely, should a price correction occur, it's likely to retreat to the channel's lower edge to find support.
Conclusion.
Arweave crypto is defying the broader market's downturn, climbing towards multi-month highs with a 12% return for investors last month. The crypto has been riding a bullish wave, forming higher highs and lows, and is now eyeing the $43.5 resistance level.
Moreover, Social sentiment is on the rise, reflecting increased attention on platforms like Twitter and Telegram. Trading in an ascending channel, Arweave's price is close to the upper boundary, hinting at a possible correction. If it breaks the $43.5 resistance, it could surge towards $50; otherwise, it may seek support at the channel's lower boundary.

Shiba Is Ready Again?? We Can Try Shiba Inu Coin (SHIB): The Dog-Themed Crypto with Bite
Fundamentals:
Launched in August 2020, Shiba Inu (SHIB) is a decentralized meme token built on the Ethereum blockchain.
Inspired by Dogecoin, another memecoin featuring a Shiba Inu dog, SHIB aspires to be an Ethereum-based alternative.
Unlike scarce cryptocurrencies like Bitcoin, SHIB boasts a vast supply (one quadrillion tokens!).
The Shiba Inu ecosystem includes three tokens (SHIB, Leash, and Bone) used within ShibaSwap, a decentralized exchange for crypto trading.
Recent News (as of March 17, 2024):
SHIB is up 17.09% in the last 24 hours, reflecting a positive trend.
Shiba Inu's growing popularity is leading to its acceptance as a payment method at a surprising number of stores, often through third-party processors.
Disclaimer:
Investing in cryptocurrency involves inherent risks. SHIB's price can be volatile, and the future of memecoins is uncertain. Consider this information for informational purposes only, and never make investment decisions based solely on online content. Conduct your own research before investing in any cryptocurrency.

$ETH Season Alert!CRYPTOCAP:ETH Season Alert!
ETHBTC chart show a bottom formation and breakout, hinting at a possible uptrend, aligning with the upcoming #Ethereum season. This suggests a possible increase in the price of Ethereum, possibly reaching $3,000 soon.
Given the recent approval of a Bitcoin ETF, there is speculation regarding the possibility of an ETH ETF being the next in line for approval.

Are you Bullish on Polygon (MATIC)?Polygon BINANCE:MATICUSDT is a layer-2 scaling solution for the Ethereum blockchain. It is designed to improve the scalability, security, and transaction fees of the Ethereum blockchain. Polygon has a number of strong fundamentals, including a large and growing community, a strong team of developers, and a number of partnerships with major companies in the blockchain space.
Community Ad Volume
Polygon (MATIC) has a high level of community ad volume, which suggests that there is a lot of interest in the project. This is a positive sign, as it indicates that the project is likely to continue to grow in the future.
Price Action
Polygon (MATIC) is currently trading at $0.7532, up 1.47% in the last 24 hours. The price has been trending upwards since October 1st, and it has made a series of higher highs and higher lows. This suggests that the bulls are in control of the market, and that the price is likely to continue to move higher in the short term.
Order Flow and Order Block
There is a strong support level at $0.72, which has been tested multiple times in the past. This suggests that there is a lot of buy orders at this level, and that the price is unlikely to fall below it in the short term. There is also a minor resistance level at $0.80, which has been tested multiple times in the past. It is likely to break this level sooner
Pivot and Patterns
There is a pivot point at $0.74, which is the average of the high, low, and close of the previous trading day. This is a key support level, and the price is likely to bounce off of it if it falls below it. There is also a rising trendline at $0.70, which has been in place since October 1st. This trendline is likely to continue to support the price as it moves higher.
MATIC is forming a Cup and Handle Pattern which indicates a breakout with a potential to break immediate resistances and hit $1 sooner.

Is ETH the New Crypto King? - Bitcoin's Market Dominance DipsBitcoin's market dominance which reached its peak at 54.3% before dipping to 52.7%, suggests that traders are embracing additional risk by exploring Ethereum (ETH) and other altcoins. Furthermore, trading volume has diversified, with Bitcoin trading at up to three times the volume of ETH in mid-October, but that ratio has now reduced to just double the volume.
Additionally, the perpetual futures funding rate for both Bitcoin and Ethereum is trading at elevated levels, indicating growing interest in undervalued altcoins.
The breakout above the 1,740 level is a strong signal, providing a trading opportunity for those looking to take a long position in ETH.

GTCUSDT long opportunity bullish flagAfter a period of consolidation, GTCUSDT is showing signs of a potential bullish breakout. The cryptocurrency has formed a strong support level around the $2.20-2.30 mark, and the price has been consolidating within a narrowing range over the past few weeks.After a period of consolidation, GTCUSDT is showing signs of a potential bullish breakout. The cryptocurrency has formed a strong support level around the $2.20-2.30 mark, and the price has been consolidating within a narrowing range over the past few weeks.
However, there are several bullish indicators that suggest a potential upward move in the coming days. The MACD indicator has been trending upwards, and the RSI is currently in oversold territory, indicating a potential reversal. Additionally, the recent dip in price has created a divergence between the price and the OBV indicator, which could signal an accumulation of buying pressure.
Furthermore, the overall market sentiment towards cryptocurrencies has been positive, and Bitcoin and Ethereum are both trading near all-time highs. This could lead to increased demand for altcoins such as GTC , especially considering the recent bullish news surrounding the project.
Therefore, I believe that GTCUSDT presents a good long opportunity with a potential price target of $3.00-3.30. However, as always, it's important to keep an eye on risk management and to adjust your position accordingly based on market conditions.
Disclaimer: This is not financial advice, and I am not a financial advisor. Always do your own research and make your own investment decisions. Trading cryptocurrencies involves risk and may not be suitable for all investors.

🇮 30 Trade Ideas Prove The Future Can Be Predicted | BTC RallyQuestion: Is it possible to predict the future?
Answer: The answer is a big and resounding YES! if you know how to read charts.
Let's get started!
Feel free to boost 🚀👍 at the end if you enjoy the content.
----
On the 21st of November 2022 bitcoin hit a new low.
Based on the length and strength of the bear-market, recent price action and simply experience with reading cryptocurrency charts, I became convinced that bitcoin was about to move up.
If not a full-blown recovery, a "relief rally in the least".
I made this clear by sharing a full trade signal even with leverage just two days later.
(1) 23-Nov-2022 🅱️ Bitcoin Goes Bullish (Easy 333%+ Potential 10X Lev.)
With this trade active and in place, the bearish bias was still too strong and we considered a "flash crash" scenario that did not materialize... Bitcoin went on and started a consolidation phase.
Early December, I was ready to call for $21,650 followed by $26,420...
The deal was simple, it is going up but by how much?
(2) 1-Dec-2022 🅱️ Bitcoin $21,650 Followed by $26,420 vs Altcoins BTC Pairings
Then comes the first signal, the MA200 indicator on the weekly timeframe.
My thinking was simple, this is a long-term support that has failed, it needs to be tested as resistance before bitcoin can go any lower.
If it fails as resistance then we just keep going up, if it holds, then a new low can be set...
(3) 4-Dec-2022 🅱️ Bitcoin Weekly | MA Analysis Points To $24,000 and $27,000+
Just the next day the next signal is found... The SPX and BTC detach, when you hit play now the target/resistance level is hit with perfect accuracy...
(4) 5-Dec-2022 🅱️ Bitcoin and the SPX Detach 5-Nov. (Good News)
Another signal, this time a bull flag... I am convinced, up we go, up we go but nothing yet takes place...
(5) 8-De-2022 🅱️ Bitcoin Daily Bull Flag | $21,000+ Possible Now Within Days!
Going back a little bit, one day earlier, I make the case the bitcoin bottom is already in... The whole argument was based on the capitulation phase we were expecting since early 2022 and the fact that after it happened we only needed to confirm if the next move would be a higher low or lower low before the cycle ends.
I also compared 2018 to 2022... below, the chart...
(6) 7-Dec-2022 🅱️ The Bitcoin Bottom Is In (No Click-Bait Tile, Read)
Then the FED and inflation, here I looked at 3 different potential scenarios and the only prediction was a recovery after 14-Dec. and ended with "Bitcoin, we start GREEN in 2023
(7) 10-Dec-2022 🅱️ Bitcoin 2023 | Fed Interest Rate Hikes & The Consumer Price Index
By mid-December I was ready again with making bold predictions and I even shared a strategy with step by step instructions on how to get the most of the bullish wave that is happening now... A month ago.
No genius level on this strategy, it simply said "Buy everything always at all times until early January and then enjoy the ride on the way up".
It also mention to keep an eye on the chart to consider selling in early February if the major correction takes place.
(8) 15-Dec-2022 🅱️ LONG bitcoin Feb. until 2023 - PART II | Strategy
The same day I found that the major downtrend has been broken based on the linear scale BTCUSD weekly.
I wrote "The easy target is set at the $20,000 - $21,000 range in the coming weeks."
Also added: "There can be more, bitcoin can hit $24,000 and even $27,000..."
(9) 🅱️ Bitcoin Breaks Free - Major Nov. 2021 Downtrend | Linear Scale
Of course, at the same time I am writing about Ethereum, Ethereum Classic, Bitcoin Cash, Cardano, Dogecoin, Binance Coin and the rest of the pack.
The next day I read some facts in a book and decided to share them with you, "Buy the dip"... Only around 400,000BTC will be minned in 2023 and it goes down every year.
Less than 250,000 in 2024, 165,000 in 2025, etc.
(10) 16-Dec-2022 🅱️ BUY THE DIP! Less Than 400K bitcoins will be Mined in 2023
Another "bottom signal" the next day... This is getting old, I even shared a chart from 17-Nov-2022 mentioning that Bitcoin would recovery within 1-5 months...
(11) 17-Dec-2022 🅱️ Bitcoin Performance In January Since 2012 + Bottom Signal
Doubt can creep in at times.
When you are writing on a daily basis and interacting with hundreds of bears, you can become infested... But I am an astrology fan and this would always help me clear the doubts.
Yes, anything is possible as they say but Jupiter is moving forward and other planets that have been retrograde for months are also moving ahead, bitcoin is bound to follow.
The next day I asked... Do you believe in miracles?
(12) 18-Dec-2022 🅱️ 🪐 Bitcoins Connection To The Stars, Do You Believe In Miracles?
The next signal is the classic bullish divergence... In this case, the target was hit with perfect accuracy, only now this can be appreciated when you hit "PLAY" on the chart...
(13) 20-Dec-2022 🅱️ ₿ Bitcoin Daily Bullish Divergence (85% Jump Mapped!)
At the same time I am reading the Tesla (TSLA) charts with perfect accuracy, drop after drop and later called the reversal that is now taking place.
Now comes "Bitcoin sideways" and it reads like this...
"We can see/have a sideways bitcoin until mid-January 2023 or 12-January.
"At this point we can see the bulls win the game... But why?
"Because Mars moves forward/goes direct! 😅🤣 "
I use the emoji so the trolls and bears won't kill me for using all available tools to help me predict the future. The charts + astrology. They don't believe in astrology so they think it is unreal... Yet bitcoin breaks perfectly and produces the biggest jump 12-13 January, exactly when Mars stations direct after almost 3 months of retrograde. And exactly as predicted.
(14) 21-Dec-2022 🅱️ (₿) Bitcoin Sideways | You Deserve To Succeed!
Late December I am convinced the "Wait Is Over" but I am accused of "sensationalism"... Wait what? What the heck is that? To me I am just sharing my honest view, what I see coming, my analysis, what the charts are saying, my predictions.
Relief rally or full recovery? We don't know yet.
(15) 29-Dec-2022 🅱️ (₿) Finally... The Wait Is Over | Bitcoin Goes Bullish!
2023 starts and we look at all the signals, higher lows, EMAS, candlestick patterns and the rest... Predict a $20,960 target "next".
(16) 1-Jan-2023 🅱️ (₿) Bitcoin 2023 | Multiple Higher Lows Since 2022 | $20,960 Target
The same day, another signal, this time we look at the long accumulation phase, a clear give away to me... Can you see it?
(17) 1-Jan-2023 🅱️ (₿) 4.5 Months Later Bitcoin...
We are getting closer now... My certainty continues to rise... I can feel the hate pouring over me.
The bears are fighting me left and right but I never give up.
Another scenario, the SEC labeling everything securities yet, still 100% bitcoin bullish. I also remind you of the strategy to buy everything, always, at all times...
(18) 4-Jan-2023 🅱️ (₿) Why Bitcoin Will Rise Suddenly Beyond $150,000 Explained
(19) 4-Jan-2023 🅱️ (₿) Remember The Act Now! Strategy
At the same time I am sharing short-term charts on the XBT ticker; Also bullish.
I was laughing inside as I received the vision for this article... I was making excuses for bitcoin not yet rising... Imagine that, I blamed the holidays.
(20) 5-Jan-2023 🅱️ (₿) Excuse The Holidays... The World Wants Bitcoin
The next day I ate some cookies and my heart started raising... I was feeling so good yet decided to eat the damn cookies... As I lost my balance, a vision started to come in... Ahhh, I recognize this, it is a ROTE, a ball of thought packed in energy form.
I am inspired to write the following article word by word... Satire, maybe, but 100% TRUE!
Note: The fact I mention the formalities to be "nonsense", is because we are supposed to be greedy billionaires that care about nothing but money... Don't take it to mean we are heartless yet we still don't care about nobody.
Life is an endless game. You die and you are born again, over and over... You cannot stop it even if you wanted to, you can take it easy.
.. Relax, it is all meant to be fun.
(21) 6-Jan-2023 🅱️ Billionaire Planet Friend Just Called, Ready To Buy Bitcoin!
The next day I go on a rant... "Really, are you guys going to believe the mainstream media?"
And also share my updated view of the market, a potential $48,000 wave in the making...
(22) 7-Jan-2023 🅱️ (₿) Money Tightening vs Money Easing | Nothing Else Possible
(22) 7-Jan-2023 🅱️ ₿ If 2018/19 Repeats, The Bitcoin Bottom Is In, $48K Next!
A new signal comes in... This time based on the ATH vs the Bottom, is it possible?
Again we make hidden references to Mars as being the main catalyst of the upcoming bullish wave which is now a confirmed fact... Uranus hasn't gone forward yet and that's the big one.
(23) 8-Jan-2023 🅱️ (₿) Can This Inverse Reaction Signal The Bottom Is In?
On the 10th of January, now literally 2 days before the rally start I shared 3 trade ideas all bullish detailing exactly what is coming... Daily, Weekly and Monthly... The bears continue in complete disbelief.
(24) 10-Jan-2023 🅱️ (₿) Bitcoin Daily, To Hit $19,000 Followed by $25,000 Feb. 2023
(25) 10-Jan-2023 🅱️ (₿) Bitcoin Weekly, Best Case Scenario... First Time Since April 2020 ($35K to $55K)
(26) 10-Jan-2023 🅱️ (₿) Bitcoin Monthly, Points To $23.1K to $24.1K Minimum...
It is so obvious, I stop writing... Just mention "BULLS Confirmed" and leave it at that... I know my people took action. If you didn't take action then you are not in the flow.
(27) 11-Jan-2023 🅱️ (₿) Bitcoin | BULLS Confirmed
The next day many new signals show up... The bears are in complete disbelief, I even share the USDT.D chart with the inverse BTC relation called "Final Confirmation"... It didn't help.
📈 Tether Dominance, The Final Confirmation
(28) 12-Jan-2023 🅱️ (₿) Another 6 Major Development On The Weekly Bitcoin Chart
13-January 2022... The final signal... MA200 daily and Bitcoin-Bonds!
(29) 🅱️ Bitcoin Moving Above MA200... $48,000 Now Possible!
(30) 🅱️ Game Changer | Bitcoin Bonds | El 🇸🇻 Salvador
Thanks a lot for your continued support.
Namaste.

Bitcoin Uptrend, Will It Continue?🔥Bitcoin’s Recent Surges Resume the Uptrend, Will It Continue?
BTC registered a sudden increase of 4.92% in the past 24 hours
Major altcoins have also attained a significant price increase.
According to CMC , the price of Bitcoin ( BTC ) is $20,226.13 with a 24-hour trading volume of $35,984,764,261 at the time of writing. However, BTC has increased by nearly 4.92% in the last 24 hours. Moreover, Bitcoin has a circulating supply of 19,145,237.00 BTC .
The Sudden Price Surge
During the past week, Bitcoin witnessed a constant up and down in the crypto market. The coin suffered from a significant fall of around $18,702.59. However, BTC again turned to a gearing way with an impressive price surge. At the same time, Bitcoin holds 38.2% dominance in the market. However, Ethereum holds 20.4% dominance.
Along with Bitcoin , the prominent altcoins are showing a green signal in the market. The second largest coin, Ethereum (ETH) is now trading at around $1,705.82 with a 24-hour trading volume of $20,356,191,216. ETH has increased by nearly 4.37% in the last 24 hours, as per CMC .
Moreover, the other leading coins like XRP (4.86%), Cardano (3.63%), Solana (8.63%), Dogecoin (3.47%), and Shiba Inu (2.76%) also attained a sudden rise in the past 24 hours. Broadly, the major coins obtained a steady increase during the past 24 hours.

What 1-hour chart says? Fundamental Development:-
Bitcoin, Ethereum, and Ripple: Bulls and Bears Battle for Control
Ahead of the US Federal Reserve’s FOMC meeting, Bitcoin, Ethereum, and Ripple prices brace for impact. Bitcoin witnessed an increase in sell-side activity and a retracement in its price after a week of gains. Bitcoin’s price is at a make-or-break point — a decisive move in either direction could define the trend for the asset post the FOMC meeting. Traders are currently on the fence; however, this is set to change with the news of an interest rate hike, as predicted by experts. Ahead of an anticipated hike, Bitcoin holders are cautious. The July 13 hike by the Federal Reserve triggered a 5% drop in Bitcoin price, and the asset recovered from the decline nearly instantly. Bitcoin recouped its losses, and a similar reaction is expected from the asset after Wednesday’s meeting. The asset’s run up to $28,000 is threatened by the rate hike.In the case of the second-largest altcoin XRP, the outlook is bullish. Brad Garlinghouse is optimistic that the payment giant will win the lawsuit. A win could fuel a bullish sentiment and push XRP higher in the long term. XRP could climb to $0.38 if the altcoin sustains above support at $0.34.
Short Term Technical View: On monthly chart btcusd is taking support from 17800-19800 level which is major support area now consolidating within a range. On weekly chart trading below 200 simple moving average which indicates that major trend is negative but on short time frame btcusd showing positive strength. Right now it is trading between a channel patterns. After taking resistance from24100-24200 level it declined and now trading near 21100 levels. On daily period, yesterday BTC made low 21555 and high was near $23013 and then it continue to decline. Bitcoin is struggling to gain momentum above $213000.
Alternative Scenario: If Bitcoin fails to clear the $29,800 resistance zone, it could start another decline. An immediate support on the downside is near the $28,000 level.
