ETH Price Prediction - EthereumEthereum ETH Price Prediction 2021
ETH is forming W Pattern and both the possibilities I've shared in my chart
Search in ideas for "Ethereum"

Ethereum Classic Gives Positive Crossover Above $6.00 The technical chart of Ethereum Classic highlights the sharp positive divergence made by the price levels during the past month while reaching the critical resistance and bullish zone around $8.00. The positive momentum is followed by a sharp negative divergence to the major support level of $5.50 which helped the crypto asset to avoid any further price damage. The current price levels attempted for a positive crossover against the 0.786fib level which was unsuccessful as the levels started to face negative reversals. The bulls need to ensure that the negative reversals won’t allow the price levels to have a negative crossover below the 1.0fib level.
The moving average convergence & divergence (MACD) gave a bullish crossover which is supporting the current positive trend but still looking vulnerable for bearish crossover again as an increase in the significance of the red line is noticed on the graph.
The relative strength index (RSI) has also started to show a negative nature after recovering the levels from the oversold region. The current level stands at 44.56
The directional movement index (DMI) is also showcasing weakness in the levels as ADX (17.17) faced a negative crossover against -DI (20.56).

Ethereum And Bitcoin Didn't Continue Moving Together...And we have a bearish Bitcoin meaning...
We also have a bearish Ethereum.
Right now ETHUSD is moving below EMA10 after a strong bearish candle 31-Aug. very similar to BTCUSD.
This weeks candle is still active and the week young... So this chart can easily change.
Confirmation only happens after candle closure; end of the week.
If ETHUSD closes below EMA10 ($352) this week, we will see $260 or lower on the next move.
The 31-Aug. candle has the highest volume since March and is a bearish candle. The action that followed after this candle supports lower prices.
Remember to hit LIKE now for more...
Namaste.

#Ethereum Trading Plan 26-27 Jan 2022In this chart of Ethereum I have marked 4 price levels which have been determined based on a proprietary calculation that I have developed. The zone between the top-most and bottom-most price levels is a strict "No Trade Zone".
If Ethereum's price crosses the top-most price level, we will be looking for long opportunities and if Ethereum's price crosses the bottom-most price level, we will be looking for short opportunities.
Entry criteria:
Bullish case: Enter as soon as a 5-minute candle CLOSES above the top-most price level.
Bearish case: Enter as soon as a 5-minute candle CLOSES below the bottom-most price level.
Stop Loss criteria:
Risk: 2% of capital of per trade.
Bullish case: Just below the second price level from the top.
Bearish case: Just above the second price level from the bottom.
Take profit criteria :
I personally follow a system wherein I do nothing until 1:1 RR is achieved. But post 1:1 RR is achieved, I adjust stop loss to cost. I then exit 1/3rd of entered quantity based on 5 minute candle close below ( bullish case) or above ( bearish case) 15 EMA . I exit 1/3rd of entered quantity at fixed take-profit level of 1:3 RR. And I exit the final 1/3rd of entered quantity based on a system of setting stop losses that are dynamically adjusted to the nearest retracement after a Day High Breakout (in bullish case) or Day Low Breakout (in bearish case).
I have also experimented with systems wherein you can set take-profit at a fixed level of 1:3 RR or alternatively after 1:1 is achieved book full quantity vased on 5 minute candle close below ( bullish case) or above ( bearish case) 15 EMA . Both of these alternative systems have also been profitable.
Please note the given zones are valid only until the end of the day. Any open positions must be closed by 05:25 AM IST which is around when the day is about to end in the cryptocurrency markets.
Also please note: according to the rules of my system, I don't take more than 3 trades per day on any asset.
P.S. I hold a neutral stance today as I am not quite sure about the direction towards which the market is leaning; BTC seems to be close to a major support but also has been showing significant weakness over the past few days. This has implications for Ethereum given the correlation between the prices of the two. But like always - my view does not matter as I trade the price and the system and not expectations.

Ethereum Can Easily Hit $3250 Daily If The Final Upgrade From...What is happening with Ethereum (ETHUSD)?
This chart is looking weak or strong?
Ethereum has been growing massively and this is great news for the entire cryptocurrency markets.
It is great when Bitcoin grows but it is also good to see the Altcoins do great... Feel free to hit LIKE now and let's get to the ETHUSD chart.
Ethereum vs the U.S. Dollar
The resistance is now set at $2750 - $2800; I came here because I saw the potential for a bullish breakout and wanted to let you know.
📊 Above $2800, ETHUSD can make a quick and strong jump to $3250 or more.
Conditions for change
If the bears jump in and the bullish momentum is lost, support can be found first at EMA10 now sitting at $2560, this would be our main daily support.
If this level breaks, we look for $2150 as the next support (EMA50).
Any trading above EMA10 and we are STRONGLY BULLISH ON ETHUSD.
Remember what I shared in my previous analysis... Bitcoin is very likely to follow Ethereum and hit a new All-Time High, soon!
What's your take?
LEAVE A COMMENT!
Namaste.

Ethereum (ETH/USDT) at Critical Support – Breakout or Breakdown?📉 Ethereum (ETH/USDT) 4H Chart Analysis
🔴 Current Price: $3,220.06 (-0.95%)
📊 Indicators & Patterns:
Downtrend Resistance: A descending trendline is acting as resistance.
Support Zone: The red highlighted area (~$3,220) is a key support level.
200 EMA: At $3,320, acting as resistance.
🔮 Possible Scenarios
1️⃣ Bullish Case 🚀: If ETH holds the support and breaks the descending trendline ($3,320), it could test higher levels around $3,400 - $3,500.
2️⃣ Bearish Case 📉: A breakdown below the support ($3,220) could trigger a fall towards $3,100 or even $3,000.
🎯 Key Levels to Watch
Resistance: $3,320 (EMA 200), $3,400 (Trendline)
Support: $3,220 (Zone), $3,100 (Next Major Support)
⏳ Conclusion
ETH is at a critical decision point. A bounce could lead to a breakout, but failure to hold could trigger more downside. Watch for a reaction around $3,220! 🚦

Ethereum 4 Hour Technical AnalysisAnalysing Ethereum on a 4-hour chart involves looking at various technical indicators and chart patterns to assess potential price movements. Here's a chart based on current data and insights from various sources

BUY ETHEREUM ⧫ - 1DEthereum has been one of our favorite and strong project, from the past few months it has been continue increasing, thus not giving a chance to buy at cheap, but now is the time to build some positions as the price drops to $3300 (nearly 6%) from the recent highs. Considering this Bull market, Ethereum will make new all time highs .
Must use stop loss in trading , this is my personal view and not a financial advice. Cryptocurrency market is highly volatile and thus can lead to financial loss, kindly #DYOR.

Ethereum taken intraday support chances are high for reversalHello everyone let's do some analysis on crypto,,
Ethereum is trading in a very tight range of 3760-3550, and it has taken perfect support in lower support zone in neutral rising bullish channel. Chances are higher for reversal from here,, This is gonna to give good intraday move. Please follow strict stop loss in it,,
Disclaimer:- Please always do your own analysis or consult with your financial advisor before taking any kind of trades.
Dear traders, If you like my work then do not forget to hit like and follow me, and guy's let me know what do you think about this idea in comment box, i would be love to reply all of you guy's.

ETHEREUM FORMS A BULLISH TRIANGLE CRYPTOCAP:ETH is currently stuck around 2600 level with long term support at 2350. Current market structure is bullish triangle with some pullback at 2550.
Looking at CRYPTOCAP:BTC , which is ultra bullish, Ethereum can aim towards 3000 psychological level.

Ethereum Ready to $6000 ?CRYPTOCAP:ETH Chart Update
Next Target: $5500-$6000
Best Accumulation Zone: $2500-$2100
Long Term Target: $8000-$10,000
#Ethereum bounced strongly from the $2100 level (channel support), and with the next resistance at $5500-$6000, I’m expecting the next stop for #ETH to be $6000

Ethereum (ETH) Macro OverviewToday, I would like to share my analysis of Ethereum (ETH) on a macro time frame. Based on the current price action, I foresee a potential rally toward the $2,800–$2,900 zone, which could align with a possible market reaction during the FOMC meeting regarding rate cuts scheduled for September 17-18.
Should ETH break the upper demand zone, further upward movement may be possible, though I am personally anticipating a larger market correction post this rally. A downturn towards the $2,200 range appears likely, with the potential for ETH to reach as low as $1,500 by year-end.
One of the key indicators supporting this outlook is the Money Flow Index (MFI) on both the daily and weekly time frames, which has been trending downward since May. This suggests that capital has been gradually exiting ETH, which could lead to increased selling pressure.
Another factor to consider is Bitcoin (BTC), which could see a significant correction from the $65,000 level. This could trigger a cascading effect, further driving down ETH prices.
Given this macro setup, I plan to initiate a swing short position in ETH/USDT around the $2,800 range. In the near term, ETH could hit the $2,621 pivot level before any further developments.
Disclaimer: This is not financial advice. Please conduct your own research and trade responsibly.

"Ethereum" Weekly Chart Looking Good Key Highlights : 🔰
🔷 Script Name : Ethereum
🔷 Script Symbol : CRYPTO:ETHUSD
🔶 Support Zone : Taking Support at 200 EMA Weekly 🔥
🔶 Weekly RSI Cool Down 😊
Disclaimer : This is NOT Investment Advice. This Post is Meant for Learning Purposes Only. Invest Your Capital at Your Own Risk.
Happy Learning. Cheers!!
Shyorawat Arun Singh ❤️
(@Shyorawat_ArunSingh)
Founder : Shyorawat Investing School

Ethereum Ready for Another Dump till $1700 ?Ethereum Chart Technical Analysis CRYPTOCAP:ETH
Currently #ETHUSDT Trading at 4H Support Level.
1️⃣ If $2160 level breaks, ETH could drop to $1,750 (Scenario 1)
2️⃣ But if price bounces off $2,160, we could see a 5-10% relief rally. ( Scenario 2 )
My view:
- Bearish below $2,240
- SUPER bearish if $2,160 breaks!
Overall, #ETH is standing on thin ice at a very crucial support zone.
One break could lead to a cascade of selling.
Trade safe!

Ethereum Ready for $3000 or $1500 ?CRYPTOCAP:ETH Chart Pattern:
#Ethereum price is currently experiencing a bullish pattern in higher time frames, forming both a symmetrical triangle and a bull flag.
The breakout and subsequent retest of the support level have been confirmed, indicating a potential target of $2,800.
However, if the price of #ETH breaks down below the $2,240 support level, it could turn bearish, potentially dropping to the $1,900-$2,000 range.
It is always important to trade with caution, considering the trend and confirmations before making any decisions.
#TRBUSDT #BULLRUN2024 #HappyNewYear

Ethereum 1 Hour Chart UpdateEthereum Market Update
Current Analysis:
Ethereum faced a significant setback, plummeting by 7.5% after breaching the $2335 support level. As we navigate this volatile landscape, it's crucial to monitor key support and resistance zones.
Potential Scenarios:
- Upward Move: If ETHUSDT maintains support at $2200, there's potential for an upward rally towards $2330.
- Downside Risk: Failing to break the $2350 resistance could trigger another downturn, potentially reaching $2050.
Critical Levels:
Support Levels: $2200/$2090
Resistance Levels: $2350/$2390

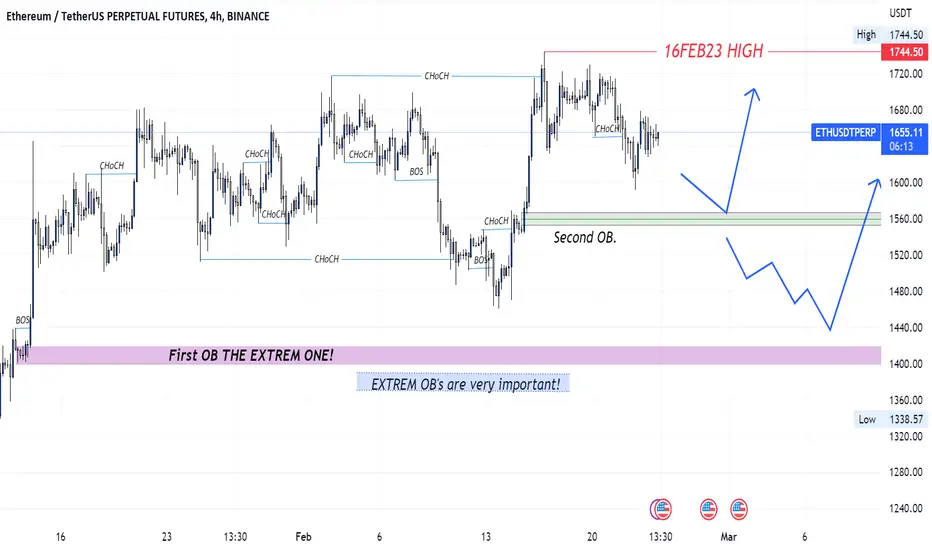
THIS IS ETHEREUM TETHERUSETHEREUM is in UP trend moving UP since 01JAN23 on 14JAN23 we can see HUGE BULL CANDLE and I found my BOS so I marked my OB first OB on 4H.
On 15FEB23 saw couple of BIG BULL CANDLE and that's my second OB.
ETHEREUM market showing BIG CANDLES with BIG WICKS!
If market break second OB and went down then what? NO WORRIES!!!
Because we have EXTREME OB already and never underestimate the Extreme OB so our first OB is UNMITIGATE since 13JAN23 once first OB mitigate we can go for LONG and we can use Trailing SL.
Ethereum ETH Fibonacci WeeklyThe highest precision price is in this picture. If others are fearful, be greedy, if others are greedy, be fearful. Ethereum ETH Fibonacci weekly line, including Ethereum's short-term, medium-term, long-term, top and bottom prices, and support prices And resistance price, breakthrough price and falling price, rebound price and stepping back price, bull market price, bear market price, as long as you know how to use it, this picture is your money printing machine, the cryptocurrency market news is flying all over the world, it is better to use a few The position of the line is firm, and it is better for you to understand my picture of Satoshi Nakamoto after listening to a lot of others.

ETHEREUM strong consolidation. BLIND BUY for a target of 1580.+After the panic sell move ethereum has absorbed all the selling and now preparing for the giant upmove. The chart looks very strong and if you're holding ETHEREUM keep holding for a target of 1580+. SL = 1160 BINANCE:ETHEUR

ETHEREUM weak price action 1300 coming on breakIng 1500 BEWARE!Although ETHEREUM has taken a support at 1500 level but the price action suggests there is more weakness to follow if it retests support again & breaks with decent volume 1300 is on the cards, BUT first wait for it to break 1500 decisively.

ETHEREUM massive breakdown ahead? Weekly cup & handle? 450TARGETIt maybe too early to say but does that look like inverted cup & handle on weekly? It would be interesting to see if it breaks that with huge volume, incase it does I would not even touch ETHEREUM for a long period of time. I hope that isn't the case though..

Ethereum Short-Term Important Levels 9/2/2022These are the most important Ethereum levels at the moment!
Pivot: ~1565 | Support: ~1533 | Resistence: ~1652

Ethereum, rising wedge breakdown, 1450 on cardsAfter a sharp downmove Ethereum is sliding and can slide further to 1450 where there's a good support.
