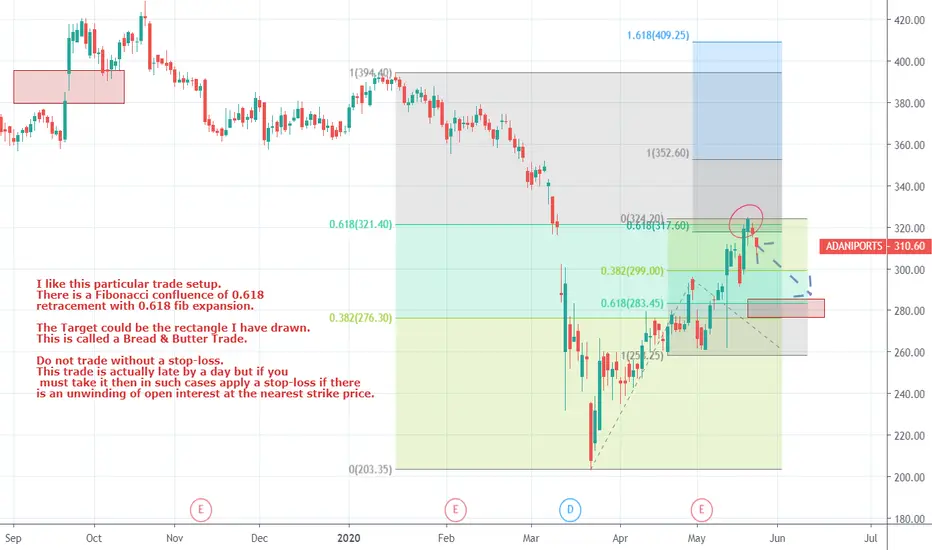
Fibonacci retracement and Parallel channel breakPrice has completed 100% Fibonacci retracement. Price more likely to move up after consolidation in parallel channel. Take buy position once breakout or bottom price of channel with stop loss for long term.
Search in ideas for "FIBONACCI"

Adani transmission Fibonacci Retracement, extensionAdani transmission Fibonacci Retracement, extension
If same trend continues then potentially next milestone could be 1100
*** Purely personal analysis ***
Investment in securities is subject to market risks. Kindly consult your financial advisor before investment

PFC resistance breakout and fibonacci PFC resistance breakout and fibonacci support levels respected. Short to medium term bullish anticipated. Target can be 150 if trend continues.
*** Purely personal analysis ***
Investment in securities is subject to market risks. Kindly consult your financial advisor before investment

UPL channel and fibonacci danceUPL channel and fibonacci dance. If channel breakout then fibonacci extension wise this will go to 738
*** Purely personal analysis ***
Investment in securities is subject to market risks. Kindly consult your financial advisor before investment

BTCUSD has a target of 30500 as per Fibonacci analysisWe can expect a move to an important Fibonacci level of 2.618 which comes at 30500 for Bitcoin

Bitcoin 38.2% Fibonacci RetracementBitcoin made a high of around $19.5k and crashed by about 15% from there. This indicates a shift to short-term bearish sentiment.
21 Week moving average is around $12500. In 3-4 weeks, it would increase to $13800. Bitcoin should take support from the 21-week moving average and 38.2% Fibonacci level of $13.8k which is our target.
If the high of $19.5k is taken down, then the short position must be closed.

phi (0.618), Golden Ratio(Spiral), Fibonacci ratio, NIFTY.We created a parallel channel by looking at market pivots that have lines (a), (b),....(e). If look at this chart and drawing minutely, then you will found that where are maximum points(dots). That is called gravitation to attract the price value. In the future, while the pullback price tries to test this line in the coming days.
Fibonacci ratio, Many traders know this , but few know how to apply it .
three market ranges (1,2,3) which range defines
the 50 percent division at 6926.8.
Let's check the shortest range (3):
Look at "a" and "b"
another range (2)
Look at "c" and "d" .
Let's check the whole picture.
The range of applied for the fib. retracement if perfect known after applying everything above and confirmed.
I am going to remove everything and just keep a 50% division of range.
Now check out this both range of "a" and "b" marked.

S&P 500 Index is trading near very important Fibonacci LevelS&P 500 Index is trading near very important Fibonacci Level.
Which is exact half way of 1.618 and 2.618 Extension level.
We can see some divergence also..Which is very negative sign.
Lets see How US market will reply on FED EVENT

Divergence formed exactly near Fibonacci level1) Divergence formed exactly near Fibonacci level
2) Double bottom formed
3) stock trading near trendline
=========sabhi tare eksath Judd gaye he===========

Avanti Feeds nearing important 61.8% Fibonacci golden ratioNSE:AVANTIFEED If we look @ the monthly chart & apply Fibonacci, Now stock is nearing 0.618 Golden ratio. (1440 zone). So 1 need to watch how this stock behaves @ this level. Given if & only if stock bounces from this important golden ratio zone one can expect stock to reach 4000 in 300+ days or even 4400 (161.8% of Fibonacci extension). But plz do note that just bcz stock is hitting 0.618 zone isn't a blind buy. Stock should show some reversal signs like bullish power candle/ Hammer candle etc..

Bank of India : Fibonacci 50 % Support Based on Principles of Fibonacci Retracement and Extensions. NSE:BANKINDIA
Period :Medium Term
Trend: Up Trend
Start Period and Price : 127.55 / 27-Jun-17
End Period and Price: 216.80 / 17-Nov-17
Based on Fib 50 % Retrenchment
Entry : 172.10 (+/-)2
Stop loss : 157.50 Strict
Target : 206.50

NIFTY VOLATILITY + Fibonacci Based Resistance & Support Level.NIFTY VOLATILITY along with Fibonacci Based Resistance & Support level.
In daily candle Bearish Engulfing pattern, signifies some Correction Ahead.
Daily levels are Plotted in BOX form forr Easy watch Tick by tick.
Box measured 15 min Candle having Width of 25 Candle.
Weekly Levels (from 05th Jun 2017 to 09th Jun 2017)
Res: 9672.9 - 9698.7 - 9741.3 - 9772.7 - 9798 - 9841.2
Sup: 9611.8 - 9586 - 9543.4 - 9513.1 - 9488 - 9445.5
PS: Please Like/share & keep motivated, If you like Ideas/Analysis, . For any queries, please feel free to COMMENT. Thank you.


NIFTY levels for tomorrowFibonacci extension levels .......................................................................................................................................................................


fibonacci strategyentry @ 80% retracement
take profit @ this levels .382 and .25
stop profits @ 100% retracement


FIBONACCI SAYS BUY IT24-01-2018 BUY ULTRACEMO ABOVE 4411 TGT1=4476 TGT2=4526 TGT3=4601 closing base SL=4373

Elliott wave counts of USOIL and Fibonacci levels (up, down, up)Hello Friends, here we had shared possible Elliott wave counts of USOIL CRUDEOIL chart on hourly time frame, which is suggesting we are currently in impulse wave of some degree, in which we had completed (i)-(ii)-(iii)-(iv) and now possibly we are unfolding wave (v) of bigger degree wave 1, in this scenario we had seen that wave (iii) has been extended and clearly showing subdivisions inside it and also shown gap up as its nature, so we can assume that wave (v) can go up to equality of wave (i) which is showing price level of near $ 86.75, post completion of it, we can start retracement as a wave 2 in a-b-c pattern, that correction could get support at that same gap which we got gap up in wave (iii) so it can provide good support and as per Fibonacci measurements 50% retracement of entire rally also meets that same level of gap support which is pegged at $ 75.50, which can make that support more stronger. I am not sebi registered analyst. My studies are for educational purpose only. Please Consult your financial advisor before trading or investing. I am not responsible for any kinds of your profits and your losses.
Overall crude oil is looking bullish right now then little down to unfold wave 2 and then again up to unfold wave 3.
Most investors treat trading as a hobby because they have a full-time job doing something else.
However, If you treat trading like a business, it will pay you like a business. If you treat like a hobby, hobbies don't pay, they cost you...!
Disclaimer.
I am not sebi registered analyst.
My studies are for educational purpose only.
Please Consult your financial advisor before trading or investing.
I am not responsible for any kinds of your profits and your losses.

ACC perfectly followed Fibonacci levels and Technical levels.NSE:ACC
Look how ACC perfectly followed Technical and Fibonacci levels.
First on 15-07-2021,
It went to check demand in range of 2067-2069. And got good supply from there (marked with black circle in Candle Chart).
And after that we can see big green candle, which broke trend line in Candle chart (Marked with blue arrow in Candle Chart) and at the same time it also brake the Bearish Divergence ( Red Line in RSI) trend line. Breakout Point is marked with Blue Arrow in RSI. This shows the breakout and the trend to go bullish.
And as mentioned in chart in my previous post about ACC making bearish divergence, we can only get sell opportunity in ACC if it trades below 2066. So there was no trade to sell ACC on 15-07-2021.
Now Today, 16-07-2021
It closed above our Target 1 as per Fibonacci level. So now the next target to watch in ACC is 2160 as per Fibonacci levels. You can take positional trade.
Hope this helps you to understand the analysis of technical aspect for trading.
Comment below if my Ideas are helping you to understand the analysis.
Also comment your suggestion or doubts.
All the best for trading in next week. Have a good weekend.
