Don't miss the great buy opportunity in CADCHF Trading suggestion:
. There is a possibility of temporary retracement to suggested support line (0.69315). if so, traders can set orders based on Price Action and expect to reach short-term targets.
Technical analysis:
. CADCHF is in a range bound and the beginning of uptrend is expected.
. The price is below the 21-Day WEMA which acts as a dynamic resistance.
. The RSI is at 59.
Take Profits:
TP1= @ 0.69857
TP2= @ 0.70340
TP3= @ 0.70595
TP4= @ 0.71330
TP5= @ 0.71884
SL= Break below S3
❤️ If you find this helpful and want more FREE forecasts in TradingView
. . . . . Please show your support back,
. . . . . . . . Hit the 👍 LIKE button,
. . . . . . . . . . . Drop some feedback below in the comment!
❤️ Your Support is very much 🙏 appreciated! ❤️
💎 Want us to help you become a better Forex trader ?
Now, It's your turn !
Be sure to leave a comment let us know how do you see this opportunity and forecast.
Trade well, ❤️
ForecastCity English Support Team ❤️
Search in ideas for "FOREX"

Don't miss the great buy opportunity in GBPCHFTrading suggestion:
. There is a possibility of temporary retracement to suggested support line (1.18200). if so, traders can set orders based on Price Action and expect to reach short-term targets.
Technical analysis:
. GBPCHF is in a range bound and the beginning of uptrend is expected.
. The price is above the 21-Day WEMA which acts as a dynamic support.
. The RSI is at 68.
Take Profits:
TP1= @ 1.18950
TP2= @ 1.19517
TP3= @ 1.20280
TP4= @ 1.21220
TP5= @ 1.22000
SL= Break below S2
❤️ If you find this helpful and want more FREE forecasts in TradingView
. . . . . Please show your support back,
. . . . . . . . Hit the 👍 LIKE button,
. . . . . . . . . . . Drop some feedback below in the comment!
❤️ Your Support is very much 🙏 appreciated! ❤️
💎 Want us to help you become a better Forex trader ?
Now, It's your turn !
Be sure to leave a comment let us know how do you see this opportunity and forecast.
Trade well, ❤️
ForecastCity English Support Team ❤️

Don't miss the great buy opportunity in NZDJPYTrading suggestion:
. There is a possibility of temporary retracement to suggested support line (68.777). if so, traders can set orders based on Price Action and expect to reach short-term targets.
Technical analysis:
. NZDJPY is in a range bound and the beginning of uptrend is expected.
. The price is above the 21-Day WEMA which acts as a dynamic support.
. The RSI is at 64.
Take Profits:
TP1= @ 70.520
TP2= @ 71.104
TP3= @ 71.590
TP4= @ 72.650
TP5= @ 73.490
SL= Break below S3
❤️ If you find this helpful and want more FREE forecasts in TradingView
. . . . . Please show your support back,
. . . . . . . . Hit the 👍 LIKE button,
. . . . . . . . . . . Drop some feedback below in the comment!
❤️ Your Support is very much 🙏 appreciated! ❤️
💎 Want us to help you become a better Forex trader ?
Now, It's your turn !
Be sure to leave a comment let us know how do you see this opportunity and forecast.
Trade well, ❤️
ForecastCity English Support Team ❤️

Don't miss the great buy opportunity in NZDJPY Trading suggestion:
. There is a possibility of temporary retracement to suggested support line (68.61). if so, traders can set orders based on Price Action and expect to reach short-term targets.
Technical analysis:
. NZDJPY is in a range bound and the beginning of uptrend is expected.
.The price is above the 21-Day WEMA which acts as a dynamic support.
. The RSI is at 58.
Take Profits:
TP1= @ 69.57
TP2= @ 69.76
TP3= @ 70.43
TP4= @ 71.13
TP5= @ 71.65
SL= Break below S2
❤️ If you find this helpful and want more FREE forecasts in TradingView
. . . . . Please show your support back,
. . . . . . . . Hit the 👍 LIKE button,
. . . . . . . . . . . Drop some feedback below in the comment!
❤️ Your Support is very much 🙏 appreciated! ❤️
💎 Want us to help you become a better Forex trader ?
Now, It's your turn !
Be sure to leave a comment let us know how do you see this opportunity and forecast.
Trade well, ❤️
ForecastCity English Support Team ❤️

USDCAD Short entry seems goodUCAD Short entry could be a good option in the long run as the corona virus fear strikes the market.
The stock markey has already fallen .....and this time forex could be the next target.

GBPCHF trading support @ 1.2672 #forex #forexsignals
GBPCHF can be a nice 600 PIPs short below the indicated support at once, But here we will take a more moderate trade yet enjoying 300+ PIPs at once!!
Support - 1.2672
Entry - 1.2662
SL - 1.2864
TP - 1.2341
Supporting Fundamentals - The #Pound is fearing bears amidst all the Brexit Noises.
Will update the idea as it progresses and make comments.

GBPINR Trade Setup !!TREND ANALYSIS
Follow Chart Instruction.
Do not be Hurry for entry.
Wait for Proper Entry Setup.
Buy/Sell with Best Risk Reward.
Educational Chart Only.
You can Comment and ask the TREND ANALYSIS of any STOCK/SCRIPT/INDEX/FOREX.
Wait for entry setup, if available then Long/short.
R:R is good.

My first for Forex, NZDCADWelcome to my first analysis, !NZDCAD is a pretty simple setup
---> RSI making lower low
----> price making lower high.
im expecting a retrace to about 0.901xx for initial target and 0.899x for the next. if it achieves that we shall take it from there.
(( seems to be making some sort of a diagonal ))

A PRO INDICATOR FOR BITMEX/FOREX/STOCK WITH 90% ACCURACYThis indicator is specially made for BITMEX and FOREX.
It will give u automatic BUY/SELL signals.
You can easily take minimum 20% profit daily from bitmex by this indicator.
TO BUY THIS INDICATOR CONTACT US ON TELEGRAM @marianzs Or U CAN ALSO MESSAGE US ON TRADINGVIEW.
OUR TELEGRAM CHANNEL t.me

EURUSD looking for direction. #trading #forex #eurusdWill the Fed give direction to the movement? If it rebounds there is space up to 1.182; if it breaks the support it goes down to 1,163

Will GBP JPY break 139.525 to continue lower?Hi all,
The potential momentum of the signals formed in a stable pattern.
we can evidently, witness the impulse and its correction in rapid manner(shown in graph).
From 156.684 ,we can see the impulse and its correction one after another and finally it sticks at 145.222(shown in graph).
Market is like a coin it only has two probabilities, but today both favors for YEN.
Two probabilities are,
Candles may grow as a impulse (or) correction and its impulse.
For instance, consider the candles are in impulse, it will continue to grow down. (or) consider that as a correction,it give small a rise and again pullback towards down.(shown in graph)
SIGNAL SPECIFICATIONS
PAIR: GBPJPY.
ORDER: SELL.
STOP LOSS: 150.105.
If it impulse means,
TAKE PROFIT 1: 143.216.
TAKE PROFIT 2: 139.525.
If correction means,
TAKE PROFIT 1: 145.222.
TAKE PROFIT 2: 143.216.
TAKE PROFIT 3: 139.525.
----------------------------------------------------------------------------------------------------------
Our Unique Features:
1. Follow our 15 signals ….10% equity will increase in your account for sure.
2. We are not TP1, TP2, TP3..
3. We are not Trailing stop! or average the trades.
4. 2% Risk Management Per trade.
5. Risk vs Reward upto 1:7.
Note:
Trade signals would usually have a risk to reward ratio of 1:2.
It means that, even 2 out of 4 signals hits their SL marks, the other two would have closed with profit.
This allow you to be good in overall pips profit.
Signals are usually inter-day (Based on the daily candle) therefore, trades would usually have a holding time of an average minimum of 24 hours.
Note: Everything works with Best money management.
Note: Please leave comments for any query.
Disclaimer: This is my trading experience, it is not an invite or recommendation to trade.
Best
Forextamil

EURUSD (FOREXCOM): Buy above 1.241 SL:1.22 and T1:1.27 T2:1.31EURUSD on FOREXCOM exchange has taken support on ichimoku Kumo cloud and is on verge of breaking out. Buy above 1.241 with SL 1.22 and Target 1 at 1.27 and Target 2 at 1.31

USD INR--Expected bullish up to 66.60--infi forexUSD INR Spot 65.45, expected to go longer, but it's not right time to buy if market not break 65.27, and then 65.04, and stay long up to 65.74, expected to test 66.60 in coming Days, 65.04 is strong support and 50% Fibo Level, also potentially forming bullish flag.
Call Buy @ 65.74, And 65.02
call Sell @ 65.45 to 65.27 for 12 Paisa
U

EURINR---INFI FOREX SPOT 77.74, at higher from last Feb 2016, this level comes 3 times from last 3 years .. Dec 2014, Aug 2015 and feb 2016, now it's again at 77.74, high at 77.80-90, if market holds 76.96 to 77.04 then expecting to go higher 78.50, then 79.80-95..in coming weeks. on the other hand i'm also suggest to book at least 50% exposer at this point only to exporters for coming 2- months, and if market test again 76-90-77.10 again and gain also book almost 20% exposer for rest make it open

USD INR View-- Infi forexUSD INR Spot at 65.05, after 4 months, i'm expecting if market holds 64.90, would break 65.20, 65.60 then 66.10. on the other hand support is at 64.70, then 64.30.. most probably it's expected on higher side exporter should hedge at least 50% of their exposer, at 65.20 Spot for next 2 months. and importers hedge at 64.90.. if break it then at 64.70..64.30....in the coming Weeks. It's not expecting to down more then 64.30.

EUR USD EUR USD spot 1.1476-80, there is clearly indicating in weekly chart market is forming triple bottom, and market 1.1450 after forming series of lower high, neckline at 1.1450-52, market tested this 2 times now it's highly expected it's break strongly ( not the false break) and again test 1.1450, then will higher up to the minimum objective 1.2450, almost 1000 Pips.---INFI FOREX SERVICES----AAYUSH JALHOTRA-----+91-8459522210

Currency Wars and Forex Trading🌍 What Are Currency Wars?
A currency war—sometimes called “competitive devaluation”—occurs when countries deliberately try to weaken their own currency to gain economic advantages over other nations. The term became widely popular after Brazil’s former finance minister Guido Mantega used it in 2010 to describe global monetary tensions following the 2008 financial crisis.
In a currency war, governments or central banks lower the value of their currency to:
Boost exports (cheaper goods abroad)
Reduce trade deficits
Stimulate domestic economic growth
Increase inflation when facing deflation risks
Major central banks involved in such policies have included the Federal Reserve, the European Central Bank, and the Bank of Japan.
🔧 How Countries Devalue Their Currency
Countries typically devalue their currency using:
Lower Interest Rates
When interest rates fall, investors earn less from holding that currency, so demand drops, and the currency weakens.
Quantitative Easing (QE)
Central banks increase the money supply by purchasing bonds or financial assets, which can reduce currency value.
Direct Market Intervention
Governments may directly sell their currency in foreign exchange markets.
Verbal Intervention
Policymakers may influence markets through public statements signaling a preference for a weaker currency.
⚔️ Historical Example: Japan’s Monetary Policy
In 2013, under Prime Minister Shinzo Abe, Japan implemented aggressive monetary easing through the Bank of Japan. The policy—known as “Abenomics”—aimed to end decades of deflation by weakening the Japanese yen.
As the yen fell sharply against the U.S. dollar:
Japanese exports became more competitive.
Other Asian economies worried about losing trade advantages.
Global markets experienced increased volatility.
This episode is often cited as a modern example of currency war dynamics.
📈 What Is Forex Trading?
Forex (Foreign Exchange) trading is the global marketplace for buying and selling currencies. It is the largest financial market in the world, with daily trading volumes exceeding $6 trillion.
Currencies are traded in pairs, such as:
EUR/USD
USD/JPY
GBP/USD
Traders speculate on whether one currency will strengthen or weaken relative to another.
Major currency pairs often include:
United States dollar (USD)
Euro (EUR)
Japanese yen (JPY)
British pound sterling (GBP)
🏦 How Currency Wars Affect Forex Markets
Currency wars create significant volatility in forex markets. Since forex traders profit from price movements, central bank interventions can create both opportunities and risks.
1️⃣ Increased Volatility
Unexpected rate cuts or monetary easing cause rapid price swings.
2️⃣ Trend Formation
Sustained devaluation policies can create long-term currency trends.
3️⃣ Safe-Haven Flows
In times of currency tension, investors may shift to perceived safe-haven currencies like the U.S. dollar or Japanese yen.
📊 Example: Quantitative Easing in the U.S.
After the 2008 global financial crisis, the Federal Reserve launched multiple rounds of quantitative easing. The increase in money supply initially weakened the U.S. dollar.
Forex traders responded by:
Selling USD during early QE phases
Buying commodities priced in USD
Shifting funds into emerging markets
However, as the U.S. economy recovered faster than others, the dollar later strengthened—showing how currency wars can have complex, long-term effects.
💼 Who Participates in Forex Markets?
Forex participants include:
Central Banks – Influence currency value through monetary policy.
Commercial Banks – Facilitate global trade and large transactions.
Hedge Funds and Institutions – Trade currencies for profit.
Corporations – Hedge currency risk in international trade.
Retail Traders – Individual traders using online platforms.
Unlike stock markets, forex markets operate 24 hours a day, five days a week.
🧠 Strategies Used in Forex Trading During Currency Wars
When currency wars intensify, traders adjust their strategies:
🔹 Carry Trade
Borrow in low-interest-rate currencies and invest in higher-yield currencies.
🔹 Trend Following
Ride sustained devaluation trends triggered by policy changes.
🔹 News-Based Trading
Trade immediately after central bank announcements.
🔹 Hedging
Protect investments from sudden currency fluctuations.
However, these strategies carry risk. Currency interventions can reverse quickly if governments change policy.
⚖️ Risks of Currency Wars
Currency wars can create global instability:
Trade tensions may escalate.
Inflation can rise unpredictably.
Asset bubbles may form.
Emerging markets may suffer capital outflows.
For forex traders, the biggest risks include:
Sudden policy reversals
Geopolitical shocks
Excessive leverage
High leverage is common in forex trading, amplifying both profits and losses.
🌐 The Global Impact
When multiple countries attempt to devalue simultaneously, the result can be global economic imbalance. If every country weakens its currency, no nation gains lasting trade advantage.
Institutions like the International Monetary Fund monitor exchange rate policies to reduce destabilizing competitive devaluations.
Currency wars often reflect deeper economic struggles:
Slow growth
High unemployment
Debt burdens
Trade imbalances
In extreme cases, prolonged currency conflicts can contribute to broader financial crises.
📌 Key Differences: Currency Wars vs Forex Trading
Currency Wars Forex Trading
Government-driven Market-driven
Policy-based Profit-based
Long-term economic impact Short- to medium-term trading
Affects entire economies Affects individual portfolios
Currency wars are macroeconomic events, while forex trading is a financial activity reacting to those events.
🔮 The Future of Currency Competition
As global economies become more interconnected, currency competition remains a persistent risk. Factors influencing future currency tensions include:
Digital currencies and central bank digital currencies (CBDCs)
Trade conflicts
Geopolitical rivalry
Monetary policy divergence
For forex traders, understanding macroeconomics is essential. Currency wars are not just political events—they create the trends, volatility, and opportunities that drive forex markets.
📘 Conclusion
Currency wars and forex trading are deeply interconnected. When governments attempt to manipulate exchange rates to gain economic advantages, they reshape global financial markets. Forex traders monitor central bank decisions, economic indicators, and geopolitical developments to anticipate currency movements.
While currency wars can stimulate domestic economies in the short term, they risk global instability if pursued aggressively. For traders, they offer both opportunity and danger. Success in forex trading during currency conflicts requires disciplined risk management, deep macroeconomic understanding, and awareness of how policy decisions ripple through global markets.
In the modern global economy, currency value is not just a reflection of supply and demand—it is also a powerful political and economic tool.

AUDJPY Hourly 1:4 RRAs AUDJPY is in Uptrend
my idea to trade is mentioned in Chart
entry point OB rest at equilibrium of Dealing range
i will only enter after conformation of lower time frame (Upside Choch) in either one or five minutes
if it played well will get 1:4 RR Trade
#Forex #AUDJPY #FXtrade

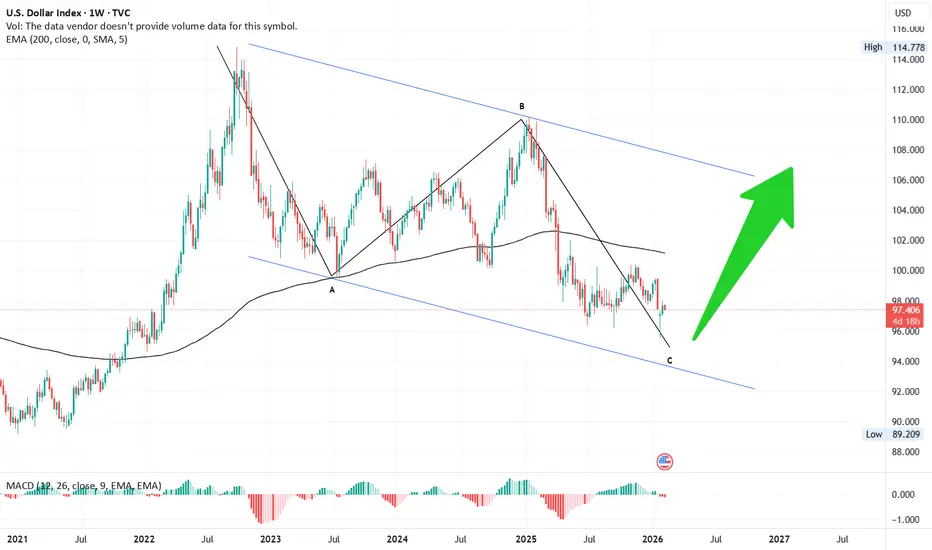
#DXY📊 DXY Technical Outlook 💵
On 26 Sep 2022, the Dollar Index (DXY) began a weekly correction. What followed was a clear 5-wave decline, bottoming at 99.75 on 17 Jul 2023 — marking the completion of Wave A.
From there, the index rallied in 3 waves, reaching a high of 110 on 23 Dec 2024, forming Wave B. Currently, the C wave decline looks nearly complete as of 26 Jan, with price also testing the 200 EMA on the monthly chart.
⚡ Key Signal to Watch:
If DXY crosses above 100, it could signal the start of a new bull cycle, with potential upside targets in the 110–120 range.
🔑 Takeaway:
The structure suggests a zig-zag correction is unfolding, and the next move could define the dollar’s medium-term trend.
TechnicalAnalysis #DXY #Forex #TradingInsights #MarketOutlook
DAILY FOREX SCAN Session – 26 05 02 26Scanning multiple forex pairs to filter high-quality trade setups. No trades are forced—only structure-based opportunities.
Note: There may be a delay in this video due to upload processing time.
Disclaimer: FX trading involves high leverage and substantial risk, and losses can exceed your initial investment. This content is for educational purposes only and should not be considered financial advice. Trade at your own risk.

DAILY FOREX SCAN Session – 25 05 02 26Scanning multiple forex pairs to filter high-quality trade setups. No trades are forced—only structure-based opportunities.
Note: There may be a delay in this video due to upload processing time.
Disclaimer: FX trading involves high leverage and substantial risk, and losses can exceed your initial investment. This content is for educational purposes only and should not be considered financial advice. Trade at your own risk.

DAILY FOREX SCAN Session – 24 04 02 26Scanning multiple forex pairs to filter high-quality trade setups. No trades are forced—only structure-based opportunities.
Note: There may be a delay in this video due to upload processing time.
Disclaimer: FX trading involves high leverage and substantial risk, and losses can exceed your initial investment. This content is for educational purposes only and should not be considered financial advice. Trade at your own risk.

DAILY FOREX SCAN Session – 23 03 02 26Scanning multiple forex pairs to filter high-quality trade setups. No trades are forced—only structure-based opportunities.
Note: There may be a delay in this video due to upload processing time.
Disclaimer: FX trading involves high leverage and substantial risk, and losses can exceed your initial investment. This content is for educational purposes only and should not be considered financial advice. Trade at your own risk.
