Long Position Opportunity in GR Infrastructures A promising long position opportunity emerges in GR Infrastructures, as both price action and key indicators signal a potential reversal.
*Technical Analysis:*
Recent price action in GR Infrastructures has shown signs of a keen reversal, supported by various technical indicators. Notably, indicators such as MACD, RSI, and stochastic oscillators are exhibiting bullish divergences or crossover patterns, suggesting a shift in momentum towards the upside. Additionally, the stock price has approached significant support levels, further enhancing the bullish outlook.
*Trade Setup:*
For traders considering a long position, precise target and stop-loss levels are essential components of a well-defined trading strategy. These levels, meticulously outlined on the accompanying charts, offer clear guidance for entry, exit, and risk management.
*Target and Stop-loss Levels:*
- *Target:* Identified resistance levels indicate a potential upside target for the trade, reflecting the anticipated bullish momentum.
- *Stop-loss:* A predetermined stop-loss level is strategically placed to mitigate downside risk and safeguard capital against adverse price movements.
*Conclusion:*
In conclusion, GR Infrastructures presents an attractive opportunity for a long position, characterized by compelling reversal signals on both price action and technical indicators. Traders are advised to carefully consider the provided target and stop-loss levels to execute the trade effectively and manage risk prudently.
Disclaimer: Trading involves inherent risks, and individuals should conduct their own research or consult with a financial advisor before making any investment decisions.
Search in ideas for "INDICATORS"

NCC Bullish view- Short & Mid term viewPls refer chart.. View given based on indicators.. Daily and weekly indicators are in bullish mode..
Vijayaraghavan.K,
Chennai.

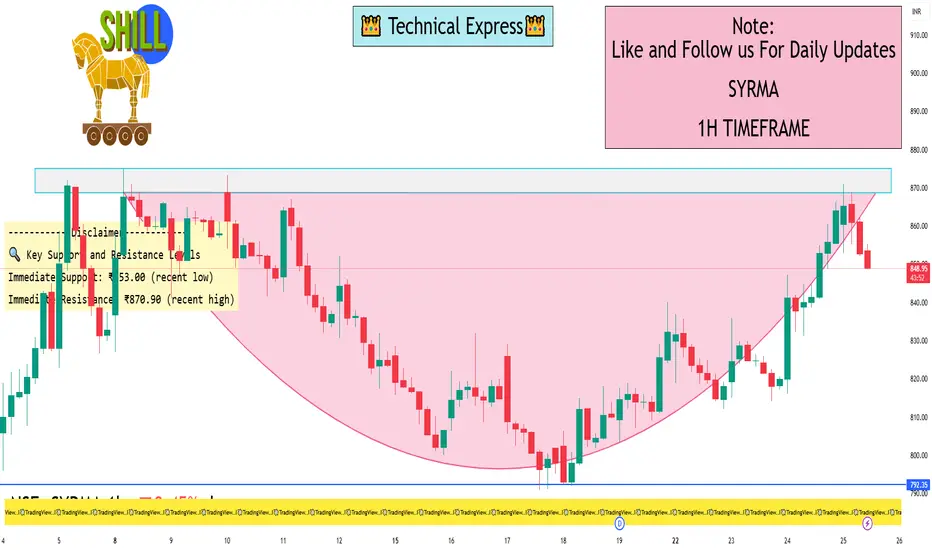
SYRMA 1 Hour View📈 1-Hour Time Frame Technical Overview
Based on recent intraday data, here’s a snapshot of SYRMA’s 1-hour technical indicators:
Relative Strength Index (RSI): 67.55, indicating bullish momentum.
Moving Average Convergence Divergence (MACD): 26.80, suggesting upward momentum.
Average Directional Index (ADX): 25.47, reflecting a moderately strong trend.
Stochastic Oscillator: 56.86, showing no overbought or oversold conditions.
Supertrend: ₹765.70, indicating a bullish trend.
Parabolic SAR (PSAR): ₹792.41, supporting the bullish trend.
Chaikin Money Flow (CMF): 0.110, suggesting accumulation of shares.
These indicators collectively point towards a bullish short-term trend for SYRMA.
🔍 Key Support and Resistance Levels
Immediate Support: ₹853.00 (recent low)
Immediate Resistance: ₹870.90 (recent high)
A breakout above ₹870.90 could signal further upside potential, while a dip below ₹853.00 might suggest a pullback.
For real-time intraday analysis on a 1-hour time frame, you can utilize the following platforms:
TradingView: Offers a comprehensive technical analysis overview, including indicators like RSI, MACD, and moving averages
Chartink: Provides customizable candlestick charts with various time frames and technical indicators
Investing.com: Features candlestick charts with pattern recognition and technical indicators
TopStockResearch: Delivers interactive charts with real-time updates and technical analysis tools
Newbie's Corner!Question : I am a learner and gain little bit of knowledge about indicators behavior from my own. But its take to much time to learn by searching things on internet. I have indications by RSI MACD & MA crossover that this stock go down or rise but timing missed. Please guide me.
Answer : There are two types of indicators. Leading and lagging. Leading indicators are ahead and lagging indicators are behind the market. When you start learning or trading use few indicators(Not more than two). Using more indicators complicate the process. Take one indicator, learn it fully, apply it in trading. Once you are confident that you learnt it well, take another indicator to learn. Timing of trading comes with experience. It can not be taught. Learning how to drive a vehicle is not possible by studying it from a book. Like that timing of trading wont come through learning from book. It comes through practise. To become a doctor we have to spend 7 yrs. To become engineer we have to spend 4 yrs. And ofcourse calculate the money we spend for education. But how many years we spend to learn trading? How much money we spend to learn about trading?

METROPOLIS – Big Volume Breakout + Price Action + Momentum___________________________________________________________________________
📈 METROPOLIS – Big Volume Breakout | Strong Momentum Building |
Price Action | Volume Structure
🕒 Chart Type: Daily Chart
📆 Date: July 9, 2025
___________________________________________________________________________
Price Action: METROPOLIS HEALTHCARE LTD has delivered a strong breakout on the daily chart, moving out of a multi-week consolidation zone between 1880–1910 with a wide-range bullish candle on July 9. This breakout above the key resistance of 2110.9 comes with a clean structure, strong closing, and sharp momentum — now placing the stock near its 52-week high. The accumulation phase is likely over, and this price action suggests the beginning of a new trend. As a key player in the diagnostics sector, METROPOLIS is gaining renewed attention post-COVID, with the healthcare space showing strong tailwinds and fresh investor interest.
___________________________________________________________________________
Chart Pattern: The chart is showing a Flat Base Breakout following a multi-week consolidation, indicating the potential beginning of a new momentum leg within the broader structure. Notably, the base was tight and shallow, which is considered a strong bullish signal as it reflects controlled accumulation and limited profit-booking. This clean breakout hints at renewed strength and the possibility of sustained upside if volume and structure hold.
___________________________________________________________________________
Candlestick Pattern: NA
___________________________________________________________________________
Volume Analysis: The volume analysis strongly supports the breakout, with trading volume on the breakout day soaring to over 5 times the average of the past 20 sessions. This surge was not just in quantity but also in delivery volume, signaling that the move was backed by genuine long-term accumulation rather than intraday speculation. As the classic saying goes, “volume precedes price” — and this sharp spike clearly points to smart money entering the stock, lending credibility to the breakout and hinting at further upside potential.
___________________________________________________________________________
Technical Indicators: The technical indicators paint a strongly bullish picture. The RSI on the daily timeframe is at 84, which, while overbought, reflects strength and momentum rather than exhaustion. The MACD has triggered a bullish crossover, with a steadily rising histogram indicating a healthy momentum buildup. Both CCI and Stochastic oscillators are deep in bullish territory — CCI above 300 and Stochastic over 88 — highlighting the intensity of the current uptrend. Additionally, the price has expanded beyond the upper Bollinger Band, suggesting the start of a volatility expansion phase, which often accompanies strong directional moves.
___________________________________________________________________________
Support & Resistance: The stock has given a decisive breakout above ₹2110.9, which now acts as a strong reference point and the official top of its recent consolidation range. This level was pierced by a bullish candle backed by high volume, confirming strength and conviction in the move. Ahead, the stock faces its first hurdle at ₹2157, a short-term resistance just above the breakout zone where minor profit-booking may emerge. Beyond that, ₹2256.1 marks a key medium-term resistance aligned with a previous swing high — a level to watch closely if the rally continues on solid volume. For positional traders, ₹2401.3 stands as a distant resistance zone that, while weak, could be relevant if momentum accelerates. On the downside, ₹1912.7 offers immediate support, being the level that held firm during base formation. If deeper retracements occur, ₹1767.5 and ₹1668.4 are layered supports where the price previously showed strength. At the very base lies ₹1315, the major long-term demand zone — a structural support that triggered the prior trend and serves as the final defence in case of any broad weakness.
___________________________________________________________________________
What’s Catching Our Eye: The price has decisively broken above a multi-week resistance zone, and what makes this move stand out is the massive volume backing it. This isn't just a random spike — it's a structured breakout with all the internals lining up beautifully. Momentum indicators like RSI, MACD, CCI, and Stochastic are all in bullish alignment, confirming that the strength is real and not a one-off event. This kind of confluence often signals the start of a meaningful trend, not just a short-lived rally.
___________________________________________________________________________
What We’re Watching For: The key question now is whether the price can sustain above ₹2110.9, the breakout level, without slipping back into the previous range — a crucial sign of breakout validation. We're also keeping an eye out for a healthy pullback toward the ₹1880–₹1910 zone, which could offer a far better risk-reward entry if the uptrend remains intact. Most importantly, the bigger picture is in focus: Is this the beginning of a larger trend aiming for ₹2400+, or are we simply witnessing a short-term momentum burst? The next few sessions will be critical in answering that.
___________________________________________________________________________
Best Buy Level for Equity (Low Risk Idea): A low-risk buying opportunity opens above ₹2110.9, but only if the price sustains this breakout for a day or two — confirming strength and avoiding a false breakout scenario. Alternatively, a pullback to the ₹1880–₹1910 zone could offer an excellent risk-reward setup, especially if accompanied by a clear bullish reversal signal (like a strong candle or volume spike). In both cases, keep a strict stop loss at ₹1839 on a closing basis to protect against deeper downside.
___________________________________________________________________________
Sector Tailwinds: The diagnostic sector continues to build long-term strength in the post-COVID landscape, as healthcare awareness and preventive testing become mainstream. Investors are increasingly allocating capital toward healthcare services, recognizing their structural growth potential. Add to that the rising urban demand for quality diagnostics and the company's strong brand trust, and you get a solid layer of fundamental support fueling this rally — making the technical breakout even more meaningful.
___________________________________________________________________________
Risk to Watch: If the price fails to hold above ₹2110 and starts slipping below ₹1910, there’s a real risk of this breakout turning into a false move. While the current momentum is strong, indicators are overheated, which increases the chances of a short-term pullback or shakeout. Most importantly — no confirmation means no trade. Avoid chasing blindly; let the price action validate the move before committing capital.
___________________________________________________________________________
What to Expect Next: The stock may see a sideways move or a minor pullback toward the ₹1910 zone as it digests the breakout. However, if the price holds above the breakout level, we could see a continuation move toward ₹2157–₹2256 in the near term. The key to watch is volume — if the stock holds near highs with rising volume over the next 2–3 sessions, it could trigger a strong trending move, confirming that smart money is firmly in control.
___________________________________________________________________________
How to Trade METROPOLIS (For Educational Use Only):
Here’s a simple Breakout Trade Plan based on current structure and volume confirmation:
🔹 Entry: Above ₹2110.9 — either on a successful retest of the breakout level or a clean follow-through candle with strength
🔹 Stop Loss: ₹1839 (on closing basis) to protect capital in case of breakdown
🔹 Risk-Reward: Aim for 1:1 initially, then trail for 1:2+ if momentum holds
🔹 Position Sizing: Adjust based on your capital, risk appetite, and SL range — avoid going all-in; stay disciplined with allocation
📌 Always follow your trading plan. This setup is for educational and analysis purposes only.
___________________________________________________________________________
⚠️ Disclaimer (Please Read):
• This chart is shared for educational purposes only and is not investment advice.
• I am not a SEBI-registered advisor.
• The information provided here is based on personal market observation.
• No buy/sell recommendations are being made.
• Please do your own research or consult a registered financial advisor before making any trading decisions.
• Trading involves risk. Always use proper risk management.
___________________________________________________________________________
💬 Found this helpful?
What would be your ideal entry in this METROPOLIS setup — breakout follow-through or demand zone pullback?
Drop your thoughts or questions in the comments below ⬇️
🔁 Share this with your trading community
✅ Follow STWP for clean technical setups backed by price action and volume
🚀 Let’s trade with patience, logic, and clarity!
Be Self-Reliant | Trade with Patience | Learn with Logic
___________________________________________________________________________

VDTradingView is a powerful charting platform and social network used by traders and investors worldwide to analyze financial markets and share trading ideas. It provides a comprehensive suite of tools for technical analysis, market research, and strategy development. Here's a detailed description of TradingView:
Key Features of TradingView:
Advanced Charting Tools:
TradingView offers highly customizable and interactive charts that support multiple timeframes and asset classes, including stocks, forex, cryptocurrencies, commodities, and indices.
Users can apply a wide range of technical indicators, drawing tools, and chart types (e.g., candlestick, line, bar, Renko, Heikin Ashi).
Pine Script for Custom Indicators:
TradingView includes a proprietary scripting language called Pine Script, allowing users to create custom indicators, strategies, and alerts.
Pine Script is beginner-friendly yet powerful enough for advanced algorithmic trading.
Real-Time Data and Alerts:
The platform provides real-time market data and price updates for various financial instruments.
Users can set up custom alerts based on price levels, technical indicators, or specific conditions.
Social Networking and Idea Sharing:
TradingView has a vibrant community of traders and investors who share their trading ideas, strategies, and market analyses.
Users can follow other traders, comment on ideas, and engage in discussions.

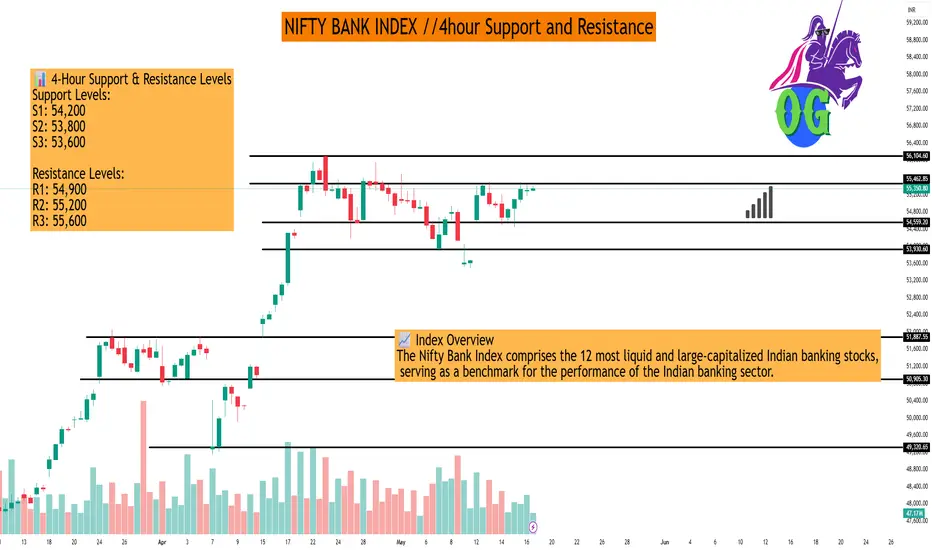
NIFTY BANK INDEX //4hour Support and ResistanceAs of May 17, 2025, here are the key 4-hour support and resistance levels for the Nifty Bank Index (BANKNIFTY), based on recent technical analyses:
📊 4-Hour Support & Resistance Levels
Support Levels:
S1: 54,200
S2: 53,800
S3: 53,600
Resistance Levels:
R1: 54,900
R2: 55,200
R3: 55,600
These levels are derived from recent price actions and technical indicators, indicating potential zones where the index might find buying or selling pressure.
📈 Exponential Moving Averages (EMA) on 4-Hour Chart
EMA 50: 54,750
EMA 100: 54,400
EMA 200: 54,000
EMA 400: 53,600
These EMAs can act as dynamic support or resistance levels, providing insights into the index's short to medium-term trend.
🔍 Technical Outlook
Trend: The 4-hour timeframe indicates a bullish trend, with the index trading above key EMAs.
Momentum Indicators: Indicators such as RSI and MACD suggest positive momentum, supporting the bullish outlook.
Price Action: The index has recently bounced from the 54,500 support zone, indicating buying interest at lower levels.
📌 Summary
Immediate Support: 54,200
Immediate Resistance: 54,900
Trend: Bullish on 4-hour timeframe
Traders should monitor these levels closely, as a break above resistance could signal further upside, while a drop below support might indicate a potential reversal or consolidation.
If you need more detailed analysis or information on specific indicators, feel free to ask!
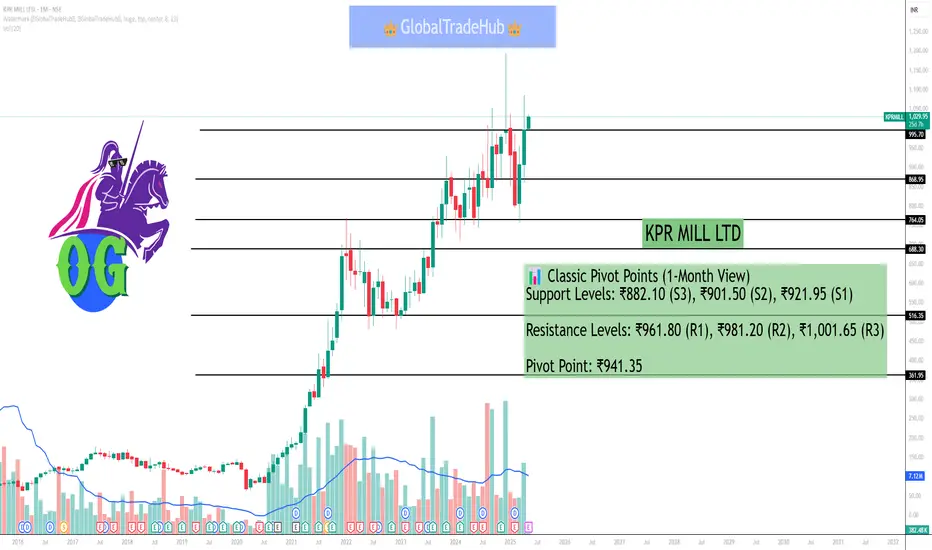
KPR MILL LTDAs of May 5, 2025, here are the key support and resistance levels for KPR Mill Ltd. (NSE: KPRMILL) based on recent technical analyses:
📊 Classic Pivot Points (1-Month View)
Support Levels: ₹882.10 (S3), ₹901.50 (S2), ₹921.95 (S1)
Resistance Levels: ₹961.80 (R1), ₹981.20 (R2), ₹1,001.65 (R3)
Pivot Point: ₹941.35
These levels are derived from the previous month's price range and are commonly used to identify potential reversal points in the market.
📈 Moving Averages & Indicators
Simple Moving Averages (SMA):
5-Day: ₹971.43
10-Day: ₹963.19
20-Day: ₹985.48
50-Day: ₹993.04
100-Day: ₹952.26
200-Day: ₹901.74
Exponential Moving Averages (EMA):
5-Day: ₹925.25 (Buy)
10-Day: ₹933.29 (Buy)
20-Day: ₹952.39 (Sell)
50-Day: ₹968.62 (Sell)
100-Day: ₹951.72 (Sell)
200-Day: ₹904.76 (Buy)
The alignment of these averages suggests a mixed short-term to medium-term outlook, with some indicators signaling bullish trends and others indicating bearish tendencies.
📉 RSI & Momentum Indicators
Relative Strength Index (RSI): 42.56 (Neutral)
Stochastic RSI: 59.15 (Buy)
MACD: 8.04 (Buy)
Average Directional Index (ADX): 32.45 (Buy
These indicators suggest a neutral to slightly bullish momentum, indicating potential upward movement if buying interest increases.
📌 Summary
Immediate Support: ₹882.10
Immediate Resistance: ₹961.80
Medium-Term Outlook: Neutral to slightly bullish, with mixed signals from moving averages and momentum indicators.
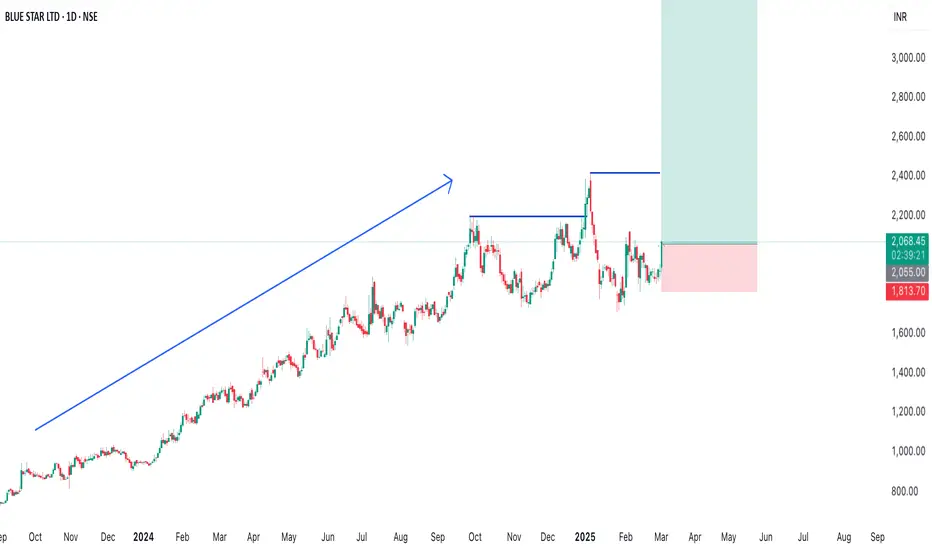
BLUESTARCO Price action analysisBased on the recent price action of Blue Star Ltd. (BLUESTARCO), the stock has shown mixed performance with some bullish indicators:
1. As of March 3, 2025, BLUESTARCO closed at 1,879.30, which is 22.25% below its 52-week high of 2,417.00 set on January 6, 2025.
2. The stock has been experiencing some volatility, with recent trading sessions showing both upward and downward movements:
o On February 23, 2025, the price moved down by 1.24% to 1,890.00
o On February 27, 2025, the trading volume exceeded the daily average by 15.06%
3. Technical indicators present a mixed outlook:
o Short-term moving averages (5, 10, 20-day SMAs) are showing bullish signals
o Long-term moving averages (50, 100, 200-day SMAs) are also indicating bullish trends
o The Relative Strength Index (RSI) and other momentum indicators are suggesting bullish momentum
4. The stock formed a cup and handle pattern between June and September 2024, with a breakout occurring on September 23, 2024, supported by strong trading volume
5. Current market price (1,973.6 INR) is considered overvalued by 47% compared to the calculated intrinsic value of 1,053.27 INR
6. Wall Street analysts have set an average 1-year price target of 1,932.01 INR, with a low forecast of 1,376.63 INR and a high forecast of 2,415 INR
Overall, while BLUESTARCO has shown some positive technical indicators and patterns, it's currently trading below its recent highs and is considered overvalued by some metrics. Investors should carefully consider these factors along with fundamental analysis before making any investment decisions.
#bls international #BLS PERFECT REVERSAL CANDIDATE
BLS International Services Ltd. (NSE: BLS) is currently exhibiting a **Neutral** technical outlook, with indicators suggesting neither strong bullish nor bearish momentum.
**Technical Indicators:**
- **Relative Strength Index (RSI):** The 14-day RSI stands at 35.13, indicating a neutral market sentiment. citeturn0search4
- **Moving Averages:** The stock is trading below its 5-day, 10-day, 20-day, and 50-day simple and exponential moving averages, suggesting a bearish trend. citeturn0search4
- **MACD (Moving Average Convergence Divergence):** The MACD value is -10.94, which is below the signal line, indicating a bearish momentum. citeturn0search4
- **Stochastic Oscillator:** The Stochastic Oscillator is at 16.70, suggesting a buy signal. citeturn0search4
**Support and Resistance Levels:**
- **Support:** The stock has support at ₹389.87. citeturn0search4
- **Resistance:** The resistance level is at ₹448.87. citeturn0search4
**Conclusion:**
BLS International Services Ltd. is currently in a neutral technical position, with indicators suggesting neither strong bullish nor bearish momentum. Investors should monitor these indicators closely, as a breakout above resistance levels could signal a bullish trend, while a drop below support levels might indicate a bearish move. It's advisable to consider these technical factors alongside fundamental analysis and broader market conditions when making investment decisions.

RELIANCE Levels 1 DayAs of December 28, 2024, Reliance Industries Limited (RELIANCE) closed at ₹1,221.05, reflecting a slight increase of 0.37% from the previous close.
For the upcoming trading sessions, the following support and resistance levels have been identified based on various technical analyses:
Daily Support and Resistance Levels:
Support Levels:
S1: ₹1,219.03
S2: ₹1,217.59
S3: ₹1,205.17
Resistance Levels:
R1: ₹1,229.93
R2: ₹1,232.88
R3: ₹1,237.87
These levels are derived from the previous trading day's price range and can serve as potential indicators for intraday trading strategies.
MUNAFASUTRA
Weekly Support and Resistance Levels:
Support Levels:
S1: ₹1,222.60
S2: ₹1,211.65
S3: ₹1,202.25
Resistance Levels:
R1: ₹1,232.00
R2: ₹1,242.95
R3: ₹1,252.35
These weekly levels provide a broader perspective for traders considering positions over multiple days.
Technical Indicators:
Relative Strength Index (RSI): 27 (indicating potential oversold conditions)
Moving Averages:
5-Day Average: ₹1,217.59
20-Day Average: ₹1,265.37
50-Day Average: ₹1,477.68
These indicators suggest that the stock is currently experiencing bearish momentum, with the RSI indicating potential oversold conditions.
Please note that support and resistance levels, along with technical indicators, are tools to assist in trading decisions and should be used in conjunction with other analyses and risk management strategies.

TATACONSUM Support & Resistance As of December 28, 2024, Tata Consumer Products Limited (TATACONSUM) closed at ₹925.40, reflecting a 2.65% increase from the previous close.
For the upcoming trading sessions, the following support and resistance levels have been identified based on various technical analyses:
Daily Support and Resistance Levels:
Support Levels:
S1: ₹902.05
S2: ₹903.19
Resistance Levels:
R1: ₹918.20
R2: ₹930.55
These levels are derived from recent trading data and can serve as potential indicators for intraday trading strategies.
Weekly Support and Resistance Levels:
Support Levels:
S1: ₹874.00
Resistance Levels:
R1: ₹1,060.00
These weekly levels provide a broader perspective for traders considering positions over multiple days.
Technical Indicators:
Relative Strength Index (RSI): 31.57 (Neutral)
Moving Averages:
5-Day Average: Data not available
20-Day Average: Data not available
50-Day Average: Data not available
These indicators suggest a neutral trend, with the RSI indicating neither overbought nor oversold conditions.
Please note that support and resistance levels, along with technical indicators, are tools to assist in trading decisions and should be used in conjunction with other analyses and risk management strategies.

Goin to BrokeWe are adopting a sell-side position on XAU/USD based on fundamental and technical analysis indicators that suggest potential downward movement in the pair.
Rationale:
Technical Indicators: Multiple technical indicators such as moving averages, RSI (Relative Strength Index), and MACD (Moving Average Convergence Divergence) are signaling overbought conditions or bearish crossovers, indicating a potential reversal.
Market Sentiment: There is a prevailing risk-on sentiment in the market, driving investors towards higher-yielding assets and away from safe-havens like gold, thereby pressuring the XAU/USD pair downwards.
Economic Data: Recent economic data releases, especially concerning inflation, interest rates, and geopolitical tensions, are favoring the US Dollar over gold, influencing our bearish outlook.
Strategy:
Entry Point: We plan to enter the sell trade around , which aligns with our technical analysis and risk management strategy.
Stop Loss: Our stop-loss order is placed at to limit potential losses in case the market moves against our position.
Take Profit: We aim to take profit at or based on the confirmation of technical indicators suggesting a reversal or a support level.

Patel Engineering Ltd (PATELENG) Long
Patel Engineering Ltd (PATELENG) :
Current Stock Performance
Current Price: ₹58.60
Day's Range: ₹57.80 - ₹59.40
52-Week Range: ₹31.45 - ₹66.95
Market Cap: ₹48.41 billion
Volatility: 2.61% with a beta of 2.79
Moving Averages
Patel Engineering's stock shows mixed signals across various moving averages:
MA5: Simple - ₹57.23, Exponential - ₹57.74 (Buy)
MA10: Simple & Exponential - ₹56.80 (Buy)
MA20: Simple - ₹54.85, Exponential - ₹55.35 (Buy)
MA50: Simple - ₹51.97, Exponential - ₹52.91 (Buy)
MA100: Simple - ₹47.53 (Buy)
Technical Indicators
Patel Engineering exhibits the following signals based on multiple technical indicators:
RSI (14): 62.13 (Buy)
Stochastic (9,6): 57.29 (Buy)
StochRSI (14): 80 (Overbought)
MACD (12,26): 3.75 (Buy)
ADX (14): 35.97 (Buy)
CCI (14): 159.24 (Buy)
Williams %R: -10.90 (Overbought)
ATR (14): 5.05 (High Volatility)
Highs/Lows (14): 10.31 (Buy)
Ultimate Oscillator: 56.68 (Buy)
ROC: 4.70 (Buy)
Bull/Bear Power (13): 19.42 (Buy)
Summary
The overall technical analysis for Patel Engineering indicates a strong buy signal. This assessment is based on a combination of moving averages and technical indicators, all suggesting a positive trend. Key indicators such as RSI, MACD, and ADX support a bullish outlook, while the stock has shown significant gains over the past year.
This technical analysis should be combined with additional research and consideration of other factors, such as market conditions and fundamental analysis, before making any investment decisions.
Please consult your financial advisor before investing
All research for educational purposes only.

BPCL Long Pick
Please consult your financial advisor before investing
All research for educational purposes only.
Here is a technical analysis of BPCL (Bharat Petroleum Corporation Ltd) as of May 2024:
Current Stock Performance
Current Price: ₹629.00
Day's Range: ₹607.20 - ₹623.50
52-Week Range: ₹331.45 - ₹687.95
Market Cap: ₹1.36 trillion
Volatility: 0.57% with a beta of 1.37
Moving Averages
BPCL's stock exhibits strong buy signals across various moving averages:
MA5: Simple - ₹616.23, Exponential - ₹617.74
MA10: Simple & Exponential - ₹612.80
MA20: Simple - ₹604.85, Exponential - ₹608.35
MA50: Simple - ₹598.97, Exponential - ₹601.91
MA100: Simple - ₹597.53
Technical Indicators
BPCL shows strong buy signals based on multiple technical indicators:
RSI (14): 72.13 (Buy)
Stochastic (9,6): 67.29 (Buy)
StochRSI (14): 100 (Overbought)
MACD (12,26): 5.75 (Buy)
ADX (14): 45.97 (Buy)
CCI (14): 159.24 (Buy)
Williams %R: -3.90 (Overbought)
ATR (14): 6.05 (High Volatility)
Highs/Lows (14): 10.31 (Buy)
Ultimate Oscillator: 56.68 (Buy)
ROC: 4.70 (Buy)
Bull/Bear Power (13): 19.42 (Buy)
Summary
Overall, the technical analysis for BPCL indicates a strong buy signal. This conclusion is based on the convergence of multiple moving averages and technical indicators all pointing towards a bullish trend. The stock's performance shows positive momentum, with several indicators such as RSI, MACD, and ADX suggesting strong buying conditions.
This analysis should be supplemented with additional research and consideration of other factors such as market conditions and fundamental analysis before making any investment decisions.

NIFTY's Volatility Compression for 5 Days - Strong Move ExpectedIn the dynamic world of stock markets, where fluctuations are the norm, NIFTY has recently exhibited a fascinating trend – a volatility compression for 5 days in a range of 20780 to 21050. Over the last five trading sessions, the NIFTY index has remained remarkably stable, fluctuating within a range of nearly 1%. This pattern, often associated with the strategies of volatility compression, has caught the attention of investors and analysts alike.
Nifty in Hourly Charts is expected to Bounce from the Ichimoku Outer Cloud, which is generally a good support in trend. In Hourly Charts as per the indicators Ichimoku, 50 Period Average and Range of less than 1% in last 5 trading sessions suggests a good move should come soon . One should trade with #CORD (Consistency, Rule Based and Disciplined) in any market situation.
Understanding Volatility Compression:
Volatility compression is a technical analysis concept popularized by Mark Minervini, a successful trader and author. This pattern is characterized by a decrease in the range of price movements over a specific period, creating a narrow trading range. Minervini emphasizes the significance of identifying such patterns as they often precede explosive price movements.
Key Characteristics of Volatility Compression:
Narrow Trading Range:
The most apparent characteristic of volatility compression is the tight trading range. In the case of NIFTY, the index has experienced minimal price fluctuations, staying within a range of less than 1% for five consecutive trading sessions.
Decreased Volatility:
Volatility, as measured by indicators like the Average True Range (ATR), tends to contract during the compression phase. Investors witness a decrease in the daily price swings, signaling a potential buildup of energy for a significant move in the near future.
Consolidation Phase:
Volatility compression often occurs during a consolidation phase, where the market is preparing for the next major directional move. This phase allows traders to identify key support and resistance levels, providing valuable insights into potential breakout points.
Analyzing NIFTY's Volatility Compression:
As we examine NIFTY's recent performance, the index has undeniably entered a phase of reduced volatility. Traders and analysts are closely monitoring this compression pattern, considering its potential implications for the market.
Technical Indicators:
Traditional technical indicators, such as Bollinger Bands and the Relative Strength Index (RSI), can be employed to gauge the compression's intensity. A contraction in Bollinger Band width and RSI hovering around neutral levels may signal a pending breakout.
Volume Analysis:
While observing the compression pattern, it is crucial to analyze trading volumes. Minervini suggests that low volume during the compression phase followed by a surge in volume during the breakout can validate the strength of the impending move.
Identifying Support and Resistance:
Traders utilizing the volatility compression pattern look to identify key support and resistance levels within the narrow trading range. These levels can serve as reference points for potential entry or exit positions.
Conclusion :
NIFTY's recent display of the volatility compression is a testament to the constant evolution of market dynamics. Investors and traders are keenly watching for signs of an imminent breakout, with the anticipation that the index will experience a substantial move in the near future.
As always, it is essential for market participants to exercise caution and conduct thorough research before making any trading decisions. The volatility compression pattern, while indicative of potential opportunities, does not guarantee specific outcomes. However, understanding and incorporating such patterns into one's analytical toolkit can provide valuable insights and enhance decision-making in the ever-changing landscape of financial markets.

Crude Oil on Fire ..Weekly bullish divergence seen 3 days beforeCrude oil bullish divergence is a valuable concept in technical analysis that can help traders identify potential trend reversals and make more informed trading decisions. This article will explore what bullish divergence is, how to spot it on crude oil price charts, and practical tips for incorporating it into your trading strategy.
Understanding Bullish Divergence:
Explain the concept of bullish divergence in detail, emphasizing how it occurs when the price of crude oil makes lower lows while the RSI indicator makes higher lows. Emphasize the importance of this pattern as a potential early signal for a trend reversal.
Identifying Bullish Divergence:
Provide step-by-step guidance on how to spot bullish divergence on crude oil price charts. Include annotated examples to illustrate the concept visually, making it easier for readers to understand and apply.
Confirming with Other Indicators:
Highlight the significance of using multiple indicators to confirm bullish divergence signals. Suggest pairing RSI with other technical indicators like Moving Averages, MACD, or Stochastic Oscillator to strengthen your analysis.
Timeframe Considerations:
Explain how the timeframe you choose can impact the significance of bullish divergence. Discuss the differences in signals and reliability between shorter-term and longer-term charts and how this may influence your trading approach.
Risk Management and Stop Loss:
Emphasize the importance of risk management when trading crude oil based on bullish divergence signals. Encourage readers to set appropriate stop-loss levels to protect their capital in case the trade doesn't play out as expected.
Fundamental Analysis:
Acknowledge that technical analysis, including bullish divergence, is just one piece of the puzzle. Encourage readers to also consider fundamental factors such as geopolitical events, supply and demand dynamics, and economic indicators that can affect crude oil prices.
Backtesting and Practice:
Suggest the use of backtesting to validate the effectiveness of the bullish divergence strategy over historical data. Encourage readers to practice on demo accounts before implementing the strategy with real money.
Real-Life Examples:
Share real-life examples of successful trades using bullish divergence in the crude oil market. This can help readers relate to the strategy and see its potential application in live trading scenarios.
Patience and Discipline:
Stress the importance of patience and discipline when trading based on bullish divergence. Remind readers not to rush into trades and to stick to their trading plan, avoiding emotional decisions.
Conclusion:
Summarize the key points of the article and reiterate the value of understanding and using bullish divergence in crude oil trading. Remind readers that mastering this powerful tool requires continuous learning, practice, and adaptability to changing market conditions.

Nitin Spinners Ltd Investment IdeaNitin Spinners Ltd, promoted by the Nolkha family of Bhilwara, is one of the leading manufacturers of cotton yarn, knitted fabrics, greige and finished woven fabrics and a Government of India-recognized export house. Established in 1992, NSL started operations with open end spinning with 384 rotors. Currently, the company has an integrated textile complex with over 3 lakh spindles, 3488 rotors, 63 knitted machines and 168 air jet weaving machines.
Product Portfolio
Nitin Spinners was incorporated in 1993 in Bhilwara as a small-scale unit with a capacity of only 384 rotors. Over the years, Nitin Spinners has expanded the operations to include open end yarns, multi-fold open end yarns, ring spun combed yarns, multi-fold ring spun yarns, compact yarns, fancy slub yarns, core spun yarns, S and Z twist yarns, dyeable cheese cones and organic cotton yarns and blends. Their product range in knitted fabrics include single jersey, pique structures, inter-lock structures, rib structures and three thread fleeces.
Capacities
Nitin Spinners has an installed capacity of 2,23,056 Spindles and 2,936 Rotors, producing 50,000 tons of yarn per annum. No of installed spindles between FY16 to FY21 increased by 2x. No of installed rotors & knitting machines between FY16 to FY21 increased by 1.2x & 1.3x respectively. As of FY21 it has 168 looms for Woven fabrics and processed woven fabrics with dyeing, finishing & printing capacity of 30 mn MTS/PA. Thus, increasing contribution of value-added products going forward.
Clients
The customer base of the company is diversified with top ten customers accounting for only 16% of the total income of the company in FY21 (PY: 18%), with each customer having less than 5% share of the total income. NSL supplies its products to some of the renowned brands like Raymond, Donear, D’Decor, Siyaram’s, Welspun etc in domestic market and Zara, United Colors of Benetton, Hennes & Mauritz (H&M), Marco Polo in the international market. The company enjoys good relationship with these customers and receives repeat orders from them. As on December 31, 2021, the company had nearly 2.5-3 months of orders on hand.
FY21 Revenue Break-up
Growing contribution of Value-added products.
-Yarn: 68% (FY20 73%)
-Woven Fabrics: 15% (FY20: 9%)
-Knitted Fabrics: 11% (FY20: 11%)
-Others: 6% (FY20: 7%)
FY21 Revenue Geography-wise
-Export: 63% (FY20: 55%)
-Domestic: 37% (FY20: 45%)
Capex
Capex done in 2020
Integrated Textiles Complex at Begun, Chittorgarh, by setting up 76,992 Spindles for manufacturing Cotton & Blended Yarns.
552 Rotors for Blended Open end Yarn.
168 Air-Jet Weaving Machines along with facilities for Dyeing, Printing & Finishing of Fabrics.
Fresh capex of 950 cr. announced in December 2021 which should finish in 20 months with additional capacity in spinning (from 75'000 TPA to 110'000 TPA), knitted fabrics (from 8'500 to 11'000 TPA) and woven fabrics (from 30 to 40 million m/pa).
On January 2022, ICRA reaffirmed Nitin Spinners Ltd’s ratings as stable. Following are the excerpts from the credit rating report: -
Key Rating Strengths
Experience of promoters in the textile industry - NSL was promoted by the Nolkha family in 1992. Mr. R. L. Nolkha, Chairman, has an experience of over four decades in the textile industry. At present, he is also the Vice Chairman of Confederation of Textile Industries (CITI) and a member of the Board of Governors of Textile Skill Development Council. Mr Dinesh Nolkha, Managing Director, has around three decades of industrial experience and handles yarn marketing, finance and general administration. He is also Chairman of Northern India Textile Research Association (NITRA) and a committee member of Rajasthan Textile Mills Association (RTMA). Mr Nitin Nolkha, Joint Managing Director, has around two decades of industrial experience, and looks after marketing of fabrics, procurement of materials and implementation of projects.
Long and established track record with integrated nature of operations in textile industry - NSL has a track record of around three decades of operation in the Indian textile industry. The company has presence in more than 60 countries globally, deriving more than half of revenue from exports. Further, NSL is continuously investing in the latest technologies, resulting in delivering quality products. Furthermore, NSL has various accreditations pertaining to quality management (ISO 9001:2015), energy management (ISO 50001), environmental management (ISO 14001: 2015) and occupational health and safety management (OHSAS 18001). As a part of value addition and widening of its product range, the company has set up an integrated textile complex at Begun (District: Chittorgarh, State: Rajasthan) equipped with modern spinning, weaving, dyeing, finishing and printing facilities along with compliance with pollution control norms. NSL’s plant is capable of producing wide range of yarn as per the market demand. Furthermore, the company has also set up a 10.5 MW thermal power plant and 8.5 MW rooftop solar power plant for captive consumption ensuring consistent power supply. Moreover, the company is also planning to set-up another 6 MW rooftop solar power plant over a period of next 2 years to reduce its power & fuel cost.
diversified product profile with large share of revenue contributed by cotton yarn - NSL is engaged in manufacturing of wide variety of cotton yarn, knitted fabrics and finished woven fabrics. Cotton yarn accounts for most of the revenue generated by the company registering around 68% of the sales in FY21 and H1FY22 (FY20: 73%) followed by woven and knitted fabrics. NSL is continuously focusing on providing value added products to its customers. It provides wide range of yarn to meet its customer requirement both for woven fabric and knitted fabric.
Healthy growth in TOI (Total Operating Income) along with significant improvement in its profitability - during H1FY22 NSL’s TOI grew by 88% on y-o-y basis and stood at Rs.1,219 crore during H1FY22 largely due to significant improvement in the average sales realization of cotton yarn and knitted fabrics amidst strong export demand. It was also aided by the lower base of H1FY21 which was impacted adversely by the first wave of Covid-19 pandemic. The company has witnessed healthy growth in its export revenue as it earned 73% of its revenue from export market during H1FY22 as compared to 63% in FY21 and 54% in FY20. The sales realization of cotton yarn and knitted fabric improved by 41% and 40% respectively during H1FY22 as compared to FY21. PBILDT (profit before interest, lease, depreciation and tax) margin of the company also witnessed significant improvement by nearly 1,300 bps and 900 bps to 25% during H1FY22 as compared to H1FY21 and FY21 respectively on account of sizable jump in the spread between cotton and cotton yarn along with improved operating efficiency led by better capacity utilization. With healthy growth in scale of operation coupled with improved profitability margin, the gross cash accruals (GCA) of NSL grew by 293% on y-o-y basis and stood at Rs.197 crore during H1FY22.
Improvement in leverage and debt coverage indicators during H1FY22 - The capital structure of NSL marked by overall gearing and TOL/TNW (Total Outside Liability to Total Net Worth) improved and stood at a moderate 1.05 times and 1.35 times respectively as on September 30, 2021 as compared to 1.71 times and 1.88 times respectively as on March 31, 2021 backed by healthy accretion of profit to reserves coupled with reduction in total debt level. Debt level of the company stood at Rs.734 crore as on September 30, 2021 as compared to Rs.962 crore as on March 31, 2021 primarily due to scheduled repayment of term debt coupled with lower utilization of working capital utilization as on even date in light of healthy cash accruals during H1FY22. With improvement in profitability, the debt coverage indicators also improved marked by PBILDT interest coverage and Total Debt/PBILDT of 11.02 times and 1.20 times respectively in H1FY22 as compared to 4.20 times and 3.72 times respectively in FY21. However, the capital structure and debt coverage indicators are again expected to deteriorate marginally in the medium term due to the planned large size debt-funded expansion project and expectation of higher utilization of its working capital limits considering envisaged internal accruals to be deployed for capex. Further, post commissioning of project, the company would also require additional working capital borrowing to fund its incremental working capital requirement which may also lead to some moderation in capital structure and debt coverage indicators.
Key Rating Weaknesses
Implementation and saleability risk associated with large size proposed debt funded capex - NSL has planned to enhance its capacity through brownfield expansion at its existing location in Rajasthan with acquisition of land adjacent to its existing plant, as company is currently running at optimum utilization of its existing capacities. The capacity addition is also proposed to meet increasing demand, penetrate newer geographies, aid widening of product portfolio and to bring competitive cost advantage by having economies of scale. The estimated cost of the project is Rs.950 crore (1.35 times of tangible net-worth as on September 30, 2021) which is to be funded through term loan of Rs.650 crore and remaining through internal accruals translating into project debt-equity ratio of 2.16:1 times. NSL has envisaged to complete the project in phase-wise manner over a period of next 20-24 months. Phase-I of the proposed capex is expected to commence from September 2023 (i.e. Q2FY24) and project is expected to be fully commissioned fully from FY25 onwards. As informed by the management, the financial closure of the project is yet to be achieved. The company is envisaging to avail term debt of Rs.650 crore for a door-to-door tenor of around 9 years (including implementation and moratorium period) along with expected benefits of interest subsidy. However, due to the large debt-funded expansion project and expectation of higher utilization of its working capital limits, the leverage and debt coverage indicators of the company are expected to remain at an elevated level, contrary to earlier expectation of improvement. Furthermore, such large size projects are susceptible to inherent implementation risks and consequently any delay in execution of the project may result in cost overrun and impact the currently envisaged timelines for cash flow generation. Apart from that, demand for cotton yarn is driven by international demand-supply dynamics and susceptible to economic cycles. Historically, the textile industry has witnessed high cyclicality wherein demand shoots up and then falls rapidly. Hence, there is a salability risk associated with the project in case of sudden drop in demand which may adversely impact the credit profile of the company. Timely completion of the project within envisaged cost parameters and realization of envisaged benefit therefrom would be a key rating sensitivity.
Susceptibility to volatility in the raw material prices and foreign exchange rate fluctuations - The basic raw material consumed by NSL to produce yarn is raw cotton, which accounts for more than 90% of the total cost of production. The prices of raw cotton are volatile in nature and depends upon factors like area under production, yield for the year, vagaries of the monsoon, international demand-supply scenario, inventory carry forward from the previous year and minimum support price (MSP) decided by the government. Prices of raw cotton have been volatile over last couple of years, which translates into risk of inventory losses for the industry players; albeit at times it also leads to inventory gains. Collectively, these factors along with intense competition in the industry contribute to low bargaining power of yarn manufacturers and volatility in profitability. Further, NSL is also exposed to foreign currency rate fluctuation as the company derives significant portion of its revenue from the export market (exports accounted for 73% of the total revenue in H1FY22 and 63% in FY21). Thus, profitability margins of the company remain susceptible to any adverse movement in the foreign currency. However, the company has a policy to hedge its foreign currency exposure through forward contracts mitigating the forex exposure to an extent.
Presence in fragmented, cyclical and competitive textile industry - NSL operates in a cyclical and fragmented textile industry marked by presence of many organised as well as unorganised players leading to high competition in the industry. Apart from competition, the relatively commoditized nature of cotton yarn also limits the pricing ability of the industry players to an extent. Further, textile industry is inherently cyclical in nature and closely follows the macroeconomic business cycles. The prices of raw materials and finished goods are also determined by global demand-supply scenario, hence any shift in macroeconomic environment globally also impacts the domestic textile industry.
Liquidity: Adequate
The liquidity of NSL remains adequate backed by healthy cash accruals and cash flow from operation apart from cushion in the form of undrawn working capital limits. Further, the liquidity of the company is envisaged to remain adequate on account of expected healthy GCA as against relatively moderate debt repayment obligation over the next one year. Furthermore, the cash accruals are likely to remain adequate to fund its proposed capex. Moreover, its current ratio improved to 1.58 times as on September 30, 2021 as compared to 1.27 times as on March 31, 2021. The average utilization of its working capital limits stood moderate at 64% for trailing six months ended November 2021.
In October 2021, SEBI warned the company over violation in company's RPT policy in relation to Regulation 23 of the SEBI LODR regulations (2015).
Financial information : -
Ten year CAGR sales and profit at 20% and 101%.
Five year CAGR sales and profit at 24% and 42%.
TTM sales growth at 66% and TTM profit growth at 380%.
Average Roe for last 10 years at 22%, last five years at 21% and for last three years it has been 24%.
Debt to equity at 0.79 (less than 1 is good), Interest Coverage at 10.2 (greater than 3 is good), Current ratio at 1.83 (greater than 1.5 is good).
Debtor days improved to 33 in March 2022 from 39 in March 2020.
Promoter holding increased from 55.82 in December 2019 to 56.25 in December 2021.
FII stake increased from 1.23 in June 2021 to 4.84 in March 2022.
On the chart I have tried to pinpoint the confluence of multiple supports and resistances as demand zones. These demand zones can prove to be good areas to accumulate this stock but prices can go down below these support levels too and stay there for many months. Buy at your own risk. One will do good if he/she can find the demand zones with at least three supports and three resistances and buy there. 200 week moving average also acts as a good support.
Disclaimer: I am not SEBI Registered. Do trade or invest at your own risk, I am not responsible for any losses and won't claim anything from your profits either. Take financial advices from your advisors before jumping in.

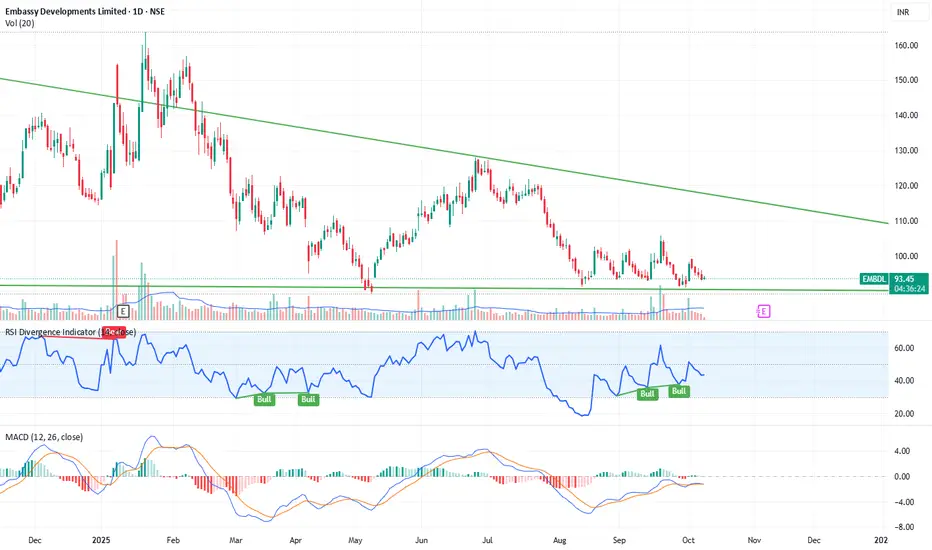
Embassy Developments Stock Analysis: Bullish Reversal in Sight? This chart of Embassy Developments Limited (EMBDL) showcases a potential shift in momentum, signaling a bullish reversal from its recent downtrend. Here's a closer look at the technical indicators:
Trend Analysis:
The stock is testing a support level around ₹93.50, which has held in the past, suggesting potential for a bullish bounce.
The price is currently near a descending resistance line, showing that the stock is facing pressure but also indicating a potential breakout opportunity once it clears this resistance.
RSI (Relative Strength Index):
The RSI has been oscillating between the 40 and 60 mark, reflecting periods of overbought and oversold conditions.
Recently, the RSI has moved towards bullish territory, indicating growing buying interest. The last signals (green “Bull” labels) show positive momentum, which could suggest the start of an upward move.
MACD (Moving Average Convergence Divergence):
The MACD indicator is showing signs of bullish crossover, with the MACD line (orange) crossing above the signal line (blue), suggesting potential upward momentum in the near future.
The histogram also indicates that the bullish momentum is increasing, further confirming a possible trend reversal.
Key Points to Watch:
Support Zone: The stock is approaching a critical support level near ₹93.50. A bounce from this level could indicate a bullish trend continuation.
Breakout Opportunity: The price is testing the downward resistance trendline. A breakout above this level could trigger a strong upward move towards previous resistance levels around ₹110-115.
RSI & MACD Confirmation: The indicators show growing bullish momentum. A continued increase in RSI above 50 and a sustained positive MACD could confirm a bullish shift in the stock's direction.
Conclusion for Study :
This chart offers an example of how to analyze a stock’s price action, momentum, and trend through RSI, MACD, and support/resistance levels. Understanding how these indicators interact can help in forming strategies for potential entry or exit points in real-time trading scenarios.
This analysis is purely for educational purposes and should be viewed as a study of the stock's technicals.
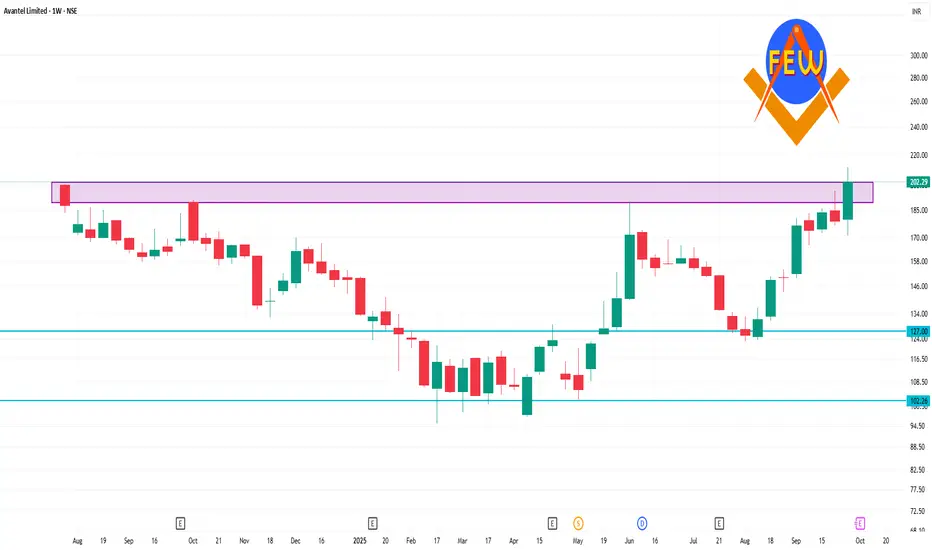
AVANTEL 1 Week Time Frame📈 Price Performance (1 Week)
Current Price: ₹202.29
Weekly Change: +11.61%
52-Week Range: ₹95.51 – ₹211.79
📊 Technical Indicators
Moving Averages
20-Day EMA: ₹173.47
50-Day EMA: ₹160.46
100-Day EMA: ₹151.62
200-Day EMA: ₹144.58
Current Price vs. EMAs: The current price is above all major EMAs, indicating a bullish trend.
Relative Strength Index (RSI)
14-Day RSI: 59.26
Interpretation: The RSI is in the neutral zone (50–70), suggesting neither overbought nor oversold conditions.
Moving Average Convergence Divergence (MACD)
MACD Value: 9.44
Signal: Positive MACD indicates upward momentum.
Stochastic RSI
Value: 53.95
Interpretation: Neutral, with no immediate overbought or oversold signals.
🔍 Summary
Trend: Bullish
Indicators: Most technical indicators are aligned with a positive outlook.
Resistance Levels: ₹211.79 (52-week high)
Support Levels: ₹173.47 (20-day EMA)
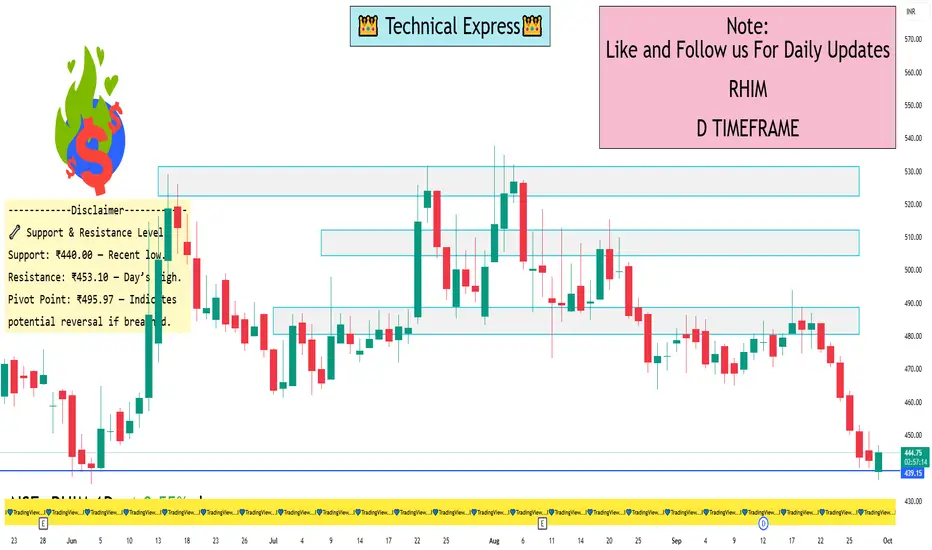
RHIM 1 Day View📊 Technical Overview
Current Price: ₹445.00
Day’s Range: ₹440.00 – ₹453.10
Previous Close: ₹451.45
52-Week Range: ₹376.45 – ₹640.00
🔻 Bearish Indicators
RSI (14): 24.86 — Oversold condition, suggesting potential for a rebound.
MACD: -7.80 — Indicates downward momentum.
Moving Averages:
5-day: ₹444.48 — Slightly above current price.
50-day: ₹469.06 — Bearish crossover.
200-day: ₹478.22 — Further confirmation of downtrend.
Technical Indicators: Strong Sell signals across multiple platforms.
🔧 Support & Resistance Levels
Support: ₹440.00 — Recent low.
Resistance: ₹453.10 — Day’s high.
Pivot Point: ₹495.97 — Indicates potential reversal if breached.
⚠️ Summary
RHI Magnesita India Ltd is currently in a downtrend, with technical indicators signaling a strong sell. The stock is approaching key support levels, and while it is oversold, caution is advised. Traders should monitor for any bullish reversal patterns or volume spikes before considering entry points.
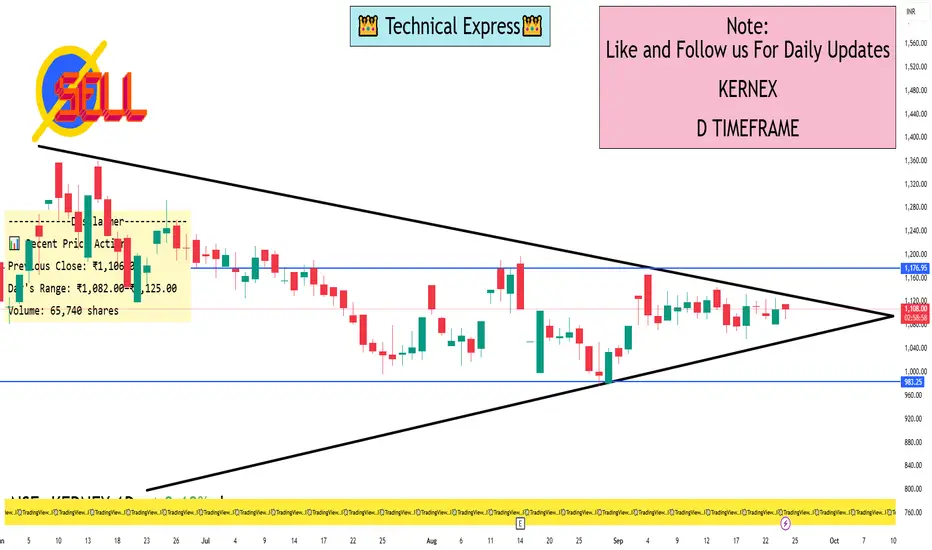
KERNEX 1 Day View📈 Technical Indicators (Daily Time Frame)
Overall Signal: Strong Buy
Moving Averages:
5-day: ₹1,113.28 (Sell)
50-day: ₹1,099.71 (Buy)
200-day: ₹1,087.01 (Buy)
Fibonacci Pivot Point: ₹1,114.13
Relative Strength Index (RSI): 52.5 — Neutral
MACD: +2.82 — Bullish
Technical Indicators: 3 Buy, 2 Sell
These indicators suggest a continuation of the current upward momentum, though the neutral RSI indicates caution against overbought conditions.
📊 Recent Price Action
The stock closed at ₹1,106.00 on September 23, 2025, marking a 0.89% increase from the previous day. The day's range was ₹1,082.00–₹1,125.00, with a volume of 65,740 shares.
🔮 Price Forecast
Short-term forecasts suggest a potential pullback to ₹1,075.70, possibly due to profit-taking or market consolidation.
📌 Conclusion
Kernex Microsystems India Ltd is currently in a strong bullish phase on the daily chart, supported by favorable moving averages and MACD. However, the neutral RSI and short-term price forecasts indicate a need for caution. Investors should monitor for any signs of reversal or consolidation before making further decisions.
SBI (Weekly) - Breakout of sideways trendState Bank of India (SBI) has shown a significant bullish development this week, decisively breaking out of a key angular resistance trendline that has been in place since July 2024. This breakout, which follows a prolonged consolidation phase after its All-Time High in June 2024, was confirmed by a strong +4.71% price increase on the back of massive trading volume.
Confirmation from Multiple Indicators 👍
The positive outlook is strongly supported by several technical signals, suggesting a high degree of conviction in the recent move:
- Volume Surge: The breakout was accompanied by exceptionally high volume , indicating significant buying interest. The general trend of rising volume further validates the move.
- Momentum Indicators: Both the short-term Exponential Moving Averages (EMAs) and the Relative Strength Index (RSI) have entered a state of positive crossover, providing dual confirmation of building bullish momentum.
Outlook
Given the strength of the breakout and the confluence of bullish indicators, the path of least resistance appears to be upward. However, monitoring the price action in the upcoming week will be crucial to confirm that this breakout is sustained and not a false move.
