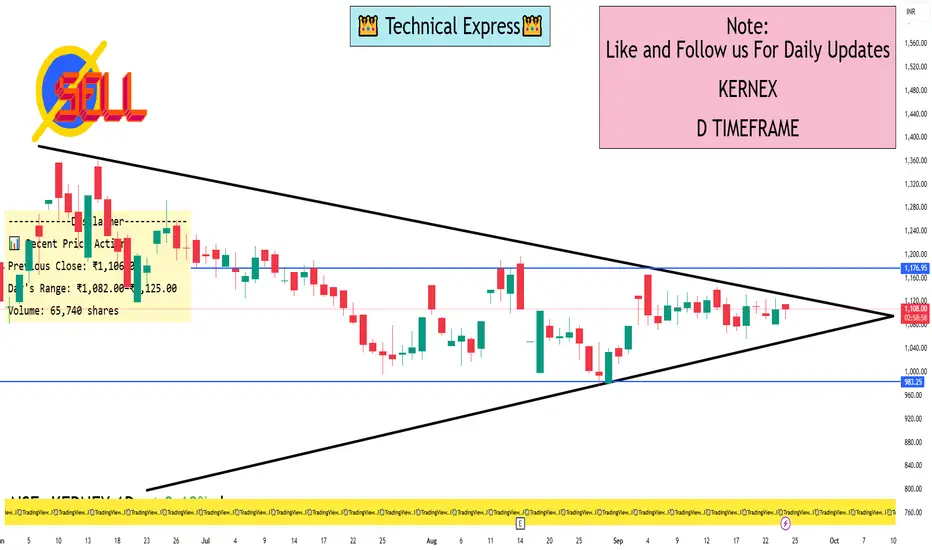
"KERNEX Microsystems"HELLO! I'm sharing Kernex microsystems chart where it formed a "W" on day time frame "LINE CHART", so if on Monday i.e. 24/8/2026 price opens flat 1970 above a proper 15min candle closes then we will see a upmove till 2060-2080/2168 levels and if price anytime falls below 1890 and for safe traders
Kernex Microsystems India Ltd.
No trades
No trades
Peers for comparison
113.5 INR
883.36 M INR
4.30 B INR
10.99 M
Company info
Sector
Industry
CEO
Sree Lakshmi Manthena
Website
Headquarters
Hyderabad
Founded
1991
IPO date
Dec 20, 2005
ISIN
INE202H01019
FIGI
BBG000C0G9B6
Identifiers
ISIN INE202H01019
Kernex Microsystems India Ltd. engages in the manufacture and sale of safety systems and software services for railways. Its products include TrainSHIELD, ACD, LxGuard, SAFELx, CASRY, ATRW, and KTPIS. The company was founded in September 16, 1991 and is headquartered in Hyderabad, India.
KERNEX: Weekly Macro Breakout & Earnings Momentum1. The Macro Perspective: The Multi-Month Accumulation Base
I am taking a LONG bias on Kernex Microsystems India Ltd. (KERNEX) on the macro weekly (1W) timeframe.
When analyzing pure market structure on a railway technology and signaling leader, prolonged accumulation bases are critical for initiati
KERNEX (Weekly Chart)1. Primary Trend Analysis
The stock is in a strong long-term uptrend.
Evidence:
Price is making higher highs and higher lows.
Weekly candles are trading above both major moving averages.
Rising trendline from 2024 continues to act as dynamic support.
Conclusion: Long-term trend remains bullish.
BUY TODAY SELL TOMORROW for 5% DON’T HAVE TIME TO MANAGE YOUR TRADES?
- Take BTST trades at 3:25 pm every day
- Try to exit by taking 4-7% profit of each trade
- SL can also be maintained as closing below the low of the breakout candle
Now, why do I prefer BTST over swing trades? The primary reason is that I have observed t
Kernex Microsystems (India) Ltd : Symmetric Triangle Breakout
The chart is daily chart of Kernex Microsystems (India) Ltd .
Kernex Microsystems (India) Ltd was in a consolidation since last 9 to 10 months. The price was hovering around 200 DMA.
On 14th of Oct the price came out of the narrow range with 10 % up move. The volume is also supporting the move.
BUY TODAY SELL TOMORROW for 5%DON’T HAVE TIME TO MANAGE YOUR TRADES?
- Take BTST trades at 3:25 pm every day
- Try to exit by taking 4-7% profit of each trade
- SL can also be maintained as closing below the low of the breakout candle
Now, why do I prefer BTST over swing trades? The primary reason is that I have observed that
KERNEX 1 Day View📈 Technical Indicators (Daily Time Frame)
Overall Signal: Strong Buy
Moving Averages:
5-day: ₹1,113.28 (Sell)
50-day: ₹1,099.71 (Buy)
200-day: ₹1,087.01 (Buy)
Fibonacci Pivot Point: ₹1,114.13
Relative Strength Index (RSI): 52.5 — Neutral
MACD: +2.82 — Bullish
Technical Indicators: 3 Buy, 2
Kernex Microsys (KERNEX) Short term (6 to 12month) HoldingSL Weekly candle close only, Target Trigger Price
All detail for chat. good entry at mark price only. and must stoploss minimum risk and good profit. risk ratio 1:1 to manage modified SL. This is not call, Just my idea. Please understand your risk and take full responsibility of your actions
See all ideas
Summarizing what the indicators are suggesting.
Oscillators
Neutral
Oscillators
Neutral
Summary
Neutral
Summary
Neutral
Summary
Neutral
Moving Averages
Neutral
Moving Averages
Neutral
Displays a symbol's price movements over previous years to identify recurring trends.
Frequently asked questions
Today, KERNEX trades at 1,698.5 INR.
For broader market analysis, dive into the technicals on the Kernex Microsystems India Ltd. stock price chart and read the latest KERNEX news:
– Kernex Microsystems (India) Ltd Gets Order Worth 318.7 Million Rupees
– Kernex Microsystems (India) Ltd Says June-Quarter Consol Net Profit 1.10 Billion Rupees
– Kernex Microsystems Says Successful Commissioning Of Kavach System On North Central Railway
For broader market analysis, dive into the technicals on the Kernex Microsystems India Ltd. stock price chart and read the latest KERNEX news:
– Kernex Microsystems (India) Ltd Gets Order Worth 318.7 Million Rupees
– Kernex Microsystems (India) Ltd Says June-Quarter Consol Net Profit 1.10 Billion Rupees
– Kernex Microsystems Says Successful Commissioning Of Kavach System On North Central Railway
Markets don't sleep, here's what's going on with KERNEX at the moment:
– Kernex Microsystems (India) Ltd Gets Order Worth 318.7 Million Rupees
– Kernex Microsystems (India) Ltd Says June-Quarter Consol Net Profit 1.10 Billion Rupees
– Kernex Microsystems Says Successful Commissioning Of Kavach System On North Central Railway
See more updates in real-time with our News Flow.
– Kernex Microsystems (India) Ltd Gets Order Worth 318.7 Million Rupees
– Kernex Microsystems (India) Ltd Says June-Quarter Consol Net Profit 1.10 Billion Rupees
– Kernex Microsystems Says Successful Commissioning Of Kavach System On North Central Railway
See more updates in real-time with our News Flow.
KERNEX stock is 4.48% volatile and has beta coefficient of 1.79.
What it means:
– Volatility: Shows how much the price fluctuates over time
– Beta > 1: More volatile than the market
– Beta < 1: Less volatile, more stable
Important to know:
– Volatility can increase during earnings, news events, or market stress
– Large-cap stocks like KERNEX are typically less volatile than smaller companies
Track every detail on Kernex Microsystems India Ltd. stock chart and check out the list of the most volatile stocks — is Kernex Microsystems India Ltd. there?
What it means:
– Volatility: Shows how much the price fluctuates over time
– Beta > 1: More volatile than the market
– Beta < 1: Less volatile, more stable
Important to know:
– Volatility can increase during earnings, news events, or market stress
– Large-cap stocks like KERNEX are typically less volatile than smaller companies
Track every detail on Kernex Microsystems India Ltd. stock chart and check out the list of the most volatile stocks — is Kernex Microsystems India Ltd. there?
To understand the KERNEX stock performance, it's worth checking price changes for various periods to get the full picture:
– 1 day — −2.96%
– 1 week — +4.72%
– 1 month — −3.21%
KERNEX all-time low was 10.6 INR (Mar 25, 2020), and its highest price is 2,580.0 INR (Aug 6, 2026). Find more dynamics in the Stock Heatmap and on the Kernex Microsystems India Ltd. stock chart.
– 1 day — −2.96%
– 1 week — +4.72%
– 1 month — −3.21%
KERNEX all-time low was 10.6 INR (Mar 25, 2020), and its highest price is 2,580.0 INR (Aug 6, 2026). Find more dynamics in the Stock Heatmap and on the Kernex Microsystems India Ltd. stock chart.
Kernex Microsystems India Ltd. market capitalization is 28.50 B, representing the total value of all its outstanding shares (price × shares outstanding).
What it means:
– Market cap is one of the key ways to classify companies (large-cap, mid-cap, etc.)
– It reflects how investors value the company today
– It changes constantly with stock price movements
What to look at next:
– Market cap trends: Rising cap may signal growth and investor confidence; falling cap can reflect risk or downturns
– Price vs shares: Changes can come from Kernex Microsystems India Ltd. stock price moves or share count (buybacks, issuance)
– Valuation ratios: Compare market cap with revenue and earnings
– Peer comparison: See how Kernex Microsystems India Ltd. stacks up against other companies
What it means:
– Market cap is one of the key ways to classify companies (large-cap, mid-cap, etc.)
– It reflects how investors value the company today
– It changes constantly with stock price movements
What to look at next:
– Market cap trends: Rising cap may signal growth and investor confidence; falling cap can reflect risk or downturns
– Price vs shares: Changes can come from Kernex Microsystems India Ltd. stock price moves or share count (buybacks, issuance)
– Valuation ratios: Compare market cap with revenue and earnings
– Peer comparison: See how Kernex Microsystems India Ltd. stacks up against other companies
The safest way to buy Kernex Microsystems India Ltd. stocks is through a reliable broker. Create an account, fund it, and place a buy order.
You can trade KERNEX directly from TradingView:
– Choose a broker: Explore our supported trading partners and pick one that fits your needs
– Compare options: View available brokers side by side to evaluate fees and features
– Connect your account: Open Supercharts, click “Trade”, select your broker, and log in
– Start trading: Place orders without leaving the chart
Tip: If you’re new to trading, try paper trading first — it lets you practice strategies in real market conditions without risking funds.
You can trade KERNEX directly from TradingView:
– Choose a broker: Explore our supported trading partners and pick one that fits your needs
– Compare options: View available brokers side by side to evaluate fees and features
– Connect your account: Open Supercharts, click “Trade”, select your broker, and log in
– Start trading: Place orders without leaving the chart
Tip: If you’re new to trading, try paper trading first — it lets you practice strategies in real market conditions without risking funds.
As of Nov 8, 2026, the company has 609 employees.
Why traders follow this data:
– Company scale: Employee count reflects the size and global reach of the business
– Operational footprint: Higher headcount often indicates broader product lines, retail presence, or services
– Trend signal: Changes over time can reflect hiring growth, restructuring, or efficiency improvements
See our rating of the largest employers to find more opportunities.
Why traders follow this data:
– Company scale: Employee count reflects the size and global reach of the business
– Operational footprint: Higher headcount often indicates broader product lines, retail presence, or services
– Trend signal: Changes over time can reflect hiring growth, restructuring, or efficiency improvements
See our rating of the largest employers to find more opportunities.
Investing in Kernex Microsystems India Ltd. depends on your goals, risk tolerance, and market conditions. It’s essential to analyze the stock before making a decision.
First, study Kernex Microsystems India Ltd. financials and track their dynamics on the Fundamental Graphs:
– Business fundamentals: Revenue, earnings, and growth trends
– Valuation: P/E ratio, market cap, and how it compares to peers
– Profitability: Margins, return on equity, and cash flow
– Dividends (if any): Yield, payout ratio, and consistency
Then explore our KERNEX technicals – signals based on essential indicators calculations:
– Today — neutral
– 1-week — neutral
– 1-month — strong buy
Combine fundamental and technical analysis for better results.
First, study Kernex Microsystems India Ltd. financials and track their dynamics on the Fundamental Graphs:
– Business fundamentals: Revenue, earnings, and growth trends
– Valuation: P/E ratio, market cap, and how it compares to peers
– Profitability: Margins, return on equity, and cash flow
– Dividends (if any): Yield, payout ratio, and consistency
Then explore our KERNEX technicals – signals based on essential indicators calculations:
– Today — neutral
– 1-week — neutral
– 1-month — strong buy
Combine fundamental and technical analysis for better results.
Kernex Microsystems India Ltd. stock ticker depends on the exchange where it’s listed. On the NSE, its primary exchange, Kernex Microsystems India Ltd. stocks trade under the symbol KERNEX.
About tickers:
– Unique identifiers: A ticker is a short code used to find and trade a stock
– Exchange-specific: The same company may have different tickers across exchanges
– Search shortcut: Used on trading platforms, charts, and screeners
Remember:
– Some companies have multiple listings
– Always check the exchange prefix to avoid confusion
Learn how to find your desired assets in our Symbol Search.
About tickers:
– Unique identifiers: A ticker is a short code used to find and trade a stock
– Exchange-specific: The same company may have different tickers across exchanges
– Search shortcut: Used on trading platforms, charts, and screeners
Remember:
– Some companies have multiple listings
– Always check the exchange prefix to avoid confusion
Learn how to find your desired assets in our Symbol Search.
Yes, you can track Kernex Microsystems India Ltd. financials in yearly and quarterly reports right on TradingView.
Use our Earnings Calendar to never miss important releases and spot opportunities early.
KERNEX net income for the last quarter is 1.10 B INR, while the quarter before that showed 682.56 M INR of net income which accounts for 60.93% change.
How to read this data:
– Track changes: Compare net income across quarters to spot trends
– Watch expectations: Compare with estimates to gauge performance
– Check margins: Net income reflects profitability after all expenses
– Look beyond one quarter: Consistency matters more than a single result
Follow other essential metrics in Kernex Microsystems India Ltd. financials:
– Revenue: Overall business growth
– Earnings per share: Rising EPS over time often points to improving business performance
– Margins (gross, operating): Efficiency and cost control
How to read this data:
– Track changes: Compare net income across quarters to spot trends
– Watch expectations: Compare with estimates to gauge performance
– Check margins: Net income reflects profitability after all expenses
– Look beyond one quarter: Consistency matters more than a single result
Follow other essential metrics in Kernex Microsystems India Ltd. financials:
– Revenue: Overall business growth
– Earnings per share: Rising EPS over time often points to improving business performance
– Margins (gross, operating): Efficiency and cost control
No, Kernex Microsystems India Ltd. does not currently pay dividends to its shareholders.
Instead of distributing profits as cash payments, the company may choose to reinvest earnings back into the business — for example, in growth, innovation, acquisitions, or debt reduction.
What to consider instead:
– Earnings growth: Is the company increasing profitability over time?
– Revenue expansion: Is the business scaling its operations?
– Free cash flow: Does it generate enough cash to potentially support future dividends?
– Share buybacks: Some companies return capital through repurchasing shares instead of dividends
Instead of distributing profits as cash payments, the company may choose to reinvest earnings back into the business — for example, in growth, innovation, acquisitions, or debt reduction.
What to consider instead:
– Earnings growth: Is the company increasing profitability over time?
– Revenue expansion: Is the business scaling its operations?
– Free cash flow: Does it generate enough cash to potentially support future dividends?
– Share buybacks: Some companies return capital through repurchasing shares instead of dividends
KERNEX reached its all-time high of 2,580.0 INR on Aug 6, 2026. Its all-time low was 10.6 INR and was reached on Mar 25, 2020.
Explore the Kernex Microsystems India Ltd. stock price chart to see more price history, and discover companies reaching new all-time highs and lows.
Kernex Microsystems India Ltd. EBITDA is 2.99 B INR, with an EBITDA margin of 34.58%.
EBITDA is a measure of core operating performance, showing how much profit the company generates from its main business activities before accounting for financing and accounting-related costs.
What it means:
– Operating strength: Helps assess profitability from core operations
– Efficiency signal: Rising EBITDA often reflects improving business performance
– Comparability: Useful for comparing companies with different capital structures
What to look at next in Kernex Microsystems India Ltd. statements:
– Revenue growth: Shows whether the business is expanding
– Net income: Captures full profitability after all expenses
– Free cash flow: Shows actual cash generated
– Debt levels: Important when evaluating earnings quality
EBITDA is a measure of core operating performance, showing how much profit the company generates from its main business activities before accounting for financing and accounting-related costs.
What it means:
– Operating strength: Helps assess profitability from core operations
– Efficiency signal: Rising EBITDA often reflects improving business performance
– Comparability: Useful for comparing companies with different capital structures
What to look at next in Kernex Microsystems India Ltd. statements:
– Revenue growth: Shows whether the business is expanding
– Net income: Captures full profitability after all expenses
– Free cash flow: Shows actual cash generated
– Debt levels: Important when evaluating earnings quality