EUR/CHF Technical Outlook – Potential Bullish Reversal Setup📈 Pair: EUR/CHF
📆 Date: May 27, 2025
📊 Timeframe: Daily (D1)
📌 Technical Highlights:
🔹 Current Price: 0.93456
🔹 Key Indicators:
50 EMA (Red): 0.93824
200 EMA (Blue): 0.94342
🧠 Chart Analysis:
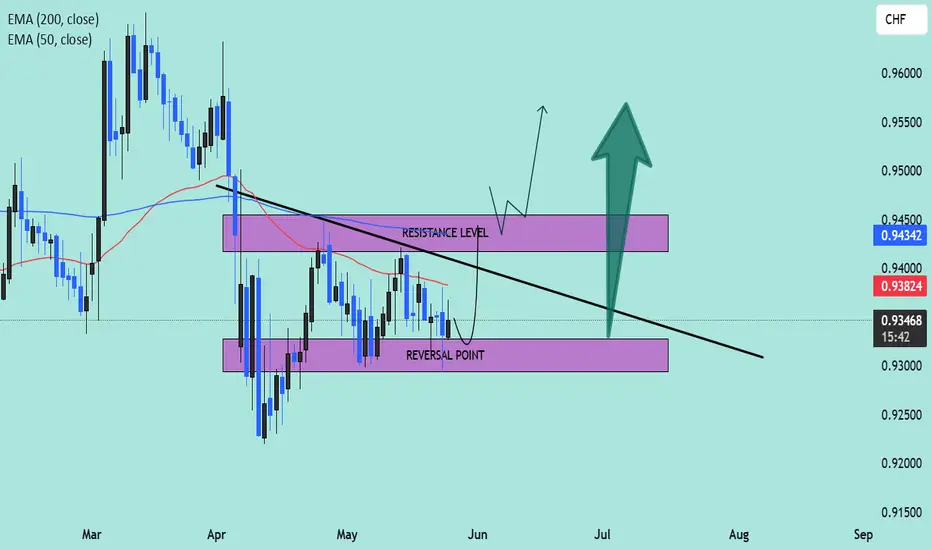
🔻 Downtrend Resistance Line: A clear descending trendline is pressing price lower, reinforcing a bearish structure since March.
🟣 Reversal Zone (Support Area):
Price is currently hovering just above the marked Reversal Point, a demand zone between 0.93000–0.93400. Historically, this zone has acted as a launch pad for upward momentum.
🟪 Resistance Level:
Located around 0.94300–0.94600, this zone is reinforced by the 200 EMA, making it a critical breakout area. A strong bullish close above this region could invalidate the downtrend.
🔄 Two Scenarios to Watch:
✅ Bullish Breakout Scenario:
Price may bounce from the reversal zone.
A break and retest above the resistance level could lead to bullish continuation toward 0.9500–0.9550.
Confirmation above the 200 EMA will add confidence to the breakout.
📈 Potential Buy Entry: On breakout and retest of 0.9450
🎯 Target: 0.9550
🛡️ Stop Loss: Below 0.9320
❌ Bearish Continuation Scenario:
If price fails to hold above the reversal point, sellers may regain control.
A breakdown below 0.9300 could trigger further downside toward 0.9200 or lower.
📉 Sell Setup Invalid Until: Price closes below 0.9300 on strong volume.
🧭 Conclusion:
This chart suggests a critical decision point for EUR/CHF. A bounce from the reversal zone followed by a confirmed break above resistance could signal the start of a medium-term uptrend. Traders should monitor price action closely for confirmation signals near the trendline and EMA zones.
🚦 Bias: Neutral to Bullish, awaiting confirmation
🧠 Tip: Watch for candlestick patterns (like bullish engulfing or pin bars) near the support zone for early entries.
Search in ideas for "INDICATORS"
GBP/JPY Bullish Setup:Targeting194.193 After Demand Zone RetestTrend:
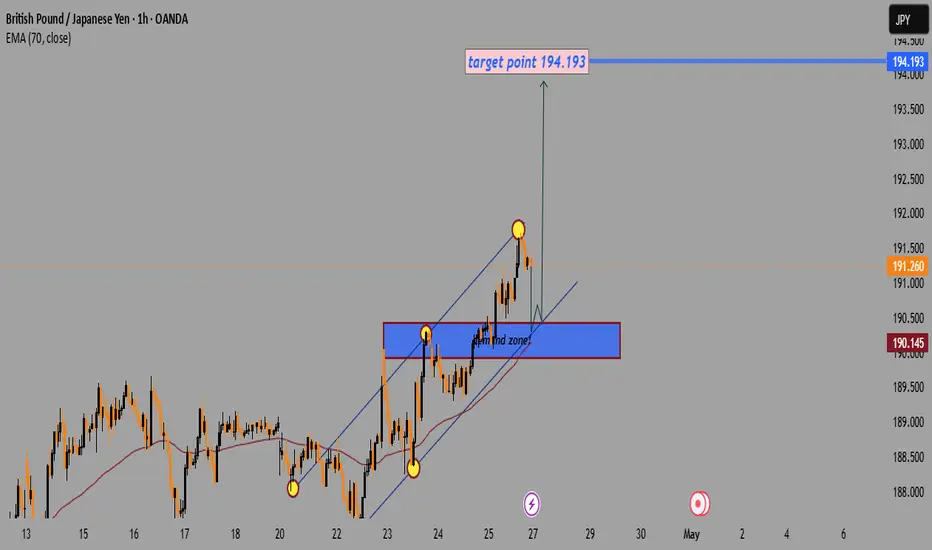
📈 Uptrend inside a rising channel (blue lines).
Key Zones:
🟦 Demand Zone: Between 190.400 - 190.700.
🧲 Acts as strong support where buyers previously stepped in.
Indicators:
📉 EMA 70 at 190.145 (below price) → bullish support.
Price Action:
📍 Current price: Around 191.260.
🔥 Recently touched upper channel resistance and pulled back slightly.
Target:
🎯 Target Point: 194.193.
Scenario:
🔄 Expecting a small pullback towards the demand zone or channel support.
🚀 Then a bullish continuation towards the target (194.193).
Risk Warning:
⚠️ If the price breaks below the demand zone and EMA, the bullish idea might be invalid.
(XAU/USD) Bearish Trade Setup – Targeting $3,222 with 1:6 Risk/R(Sell) setup.
Entry Point: Around 3,409.33 - 3,408.41 USD.
Stop Loss: 3,437.87 USD.
Target (Take Profit): 3,222.53 USD.
Risk/Reward Ratio: Approximately 1:6, which is favorable.
📉 Price Action & Trend Analysis:
A rising wedge (or channel) appears to have formed and broken to the downside — a bearish signal.
The current price at 3,341.47 has broken below a minor support zone (highlighted in purple), indicating bearish momentum.
Price is now approaching the 200 EMA, which is acting as potential dynamic support.
📌 Key Levels Highlighted:
Support Zones: Near 3,347.47 (previous minor support) and 3,222.53 (main target zone).
Resistance Zones: At the entry level and above, near 3,437.87 (Stop Loss zone).
🔄 Indicators:
Moving Averages (Red and Blue Lines): Shorter-term moving average (red) is below the longer-term (blue), indicating downward pressure.
Momentum Shift: The sharp drop suggests a likely continuation of the bearish trend.

EUR/USD Buy Setup1. Entry Point:
Marked at: 1.12243
This is the suggested price level to enter a long (buy) trade.
2. Stop Loss:
Set at: 1.11542
Placed below a support zone, it limits the downside risk if the trade moves against the position.
3. Target Points:
EA Target Point One: 1.13891
EA Target Point (Final): 1.15929
These levels are profit-taking zones, with the first being a conservative target and the second being a more extended move.
4. Technical Indicators:
Moving Averages:
A red shorter-term moving average (possibly 20 EMA)
A blue longer-term moving average (possibly 200 EMA)
Price is currently below both, indicating bearish momentum, though the long setup is anticipating a reversal.
5. Support/Resistance Zones:
Purple Zones: Highlighted as key demand and supply areas.
The lower purple zone supports the entry and stop-loss area.
The upper purple zones mark resistance areas aligning with the target levels.
6. Current Price:
Around 1.12459, slightly above the entry zone.
Conclusion:
This setup is a bullish trade idea with a clearly defined:
Entry (1.12243),
Stop-loss (1.11542), and
Two take-profit levels (1.13891 and 1.15929).

BTC at Key Inflection Zone – Breakout or Rejection Ahead?Asset: BTC/USD
Timeframe: 4H or Daily (based on visual pattern structure)
As of: May 6, 2025
Indicators:
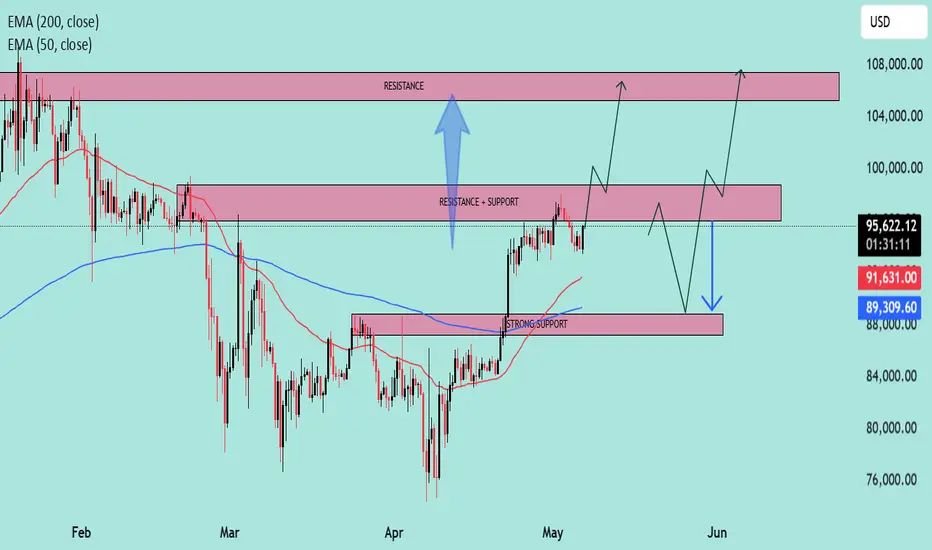
50 EMA (Red): $91,615.79
200 EMA (Blue): $89,305.75
Key Technical Zones:
🔴 Resistance Zone: ~$104,000 – $108,000
This area has historically acted as a major supply zone.
Price has been rejected from this level multiple times, indicating strong selling pressure.
🔁 Flip Zone (Resistance turned Support/Support turned Resistance): ~$95,500 – $100,000
The current price ($95,234.23) is testing this zone from below.
A confirmed break and hold above could signal continuation toward the higher resistance.
🟢 Strong Support Zone: ~$88,000 – $91,000
Confluence of 50 EMA and 200 EMA adds strength to this demand zone.
Previous breakout level and accumulation area.
EMA Outlook:
50 EMA > 200 EMA: Short-term bullish crossover is active, indicating bullish momentum.
Both EMAs are sloping upward slightly, suggesting trend strengthening.
Price is currently above both EMAs, which acts as dynamic support.
Potential Scenarios:
✅ Bullish Scenario:
If price reclaims the $95,500–$100,000 resistance-turned-support zone:
Expect upward momentum to continue.
Target: $104,000–$108,000 zone.
Break of $108K could lead to a macro bull continuation.
⚠️ Bearish Scenario:
If price rejects the current zone and fails to hold above the $91,000 support:
Look for retest of $88,000–$89,000 area (confluence with EMAs).
Breakdown below that zone would invalidate bullish structure and signal potential deeper correction.
Summary:
Bias: Bullish above $91K, Neutral between FWB:88K –$91K, Bearish below $88K.
Key Confirmation Needed: Daily close above $100,000 for strong bullish continuation.
Risk Management: Watch for fakeouts within the $95K–$100K range due to past volatility.
(BTC/USD) 1H Trade Setup – Key Entry, Stop Loss & Dual TargetEntry Point: 95,431
Stop Loss: 95,264
Target Points:
Upside (Target 1): 100,674 (Potential gain: +5.36%)
Downside (Target 2): 86,614 (Potential loss: -7.57%)
Trade Setup:
Risk-Reward Ratio:
Approx. 1:0.7 (Not ideal; the reward is smaller than the potential loss)
Support Zones:
Highlighted in purple beneath the entry zone — this indicates a historically strong support area.
Resistance Zones:
The upper purple zone marks the next significant resistance around 100,000–100,795.
Technical Indicators:
50 EMA (Blue Line): Indicates mid-term trend support, currently holding price action.
Price Action: BTC appears to be retracing toward support after a bullish rally.
Interpretation:
The setup implies a long (buy) position with a very tight stop loss.
The price is nearing a support zone, and if it holds, there's potential for an upward move to the target at 100,674.
However, if price breaks below 95,264, a sharp drop to 86,614 is anticipated.

USD/JPY Bullish Reversal Setup – Long Entry at 141.964 Targeting ahemdsaeed25: USD/JPY Long Setup – Eyeing 150.537 Target"
"Potential Bullish Reversal on USD/JPY"
"Swing Trade Alert: USD/JPY Long from 141.964"
"USD/JPY Breakout Play – Buy Zone Identified"
Let me know your tone preference (technical, casual, professional, etc.) and I can tailor the title further.
ahemdsaeed25: This chart is for the USD/JPY (U.S. Dollar / Japanese Yen) pair on the 1-hour timeframe, and it's displaying a bullish setup with a clear trade idea. Here's a breakdown of the analysis:
Key Components:
Current Price: Around 142.574.
Entry Point: 141.964
Stop Loss: 140.547
Take Profit / Target Point: 150.537
Reward-to-Risk Ratio: Favorable (approximately 5.94% upside, large potential move).
Indicators:
EMA 50 (Red Line): 142.798 — acting as near-term dynamic resistance.
EMA 200 (Blue Line): 144.699 — major resistance and a trend filter (downward trend visible).
Zone Analysis:
Support Zone (Purple Box near 141.964 - 140.547): This is the accumulation/buy zone.

Bitcoin (BTC/USD) Trade Setup & Analysis🔹 Trend Analysis:
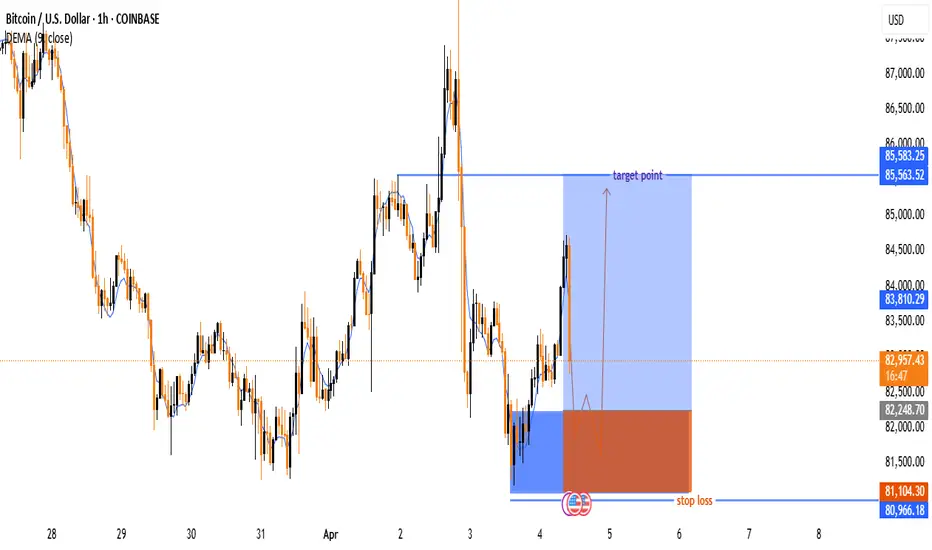
📉 The chart shows a downtrend followed by a reversal attempt.
📈 The price bounced off a support zone and is moving upwards.
🔹 Indicators:
📊 The 9-period DEMA (83,805.38) is slightly above the current price, acting as a resistance level.
🔹 Trade Setup:
🟢 Entry Zone: Around 82,943 (Current Price)
🔴 Stop-Loss: 81,183.22 ❌ (Below support level)
🎯 Target Point: 85,563.52 ✅ (Upper resistance level)
🔵 Strategy: The trade anticipates a price dip before
EUR/GBP Bearish Momentum – Eyes on Support Zone!📊 EUR/GBP Daily Chart Analysis (28th Jan 2025)
🔹 Overview:
Pair: EUR/GBP
Current Price: 0.83855 📉 (-0.10%)
Key Indicators:
200 EMA (Red Line): 0.84129 (Price is below the EMA, indicating bearish sentiment)
Resistance Zone (🟠 Orange Box): ~0.84200 - 0.84400
Support Zone (🟢 Green Box): ~0.83200 - 0.83400
🔻 Bearish Outlook:
Price recently rejected the resistance zone and started declining.
It is now trading below the 200 EMA, suggesting potential further downside.
Next Target: The support zone (~0.83200 - 0.83400) is likely the next major level.
📉 Possible Scenarios:
1️⃣ Bearish Continuation ⬇️
If the price maintains momentum, it may head toward the support zone (~0.83200).
A break below support could trigger further downside.
2️⃣ Bullish Rebound 🔄
If the price finds strong buying interest at support, a rebound toward the resistance (~0.84200) is possible.
A breakout above 200 EMA could shift momentum back to bullish.
🎯 Trading Considerations:
Short Opportunity: Below 0.83800, targeting 0.83400.
Long Opportunity: If support holds around 0.83200, aiming for a move back to resistance.
Breakout Watch: A move above 0.84200 could trigger bullish momentum.
🔥 Conclusion: Currently, the trend is bearish, and price action suggests further downside toward the support zone. Keep an eye on price behavior around 0.83400 for potential reactions.

Time Technoplast - Indicators suggesting an upward moveCompany is the largest manufacturer of large size plastic drums with a market share of ~60% and its 75% revenue comes from pakaging. Though the EPS and Profit has very marginally come down on QoQ basis, if if go purely by indicators:
1. MACD close to getting green
2. Touching top BB
3. Volunes increasing
We can expect the price to move up towards its targets. Blue line target are as per weekly chart, and green as per daily chart.

NIFTY 50 MOMENTUM INDICATORS ANALYSIS4 TYPES OF INDICATORS AVAILABLE IN STOCK MARKET
1) TREND INDICATORE - LEADING & LAGGING INDICATOR EX: P. SAR - MOVING AVG ...
2) MOMENTUM INDICATOR - LEADIND & LAGGING INDICATOR EX: RSI - MACD ...
3) VOLTALITY INDICATOR EX: INDIA VIX - BOLLINGER BAND ...
4) VOLUME INDICATOR EX: - VOLUME CHART - ON BAL VOL (OBC) ...
ABOVE CHART ANALYSIS ONLY FOLLOWED BY MOMENTUM INDICATORS.

NIFTY 50 TREND INDICATORS ANALYSIS4 TYPES OF INDICATORS AVAILABLE IN STOCK MARKET
1) TREND INDICATORE - LEADING & LAGGING INDICATOR EX: P.SAR - MOVING AVG ...
2) MOMENTUM INDICATOR - LEADIND & LAGGING INDICATOR EX: RSI - MACD ...
3) VOLTALITY INDICATOR EX: INDIA VIX - BOLLINGER BAND ...
4) VOLUME INDICATOR EX: - VOLUME CHART - ON BAL VOL (OBC) ...
ABOVE CHART ANALYSIS ONLY FOLLOWED BY TREND INDICATORS.

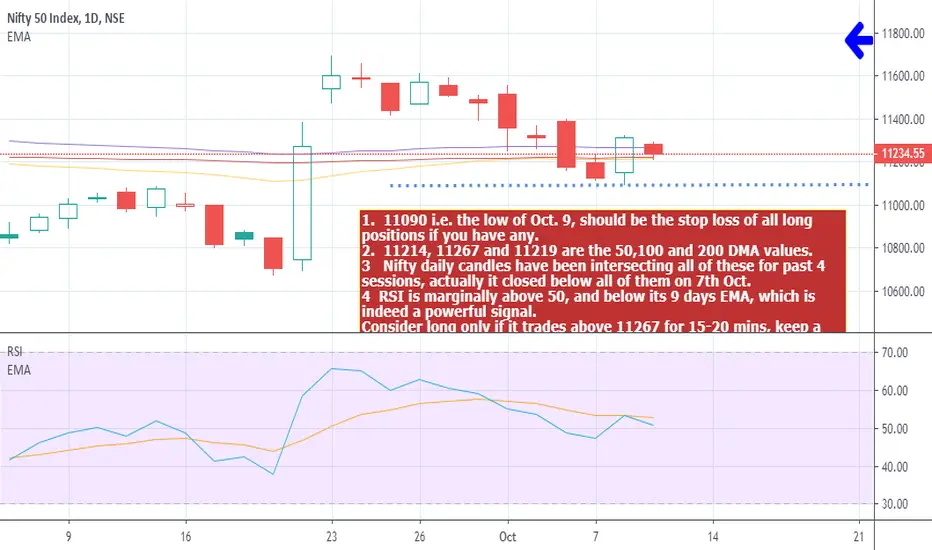
NIFTY trend using 50, 100 & 200 Days' EMAs and other indicators 1. 11214, 11267 and 11219 are the 50,100 and 200 DMA values.
2. Nifty daily candles have been intersecting or closing below these values for past four sessions.
3. RSI is just a tad above 50, but well below its nine days EMA, which is indeed a powerful signal.
4. Most other indicators too are on the verge of giving buy or sell signals.
5. Bank Nifty is looking weaker i.e. clearer SELL on most indicators. Nifty may not be able to outperform Bank Nifty for long.
6. 11090 i.e. the low of Oct. 9, should be the ultimate stop loss of all long positions, similarly 11315, high of Oct. 9, can be the stoploss for all Short positions.
Consider long only if it trades above 11267 for 15-20 mins, keeping a stop loss at 11210.
Short if it trades below 11210 for some time, with a stop loss of 11267.
Consider covering all shorts around 11090-11100 levels. Beyond technicals, assumption is 11050-11100 is strong support area, it is wise to book profit on short trades around these levels and wait for clarity.
Repeating decisive breach of 11315 or 11090 will confirm further strength or weakness of the market.
Please hit agree or like for this post / idea, if you find it worthy. You may consider FOLLOWING me, for periodic updates on Nifty, Bank Nifty.
Buy crude oil, hourly indicators at bottomCrudeoil near 6318 is at hourly bottom as indicated by stochastics indicators.

Indicator for Intraday Trading - with BUY/SELL Signals Hi Traders,
Here the trading made easy with Signals...
Its a Combined Pivot Boss Price Action Strategy Indicator and advantage of this indicator is Multiple Support & Resistance Confluences to take potions with more confidence. You will never find in the standard indicators.
This indicator has been created based on Pivot Boss, RSI and Price Action Strategy.
BUY Signal - Go Long at middle price of the Candle, SL low of the candle.
SELL Signal - Go Short at middle price of the Candle, SL high of the candle.
Indicator Details:
Daily CPR Levels
Pivot Points
Weekly & Monthly CPR Levels
Tomorrow CPR Levels
Developing CPR
Camarilla Levels
Initial Balance
Pre - Day, Week, Month - High / Low Levels
SMA , EMA and WMA Moving Averages
Moving Average with Multi Selections
Magic Band
Price Action
All in one place, Cheers!

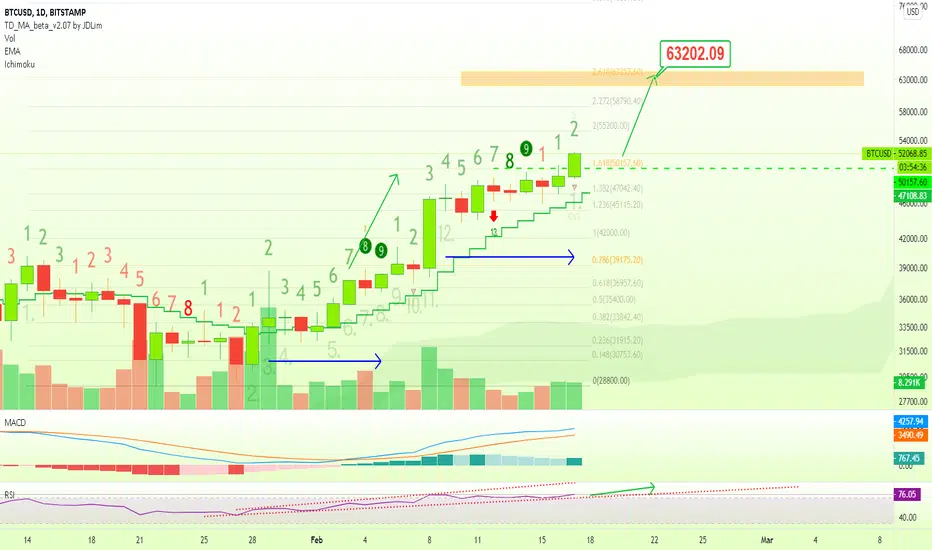
Bitcoin Daily Bullish Indicators (TD Sequential + RSI)Bitcoin (BTCUSD) is starting to look better and better each day.
We are looking at the daily timeframe now and we can see Bitcoin aiming at new highs.
Prices are now trading above resistance with bullish indicators.
The TD Sequential started a new count.
The RSI looks pretty strong and moving above all resistance:
The MACD is also strong on the bullish side.
At this rate, we can see a $55,000 Bitcoin in a day or two...
Do you think this is possible?
Share in the comments with us.
Namaste.
Pendant Flag in BankNifty and analysis using breadth indicatorsHave you thought about how the price of BankNifty is calculated?
The price is being calculated by using the free-float market capitalization of the underlying stocks.
To truly understand how BankNifty moves, we need special tools called breadth indicators. Price action doesn't help us accurately predict all the movements, but with this indicator, you can recognize which are fake break outs and real.
I have also developed a momentum based indicator which tells you where the market likes to head. The momentum-based indicator is above 0, and the indicator is red, this is not sustainable if the conditions are right the indicator is going to jump to green, and the stock is going to go up.
If you have any queries, please message me.

W5T ROLLER COASTER/BITS/ELLIOT WAVE INDICATORS WORKING TOGETHERRTY demo using our W5T Roller Coaster indicator and how to use with our Elliot Wave and BITS indicators.

Candle chart with SMA/EMA, RSI+ADX indicators. This is my first candle chart with EMA/SMA, RSI, and ADX indicators. How to improve this setting for prediction of the NIFTY index?

Trade Efficiently in Volatility with These IndicatorsWhen trading in the stock market, it’s crucial to consider not only whether the market is trending or consolidating but also how to handle volatility.
Therefore, understanding volatility indicators is key to trading more effectively.
Here we are going to discuss some top Volatility Indicators that will be useful for traders who want to analyze and negotiate the market’s turbulence more successfully.
What are Volatility Indicators?
Volatility Indicators are technical tools that help in analyzing the market, measuring the speed and the size of price changes in the security, commodity, or even a market index.
They give traders an indication of when volatility is high or low and this can contribute to risk assessment and trading strategies.
These indicators offer some insight into how much volatility the market might anticipate for future periods and they may be used to identify possible tops and bottoms in markets, enabling better decision-making by traders.
How to Identify Volatility in the Market?
Standard deviation is a popular tool for spotting market volatility. Traders and analysts use it to understand what’s driving the market.
It measures how much a stock’s price typically deviates from its average over a certain period.
Volatility can be low or high. Low volatility means a stock's value is steady and doesn’t change much. High volatility means the value fluctuates a lot in a short time.
Volatile periods in the stock market can lead to significant price swings, making trading challenging.
Extreme volatility often occurs when major news impacts the market. High volatility is typically seen during trending markets, while low volatility is more common during consolidation phases.
High volatility is great for breakout strategies and scalping, while low volatility is better for relaxed trading approaches.
Top 5 Volatility Indicators
When analyzing the market, here are some of the key volatility indicators that traders can employ.
1. Bollinger Bands
Bollinger bands are composed of three: high, low, and middle.
The middle band is a 20-day or bar moving average, the upper band is +2 Standard Deviation and the lower band is -2 Standard Deviation away from the middle band.
When market volatility increases, the bands expand, and when volatility decreases, the bands contract.
Bollinger bands can be used to trade when prices break out either above or below either side of the upper or lower bands following a low volatility or consolidation phase.
2. Average True Range (ATR)
The Average True Range (ATR) is another technical analysis indicator that measures market volatility by decomposing the entire range of an asset price for that period. Originally developed for commodities, the indicator can also be used for stocks and indices.
The ATR indicator is most commonly used with other market indicators to confirm market moves or to anticipate possible market changes that are not readily apparent.
A higher ATR indicates higher volatility and may be a sign of market uncertainty, while a lower ATR indicates lower volatility and could suggest market complacency.
It’s important to note that the ATR does not provide an indication of price direction, only volatility.g stop loss levels, and for predicting price movements.
3. Donchian Channel
Donchian Channels are a popular tool for gauging market volatility. This indicator features three lines derived from moving average calculations.
It consists of three bands: an upper band, a lower band, and a median band in between.
The upper band represents the highest price of a security over a specified period, typically four weeks, while the lower band indicates the lowest price over the same timeframe.
The space between the upper and lower bands forms the Donchian Channel.
Traders often use this channel to identify trading opportunities—entering a buy trade when the price breaks above the upper band, and a short position when it falls below the lower band.
4. Keltner Channels
Keltner Channels resemble Bollinger Bands but with a key difference. While Bollinger Bands place their boundary lines at standard deviations from the moving average, Keltner Channels use the Average True Range (ATR) to set the channel distance.
The Keltner Channels consist of an upper band, a lower band, and a middle line which is typically a moving average.
The distance from the middle line to the upper and lower bands is calculated by multiplying the ATR with a factor, usually 1.5 or 2.
The channels expand during periods of high volatility and contract during periods of low volatility, similar to Bollinger Bands.
Traders often use Keltner Channels to identify potential price breakouts and overbought or oversold conditions.
5. Cboe Volatility Index (VIX)
The Cboe Volatility Index (VIX), often referred to as the “fear index”, is a real-time market index that represents the market’s expectation of 30-day forward-looking volatility. It is derived from the prices of S&P 500 index options with a series of expiration dates.
It gives a measure of market risk and trader’s sentiments. It is also inversely related to market performance, meaning when the market is performing well, the VIX tends to drop and vice versa.
Therefore, it’s widely used as a gauge of market volatility and often used in portfolio diversification to hedge against market downturns.
Conclusion
In volatile markets, using the right tools can make a big difference. By combining different strategies and focusing on key aspects of market movement, you can manage risk and spot opportunities even when things get unpredictable.
Remember, a well-planned approach and use of these tools can help you navigate market swings more effectively and boost your trading success.

These 10 Trading Indicators are IncredibleTrading indicators are tools that examine price movements and market directions, giving useful information on when to buy or sell securities or hold them.
From simple moving averages (SMA) to Ichimoku Clouds and other complex ones, each indicator offers unique benefits that traders may use as they navigate through financial markets with confidence and precision.
In this article, we discuss 10 trading indicators that can change your trading strategies drastically.
Best Trading Indicators
Here are 10 commonly used trading indicators that traders often find useful:
1. Moving Average (MA)
A Moving Average (MA) is a line, which smoothes out price data by averaging the prices for a given amount of time. It aids traders in discovering trends by filtering random price noise.
When the new data points replace the oldest ones, the average moves with the price, thus reflecting the direction of trends in terms of visuals.
MAs help traders define support and resistance levels as well as recognize possible trend reversals.
2. Relative Strength Index (RSI)
Relative Strength Index (RSI) shows how fast and how much the price of a stock changes. It is displayed on a scale ranging from 0 to 100.
If the RSI is above 70, this means that the stock is overbought and it will soon lose value.
Conversely, if the RSI drops below 30 it implies oversold conditions which could mean prices may rise.
Based on these levels, traders use the RSI to identify potential buying or selling opportunities.
3. MACD (Moving Average Convergence Divergence)
Moving Average Convergence Divergence (MACD) is designed to help traders measure the momentum and direction of price trends. It has two moving averages – the MACD line and signal line – together with a histogram that depicts their disparities.
Crossovers between these lines are often indicative of possible turns in market direction, with bars in the histogram showing how strong or weak such movement of prices was.
MACD helps traders identify buy and sell signals as well as confirm trend reversals.
4. Bollinger Bands
The Bollinger Bands are made up of a moving average line, with two standard deviation ranges above and below it.
They assist traders in determining market volatility as well as target prices. When the bands widen, volatility increases, suggesting potential trading opportunities.
On the other hand, narrowing bands indicate decreasing volatility and may precede a breakout or significant price movement.
Traders often use Bollinger Bands to identify overbought or oversold conditions and to anticipate trend reversals or continuations.
5. Stochastic Oscillator
This indicator compares a security’s closing price to its price range over a set period, typically 14 days.
It measures where the current price is relative to its recent price range, indicating potential overbought (when prices are considered high) or oversold (when prices are considered low) conditions.
Traders use it to anticipate trend reversals or confirm ongoing trends, with readings above 80 suggesting overbought conditions and below 20 indicating oversold conditions.
6. Average True Range (ATR)
ATR measures the volatility of a financial asset by calculating the average range of price movements over a specified period.
It helps traders understand the potential for price movement and volatility in the market.
A higher ATR suggests greater price volatility, while a lower ATR indicates lower volatility.
Traders use ATR to set stop-loss levels, determine position sizes, and assess the risk of a trade relative to potential rewards.
7. Volume
Volume in trading refers to the total number of shares or contracts traded within a specific timeframe.
It's crucial because it confirms price trends: increasing volume often validates a trend, while decreasing volume may signal a reversal.
Traders use volume to gauge market strength: higher volume suggests strong interest and momentum, supporting the current price direction.
On the other hand, low volume may indicate lack of conviction among traders, potentially signaling a change in trend.
8. Ichimoku Cloud
This indicator helps traders identify trend direction, support, and resistance levels. It consists of five lines: the Conversion Line (Tenkan-Sen), Base Line (Kijun-Sen), Leading Span A, Leading Span B, and the Cloud.
The Cloud, or Kumo, represents an area where future support or resistance may form. Traders use the Ichimoku Cloud to confirm trends, spot potential reversals, and determine entry and exit points in the market.
9. Fibonacci Retracement
Fibonacci Retracement is a tool used in trading to identify potential levels of support or resistance based on Fibonacci ratios.
These ratios (such as 23.6%, 38.2%, 50%, 61.8%, and 100%) are derived from the Fibonacci sequence, where each number is the sum of the two preceding ones.
Traders use Fibonacci Retracement to predict where a price might reverse or consolidate during a trend, aiding in entry and exit decisions.
10. On-Balance Volume (OBV)
On-Balance Volume (OBV) tracks cumulative buying and selling pressure by adding volume on days when prices close higher and subtracting it on days when prices close lower.
This indicator helps traders confirm trends: if OBV rises with price increases, it suggests strong buying pressure and a bullish trend.
Conversely, if OBV falls while prices rise, it may indicate weakness and potential reversal. OBV is straightforward and useful for assessing the strength of price movements based on volume dynamics.
Conclusion
Now that you've discovered these ten incredible trading indicators, remember that success in trading comes from understanding and applying them wisely. Try out various indicator combinations and strategies to discover what suits your trading style and preferences the best.
For more this kind of educational content follow our youtube and instagram channel.
Youtube:

Top 5 Essential Indicators for BeginnersBuild a strong foundation with these must-know tools.
Starting out in technical analysis can feel overwhelming. With hundreds of indicators available on platforms like TradingView, where do you begin?
The truth is, you don’t need dozens of tools just a few reliable, beginner-friendly indicators that help you understand market trends, momentum, and entry/exit points.
Here are the top 5 essential indicators every new trader should learn:
1. Moving Average (MA)
Why it matters: Moving Averages help smooth out price action and identify the direction of the trend.
There are two common types:
Simple Moving Average (SMA): Basic average over a set period
Exponential Moving Average (EMA): Gives more weight to recent prices
Use it to spot trend direction:
Price above MA = uptrend
Price below MA = downtrend
Beginners often start with the 50 and 200 EMA for swing trading or 9 and 21 EMA for intraday setups.
2. Relative Strength Index (RSI)
Why it matters: RSI is a momentum oscillator that helps spot overbought or oversold conditions.
RSI above 70 = Overbought (possible reversal or pullback)
RSI below 30 = Oversold (possible bounce)
It’s a great tool for spotting divergences and potential turning points, especially when the price reaches a key support/resistance level.
3. MACD (Moving Average Convergence Divergence)
Why it matters: MACD reveals momentum and potential trend reversals through moving average crossovers.
It includes:
MACD Line
Signal Line
Histogram
When the MACD line crosses above the signal line, it’s a bullish signal. When it crosses below, it’s bearish.
It’s a favorite among traders who want a blend of trend and momentum analysis.
4. Bollinger Bands
Why it matters: Bollinger Bands show price volatility and help spot potential breakout zones.
They consist of:
A middle line (SMA)
Upper and lower bands based on price volatility
Price touching the upper band may indicate overbought conditions, while the lower band can signal oversold. When bands contract, expect a volatility breakout soon.
5. Stochastic Oscillator
Why it matters: Another momentum tool, it compares a security’s closing price to its price range over a period.
Above 80 = Overbought
Below 20 = Oversold
It works well in range-bound markets and helps confirm reversal zones, especially when paired with support/resistance.
Conclusion
You don’t need to master every tool at once. These five indicators MA, RSI, MACD, Bollinger Bands, and Stochastic Oscillator give you a solid, practical starting point to read charts and make smarter trading decisions.

24.09.30 Whale Indicators (Was earnings of $2400 possible?)Hello, I'm a whale signal
It's the same as the whale index I shared last time
After failing to break strongly above the purple whale index over the weekend, it was again resisted,
The white whale index also closed lower, sending it lower over the weekend
When everyone looked at Long, the Whale Index was bearish
He explained that there must be a place where you can make 2,500 dollars in another room
I think I made a good profit of more than $2,400
Congratulations if you made a profit
Now, if the trend is strong, I'm looking for at least $2800 and $5000
We don't have much time left
I shared a lot of good things
Here's a look at this RBI in a real-time chart share of Whale Indicators below
After analyzing the main points of view
Please find out the exact trading RBI through whale indicators
***whale surface strength***
Purple>>>Orange>>White
(Purple indicators are the strongest)
