24.09.07 Whale IndicatorsHello, I'm Whale_signal
Before that, we'll review the 1H-BTCUSDT chart
The problematic spot was an hour stick, showing a flow of settling the orange whale surface, and then a sharp drop came out immediately
There are probably people who hosted LONG on that spot
1. If you have made a buy on Whale Indicators, you should designate an entry price cut right away
-> Whale indicators are strong indicators, so if they break, which direction? We don't know how much the price will be pushed
-> Profit is important, but risk response comes first
2. There's been a $250 rise from the orange whale indicator and $250 in the futures market is definitely not a small profit
-> Even if you didn't eat $250, you could have avoided a big loss if you designated it as a stopper
I don't feel good because there might be people who lost money. From now on, please make sure to proceed with the stoppage
1H - BTCUSDT Update
It's a very complicated seat. I think it'll help, so I've added a white whale indicator
If it fails to rise above the orange whale index, it could continue to face downward pressure, and if it deviates below, it could see mid to late 46K to late 47K
And if the mid to late 46K to 47K are also breached, please refer to the 1D-BTCUSDT purple whale indicator
You have to be careful because it's continuously being pushed down and it's located under the purple whale indicator
***whale surface intensity***
Purple>>>Orange>>>White
(Purple indicators are the strongest)
Search in ideas for "INDICATORS"

Technical Indicators Reveal TCS Short Selling OpportunitiesIntroduction:
This report aims to provide a technical analysis of TCS stock and a recommendation for short selling the stock in the short term. The analysis is based on the latest charts and indicators, and is intended for investors and traders who are looking to capitalize on market movements.
Background:
Tata Consultancy Services Limited (TCS) is a leading Indian multinational information technology (IT) service and consulting company. The company's stock is listed on the National Stock Exchange of India (NSE) and is widely followed by investors and traders.
Analysis:
The TCS stock has been in a strong uptrend for the past few months, but recent price action suggests that the stock may be reaching a resistance level. The stock has been trading in a range between 3396 and 3413, and a breakdown below 3396 could signal a short-term trend reversal.
The technical indicators are also pointing to a potential sell-off. The Relative Strength Index (RSI) has been trending lower and is currently at overbought levels, indicating that the market is overbought and may be due for a pullback. Additionally, the Moving Average Convergence Divergence (MACD) histogram has crossed below the zero line, suggesting that the trend is losing momentum.
Furthermore, price action on the chart shows that the stock has reached a strong resistance level and is showing signs of a potential reversal, with bearish cand formation.
Recommendation:
Based on the analysis above, we recommend short selling TCS stock around 3396 levels, with a stop loss of 3413 and a target 1 of 3379 and target 2 of 3353. This strategy aims to capitalize on a short-term trend reversal and capture potential profits as the market pulls back.
However, it's essential to keep in mind that the market is highly volatile and unpredictable. Therefore, it's recommended to keep a close eye on the price action, and use stop loss and take-profit levels to minimize risk and maximize returns.
Conclusion:
In conclusion, TCS stock appears to be reaching a resistance level and may be due for a short-term pullback. Technical indicators and price action on the chart also suggest a potential trend reversal. Therefore, short selling TCS stock around 3396 levels with a stop loss of 3413 and a target 1 of 3379 and target 2 of 3353 is a recommended strategy for traders and investors looking to capitalize on market movements in the short term.
It's important to conduct your own research and analysis before making any investment decisions, and always consult a financial advisor before taking any action.

trade with use of 3 indicatorstrade with use of 3 indicators
take buy call when all 3 indicators suggest green signal.
exit on target or when any one indicator suggest sell alert.
take short or put option when all 3 indicators suggest red signal.
exit on target or when any one indicator suggest buy alert.

My Favorite Indicators for IntradayThe Indicators which I Use for Trading Intraday is,
Pivot Points High Low (HH/HL/LH/LL)
SuperTrend
ATR Smoothed (By dysrupt)_BuySell version.
These are all the Indicators which i use for trading Intraday on, FOREX, Crypto, Stocks
The Indicators Mentioned above are Tremendously powerful for booking Profits.
1 minute TimeFrame is best, for taking Profits Early.
The Indicators mentioned above has a 100% Accuracy Rate.
Thanks for using your Valuable time. Leave a like which helps me to do better. Follow me for Daily Signals,
Get updates on, FOREX, Stocks, INDICES, Crypto, #--CFD's to be expected soon.

24.09.24 Whale Indicators - ETHUSDTHello, I'm Whale_signal
Today, we'll upload ETHUSDT - 4H chart
There's a rebound coming out of SUPORT LINE,
If you can show us the upward trend
The next RESISTANCE LINE will be shared in the real-time chart sharing of whale indicators below
(In real-time chart sharing, I already shared it even before it reached SUPPRESS LINE, so it's already profitable.)
After analyzing the main points of view
I hope you catch the exact buying and selling RBI through the Whale Index
***whale surface intensity***
Purple>>>Orange>>>White
(Purple indicators are the strongest)

Dogecoin Recovery in Sight: Key Indicators Signal Upward MomentuDogecoin Recovery in Sight: Key Indicators Signal Upward Momentum
The weighted sentiment curve entered the bullish territory indicating positive bias.
The bearish divergence in DOGE price DAA metrics has dropped signaling a potential recovery.
Dogecoin kicked off from the lows and has surpassed the 20 day Exponential moving average over the daily time frame indicating early signs of recovery. However, the bulls need to keep this pace until the price surpasses the 200 day EMA for a bullish reversal.
At the time of writing, the meme coin leader was exchanging hands close to $0.105 adding 3.1% to its market cap in the last 24 hours. It ranks 8th among all the cryptocurrencies with a live market capitalization of $15.44 Billion.
Amid the recovery in the price, the investors are keen to determine if DOGE is on the verge of a price rally. Let's analyze using on-chain metrics to clarify whether the upcoming days will be on the profit side or loss side for Dogecoin investors.
Investors Eye Dogecoin for Potential Gains
The price DAA (Daily Active Address) divergence indicator, which tracks the growing or diminishing influence of the bulls and bears, was currently headed from bearish territory to zero line. This is a strong sign of a recovery in the price and fading interest of the bears.
However, despite the recent shift amid the increasing strength of the bulls, the price DAA curve was still in bearish territory indicating that the sellers are still in control of the trend which could limit the strength of momentum.
For the rally in Dogecoin to persist, the price DAA divergence indicator must surpass the zero line and claim its presence in the bullish territory.
The DAA stands for Daily active address which is a metric reflecting the total number of unique users participating in a particular transaction in the last 24 hours.
Additionally, the weighted sentiment curve has shifted its territory from bearish ones to bullish indicating an improved sentiment. The weighted sentiment curve reflects the biases in the crypto whether it is bullish or bearish at the moment.
Dogecoin Price Prediction: What’s In September For investors?
Dogecoin price has been fluctuating in the range between $0.92 on the lower side and $0.115 on the higher side. A strong buying was experienced from the lower levels in the recent sessions and DOGE is edging towards the higher level.
Moreover, to maintain an upward momentum, Solana needs to break through this local supply zone. Given the strong technical indicators including the RSI and MACD, it's likely that DOGE crypto will flip the recent $0.115 barrier into a support and further proceed higher.
The RSI and SMA line highlights a bullish crossover which validates a bullish continuation at the moment. Additionally, the on-chain metrics are continuously improving in tandem with the bounce in the price.
Now, if dogecoin successfully flips the $0.115 level into support it may pave the way to a 25% gain on the higher side till the $0.14 level.
On the contrary, if the price fails to surpass the recent supply, it may invite more sellers to enter at a discounted price and the Dogecoin may crash towards new low. The short term traders and investors need to keep a closer look at the recent price action.

2024.08.29 Whale Indicators (6,000 USD Box Revenue Party)Hello, I'm Whale_signal
This chart is the 4H - BTCUSDT chart I uploaded before
It's not an updated chart
I'm going to do a simple retrofit
I explained that the purple whale index below is important, but in the end, there was a big rise in the whale index at the top
Once again, the whale index at the top was breached to the bottom, resulting in a big drop
I explained that the white and orange whale indicators are weaker than the purple whale indicators
I was pushed back by the 4-hour stick, so I was able to get a big profit from putting it on top and bottom
There's a rebound from the purple whale index
The rise should come out without a breakaway from the purple whale indicator, and if you do, please refer to the 1D - BTCUSDT chart
I don't have a lot of rocket boosters either
I'll only update it somewhere else and proceed with the trading view update later

What Does W-Chart Exemplifies For Jasmy? Indicators Angle On D!
What Does Weekly Chart Exemplifies For Jasmy?
Over the weekly charts, the JASMY crypto price has been declining consistently over the past few weeks, which highlights that the recent trend appears to be dominated by the sellers.
After the long-term break above the long-term consolidation, the JASMY has surged by more than 100% gains. However, Despite the strong surge in the JASMY's price, the asset has seen profit booking over the last few weeks. As observed by the price chart, from the swing high point of $0.04480, the price has degraded almost 47.8% to $0.02319 as of press time.
Furthermore, on the higher side, the continuation could be seen if the JASMY crypto price further builds any bullish candlestick pattern on the chart. Despite that, investors and traders should stay cautious as the recent price structure displays declines in price activity (DYOR).
Indicators Angle On Jasmy Crypto!
Looking at the indicators perspective, the Jasmy has plunged below the 20-day and the 50-day EMA, while the larger trend bands highlight a golden cross among the 50-day and the 200-day EMA, on the daily chart. Therefore, if the price keeps on descending downwards, it could take an assist from dynamic support of a larger trend 200-day EMA and could display a possibility to reverse from a certain level of that time.
Similarly, the MACD metrics have declined to a negative territory, which is below the zero line, and the histograms are declining, showing the bearishness strength rising. Thus, this supports a higher possibility of a bearish trend in the short term. Meanwhile, the RSI has declined below the median line of 50, and the smoothened line of 14-SMA, simultaneously and at press time, flashed at 34.26.

BEEN WORKING ON A TRADING PROGRAM FOR 3-4 MONTHS THAT WILL.....
BE A ALL IN ONE INDICATOR FOR BITCOIN BUT I BELIEVE IT WILL WORK FOR ALL CRYPTOS AND STOCKS, THIS IS THE START OF MY "10XBITCANDLES" BITCOIN PARSE 20+ ALL IN ONE TRADING INDICATOR FOR DUMMIES, IT WILL HELP CUT OUT THE NOISE AND READ THE LANGUAGE OF EACH INDICATOR GIVING EACH A VALUE OF 5% AND AS EACH INDICATOR GIVES THE SHORT/LONG -BUY-SELL SIGNALS SO SHALL OUR PERCENT OF WINNING THAT TRADE WITH A HIGH PROBABILITY OF ACCURACY UP TOO 100% , I AM STILL CONSIDERED A NEWBIE TRADER MYSELF NEXT TOO THE GREAT VETERANS THAT HAVE GIVEN THERE SCRIPS TO THE GUYS JUST STARTING OUT TRADING AND CHARTING AND I THANK THEM FOR THE OPEN SOURCE VERY VALUABLE HARD WORK IN SCRIPTS AND WRITING NEW PINE CODE FOR ALL OF US HERE ON TRADING VIEW THE BEST CHARTING PROGRAM TO DATE WITH A AWESOME COMMUNITY OF TRADERS AND CHARTERS, YES I HAVE LOST MY SHIRT IN THE PAST FEW MONTHS TRADING AND I CHOSE TO NOT PAPER TRADE AND NOT PRACTICE WITH NOTHING TO LOSE BECAUSE I KNOW FROM EXPERIENCE WHEN WE HAVE NOTHING TOO LOSE WE ARE DANGEROUS MOSTLY TO YOURSELF, I BELIEVE WE U HAVE TO ENDURE PAIN AND LOSS TO GROW AND LEARN IN ORDER TO BECOME THE VERY BEST AT WHAT YOU ARE LEARNING , BELIEVE ME IT WAS VERY FRUSTRATING TO GET REKT DAY AFTER DAY ON BYBIT AND IT WAS VERY HARD LOSING ALMOST 10K AND REALLY STARTED TO THINK THAT THE GAME OF TRADING IS RIGGED AND I SAW JUST HOW THE TECHNICAL S ,FUNDAMENTALS IN BITCOIN TRADING STARTED TO CHANGE AFTER THE FUTURES EXCHANGES AND THE BIG WHALES GOT INVOLVED AND IT WAS NOT SO MUCH THEY WERE RIGGING THE GAME BUT IT WAS MYSELF BEING A NEW TRADER AND I WAS LOSING BECAUSE I WAS STILL NEW AND ON THE OTHER SIDE OF EVERY TRADE IS ANOTHER TRADER WITH THE OPPOSITE SHORT OR LONG AS YOU AND HE WAS JUST BETTER AND I KNEW I WAS GOING AGAINST SOME SEASONED VETERANS SO I KNEW I HAD TO STEP UP MY GAME AND BUILD A KICK ASS CHART AND USE ALL THE TOOLS TRADING VIEW OFFERS AND ALL THE GREAT SCRIPS OUT THERE FOR ME TO USE SO I DID NOT HAVE TO INVENT THE WHEEL AGAIN BUT KNEW I HAD TO INVENT A BETTER TRADING PROGRAM, BOT, ALGO'S A ALL IN ONE SIMPLISTIC INDICATOR PROGRAM USING THE BEST TRIED AND PROVEN SCRIPTS FROM THE PROS ON HERE AND MAKE TRADING EASY BUY CUTTING OUT ALL THE NOISE AND LET THE PROGRAM DO ALL THE CALCULATING AND WORK AND MAKE A PROGRAM THAT WILL TRADE FOR ME AND OFFER IT UP FOR SUBSCRIPTION ONCE IT WAS BACK TESTED AND PROVEN TO GET ME WINNING A HIGH PERCENT OF TRADES WITH A PROGRAM THAT GIVES YOU THE HIGHEST PERCENT BASED ON MATH AND INDICATORS AND NOT ON LUCK , SOMETHING TO READ THE NOISE AND JUST MAKE IT LESS COMPLEX AND TIME CONSUMING SO WE CAN SPEND THAT TIME WITH OUR CHILDREN,WIVES AND FAMILY WHILE MAKING DOUBLE OR TRIPLE THE NET PROFITS DOING LESS , ACTUALLY DOING NOTHING BECAUSE I HAVE DONE ALL THE HARD WORK, EDUCATING, AND TAKING ALL THE LOSSES SO YOU AND I CAN NOW REAP THE BENEFITS OF TECHNOLOGY AND DAY TRADING WITH A GREAT SOURSE OF INCOME THAT WILL ONLY COST YOU LESS THEN A HUNDRED BUCKS A MONTH AND THE ELECTRICITY TO RUN A LAPTOP, ANYWAY THAT'S MY DREAM AND THIS CHART IS THE START OF IT AND LIKE TO GIVE BACK TO TRADING VIEW WHAT IT GAVE ME AND THAT WAS FREE SCRIPTS AND CHARTING TO TRY AND TEST OUT , YES I KNOW WE ONLY GET 3 FOR A FREE MEMBER BUT IT WAS WELL WORTH THE FEW EXTRA BUCKS A MONTH TO BECOME A PRO AND TO BE ABLE TO USE OVER 20 INDICATORS AT ONCE AND TO BE ABLE TO EDUCATE MYSELF WITH EACH INDICATOR,CHARTS AND SCRIPTS YOU GUYS IN THIS OPPORTUNITY HAVE OFFERED AND GIVING AND I THANK YOU, TODAY IM ALREADY WINNING MORE TIMES THEN LOSE AND I HAVE TO SAY MY WINNING TRADE RATIO ALREADY IS AT 60-65% AND THAT AFTER A FEW MONTHS OF GETTING REKT, BUT IM COUNTING ON THAT RATIO MOVING UP TO CLOSER TO 75-80% ONCE MY "10XBITCANDLES" IS BUILT, CREATED AND BACK TESTED . ENJOY THIS GREAT CHART AND THE BEGINNING OF THE BEST TRADING PROGRAM FOR DUMMIES ON THE NET..LOL
TRADINGVIEW,
10XBIT.TRADER

Dow Jones 4H Analysis – Bearish Reversal Setupistance Zone: 45,200 – 45,866 (highlighted in red)
Price failed to break higher and reversed.
Support Target Zone: 41,800 – 42,000 (highlighted in green)
Major support from July consolidation.
Price Action:
The chart shows a lower high forming, suggesting exhaustion of bullish momentum.
Bearish momentum is supported by the large downward arrow (projection).
📊 Technical Signals:
Trend: Short-term bearish within the larger uptrend.
Risk/Reward Setup:
Stop Loss above 45,866.
Target around 41,800 → Potential downside of ~3,000 points.
Indicators (implied by structure):
Possible breakdown of recent bullish structure.
Bears gaining control after rejection from resistance.
✅ Summary:
The Dow Jones looks vulnerable to a correction after failing to sustain above 45,200.
As long as price stays below 45,200, the bias remains bearish with targets around 42,000 – 41,800.

Mastering Multi Time Frame Analysis | Swing and Intraday TradingWhether you're a price action trader or rely on indicators, mastering Multi Time Frame (MTF) Analysis can transform your swing and intraday trading decisions. In this video, I break down how to use MTF effectively to align your entries, spot fakeouts, and trade with higher conviction.

Critical Reversal or Breakdown? | XAU/USD at Make-or-Break Zone 📉 Chart Overview:
Instrument: XAU/USD (assumed from chart context)
Timeframe: 4H or Daily (based on candlestick size)
Indicators Used:
📏 EMA 50 (Red): 3,247.86
📏 EMA 200 (Blue): 3,221.42
🔍 RSI (14): Currently at 45.90 (below midline, showing weak momentum)
🔎 Key Zones:
🧱 Support Zone: ~3,180 – 3,220
Price is currently sitting on this key demand zone.
Price previously bounced here sharply ➡️ indicating buyer interest.
📦 Resistance Block: ~3,260 – 3,280
Short-term resistance, price has been repeatedly rejected from here.
🎯 Target Zone: ~3,420 – 3,460
If price breaks out from the support-resistance squeeze, this is the potential bullish target 🎯.
🧭 EMA Analysis:
EMA 50 is still above EMA 200 ➡️ Golden Cross formation (medium-term bullish bias) ✅
However, price is currently below both EMAs, signaling short-term weakness ❌
📉 Bearish Scenario (📍Blue Arrow Down):
If price breaks below the support zone at ~3,180, we could see a sharp drop toward the next support at ~3,032 🔻.
RSI is trending down near 40, close to oversold territory ⚠️
🚀 Bullish Scenario (📈 Blue Arrow Up):
A successful retest and bounce from this support area (currently forming a rounded bottom 🥄) could lead to a bullish move toward the target zone.
This is further supported by the potential RSI bounce from the 40 area, signaling renewed momentum 🔋.
✅ Bias & Conclusion:
Neutral-to-Bullish Bias 🤝: As long as the price holds above the major support zone (~3,180), buyers have a chance to reclaim higher levels.
Look for confirmation breakout above the local resistance (~3,260) for a move toward 3,400+ 🚀.
A breakdown below support would invalidate the bullish thesis and target 3,030 instead 📉.
🛠️ Trading Plan (not financial advice!):
Long Entry: On bullish breakout & retest of ~3,260 ✅
Stop-Loss: Below ~3,180 ⚠️
Target: ~3,420 – 3,460 🎯

XAU/USD) Bullish Trade Setup – Targeting $3,506.52 with Entry atEntry Point: $3,221.19
Stop Loss: $3,169.80
Resistance Zone: Around $3,277.98 to $3,280.64
Target (TP) Point: $3,506.52 (Approx. 9.05% upside)
📊 Technical Indicators and Markings:
Moving Averages:
Likely a 50-period (blue) and 200-period (red) moving average.
Price is currently below both MAs, signaling a short-term downtrend.
Support & Resistance Zones:
Strong support around $3,207.67–$3,221.19 (entry area).
Resistance at $3,244.25–$3,280.64.
Stop-loss is strategically placed below support to limit downside risk.
Target Area:
Projected upside target is $3,506.52, with a potential 9.05% gain from the entry.
This is marked as the EA (Expert Advisor) Target Point, possibly suggesting this is a strategy from an automated trading system.
Orange Circles:
Likely indicate swing highs and lows, used to identify trend patterns and potential reversal points.
📈 Trading Idea Summary:
Bullish Setup: Buying at support, aiming for breakout above resistance to reach target.
Risk-Reward Ratio: Favorable, assuming price holds above $3,207.
Watch for Confirmation: Price needs to break above resistance around $3,280 for momentum continuation

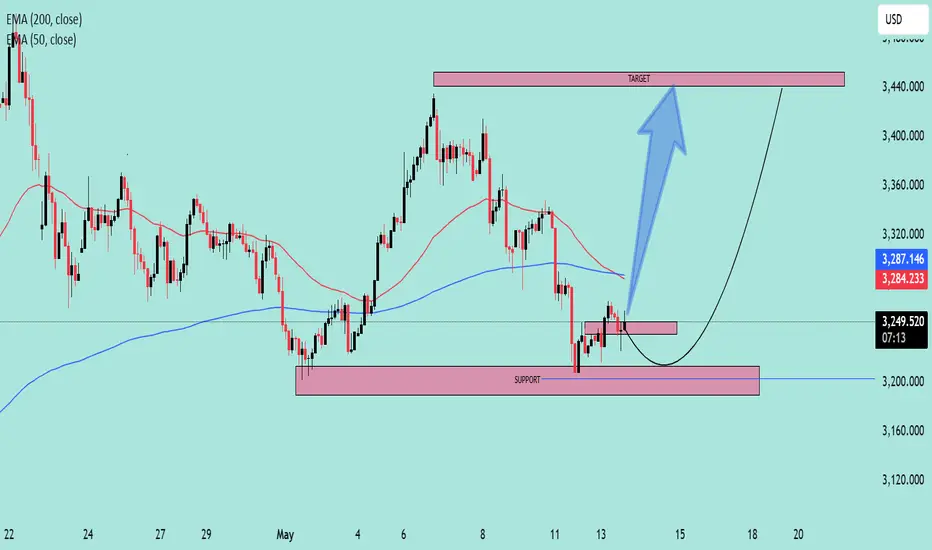
Bullish Reversal Forming at Key Support Zone – Targeting 3,450Instrument: Unspecified (likely XAU/USD or an index, judging by the price range)
Current Price: ~3,250.100
Indicators Used:
EMA 50 (Red): 3,284.255
EMA 200 (Blue): 3,287.152
🟣 Key Zones:
Support Zone: Around 3,200 – a strong demand zone where price previously bounced.
Target Zone: Around 3,450 – the last major resistance and recent high.
📉 Current Price Action:
Price recently tested the support zone and is forming a potential double bottom pattern.
EMAs are above the price, indicating a short-term bearish trend, but the price holding support may suggest a possible reversal.
A bullish trajectory is drawn, projecting a potential rise toward the target zone at 3,450.
📈 Potential Trade Idea (Hypothetical):
Entry: Near current price or on pullback to the small support box (~3,240)
Stop-loss: Below the major support (~3,190)
Take-profit: Around 3,450
⚠️ Key Considerations:
Price needs to break above the EMAs to confirm momentum shift.
Watch for confirmation with bullish candlesticks or volume spike.
Failure to hold the 3,200 support could invalidate this setup.
"BTC/USD Short from 104,855 – Target 93,159. Entry Point
104,855 USD is marked as the entry point (likely for a short position).
The current price is around 103,775 USD, slightly below the entry level.
2. Resistance Zone
Highlighted just below the entry point (~103,000–104,855 USD).
Price is currently testing this zone, possibly indicating a failed breakout or pullback setup.
3. Stop Loss
Placed around 104,807 USD, just above the resistance area, in a shaded purple zone.
Suggests the trade strategy is based on shorting near resistance with a tight stop.
4. Target
EA Target Point is marked at 93,159 USD.
Implies a projected downward move of about −11,264 USD (−10.76%) from entry.
5. Indicators & Tools Used
Moving Averages: 200-period (blue) and a shorter MA (red), showing bullish momentum.
Support/Resistance Zones: Multiple purple rectangles denote demand/supply areas.
Trend Lines: Used to capture recent bullish momentum; a break of the lower line may confirm a trend reversal.
6. Pattern Recognition
Series of lower highs forming after a strong uptrend could suggest bearish divergence or distribution phase.
The price appears to be stalling at the resistance area, aligning with a potential short setup.
🧾 Trade Setup Analysis:
Bias: Bearish (short position).
Entry: 104,855
Stop Loss: 104,807 (tight SL above resistance zone)
Take Profit: 93,159
Risk-Reward Ratio (RRR): Roughly 1:10, which is aggressive and would require high conviction or confirmation

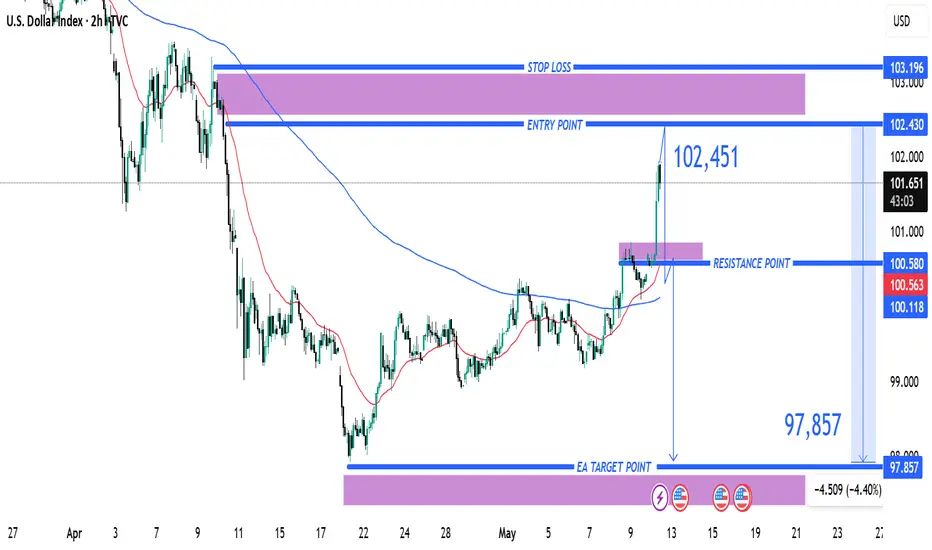
(DXY) Short Setup: Reversal Expected from Resistance Zone1. Entry Point: ~102.430
The price is currently below this level at 101.583, suggesting a potential short setup once the entry level is reached or confirmed.
2. Stop Loss: ~103.196
This is the price level where losses are limited if the trade moves against the intended direction. It's placed above a strong resistance zone.
3. Resistance Point: ~100.580
This was a previous resistance level which has now been broken, indicating a bullish push. The current price is above this, which may signal a breakout.
4. EA Target Point: ~97.857
The take-profit level, significantly lower, indicating a bearish target. This suggests a short position is intended from the entry point.
Indicators and Signals
The chart uses moving averages (likely 50 EMA and 200 EMA), and the price has surged above them, often a bullish signal.
However, the analysis seems to anticipate a reversal from the 102.430 level, expecting a drop back down toward 97.857.
The move from the current price to the target would be a 4.40% decline, a significant move for an index.
Trade Plan Summary
Trade Type: Likely a short/sell from the 102.430 level.
Risk: ~0.77 (103.196 - 102.430)
Reward: ~4.57 (102.430 - 97.857)
Risk-to-Reward Ratio: Approx. 1:6, which is favorable if the setup works out.
XAU/USD) Bullish Trade Setup – Targeting $3,506.52 with Entry atEntry Point: $3,221.19
Stop Loss: $3,169.80
Resistance Zone: Around $3,277.98 to $3,280.64
Target (TP) Point: $3,506.52 (Approx. 9.05% upside)
📊 Technical Indicators and Markings:
Moving Averages:
Likely a 50-period (blue) and 200-period (red) moving average.
Price is currently below both MAs, signaling a short-term downtrend.
Support & Resistance Zones:
Strong support around $3,207.67–$3,221.19 (entry area).
Resistance at $3,244.25–$3,280.64.
Stop-loss is strategically placed below support to limit downside risk.
Target Area:
Projected upside target is $3,506.52, with a potential 9.05% gain from the entry.
This is marked as the EA (Expert Advisor) Target Point, possibly suggesting this is a strategy from an automated trading system.
Orange Circles:
Likely indicate swing highs and lows, used to identify trend patterns and potential reversal points.
📈 Trading Idea Summary:
Bullish Setup: Buying at support, aiming for breakout above resistance to reach target.
Risk-Reward Ratio: Favorable, assuming price holds above $3,207.
Watch for Confirmation: Price needs to break above resistance around $3,280 for momentum continuation.

EUR/USD Bullish Trade Setup – Targeting 1.18089 with Strong RiskEntry Point: 1.13860
Stop Loss Zone: 1.13642 to 1.12578
Resistance Point: 1.14320
Target (TP) Point: 1.18089
🔍 Observations
Support Zone: Marked in purple near the entry and stop-loss area, suggesting a strong demand zone.
Resistance Zone: Around 1.14320, indicating a potential breakout level.
Trend: Short-term uptrend after a consolidation range.
Risk/Reward Ratio: Quite favorable, targeting a move of approximately 470+ pips (4.20% gain) from entry to target.
📊 Technical Indicators
Moving Averages:
Red (likely 20 EMA): Price recently crossed above, showing bullish momentum.
Blue (likely 50 or 200 EMA): Serving as dynamic support.
Price Action: Formation suggests a potential breakout from resistance toward the 1.18 target.
🧠 Conclusion
This is a long (buy) setup expecting a bullish breakout:
Buy entry above the support zone.
Stop-loss placed below major support (1.12578).
Target set significantly higher, aligning with prior structure or resistance at 1.18089

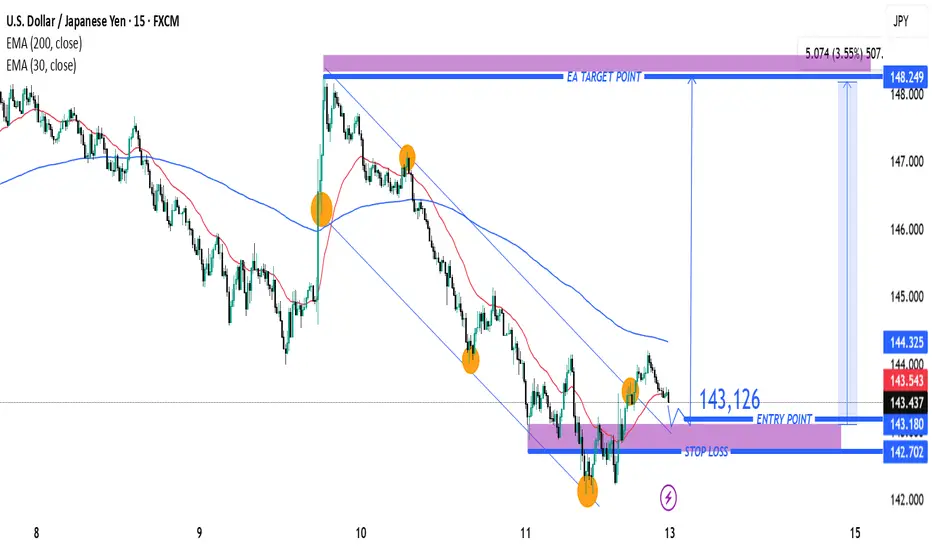
USD/JPY Bullish Breakout Setup – Entry, Stop Loss & Target AnalyPair: USD/JPY
Timeframe: 15 minutes
Indicators Used:
EMA (30-period) – Red line
EMA (200-period) – Blue line
Chart Features:
Downward channel (declining trendline)
Identified entry point, stop loss, and target
Key support/resistance zones shaded in purple
🟢 Trade Idea Summary:
🔹Entry Point: 143.126
🔹Stop Loss: 142.702
🔹Target (Take Profit): 148.249
🔹Risk/Reward Ratio: ~1:5 (Excellent R/R)
🔍 Technical Analysis:
✅ Bullish Breakout Signal
Price has broken above the descending channel and has retested the breakout area (highlighted purple zone) – a classic bullish breakout structure.
The breakout retest near 143.126 is acting as support, with potential to launch a new bullish move.
📈 Moving Average Analysis
EMA 30 is starting to flatten and curve up – indicating potential shift in momentum.
EMA 200 is still above price, but a breakout above it could strengthen the bullish case.
🔁 Support and Resistance
Strong support zone around 143.000 – 143.200 area (highlighted zone).
Major resistance and target zone is between 148.000 – 148.250.
🔔 Trade Plan Suggestion:
Go Long at or near 143.126
Place Stop Loss below support at 142.702
Target 148.249 for profit
Reasoning:
This setup offers a trend reversal potential from a downtrend to uptrend, with a clean breakout-retest-confirmation pattern. The wide take profit range gives room for extended upside as momentum builds.
⚠️ Watch For:
Reaction to the 144.325 (EMA 200) level
Increased buying volume to confirm breakout
Any re-entry into the channel (would invalidate setup)
Gold (XAU/USD) Trade Setup –Bullish RBR Zone & High Reward Poten🔹 Key Levels:
📍 Entry Point: 3211 🔵
📍 Stop Loss: 3185.109 🔴
📍 Target Point: 3300 🟢
🔹 Market Structure:
📈 The price has formed a Rally-Base-Rally (RBR) zone 📊, which is a bullish continuation pattern 🚀.
🔄 The market surged and is now consolidating within the RBR zone 📦 before potentially resuming its uptrend 📢.
🔹 Trading Plan:
✅ Buy Entry: If price retraces into the RBR zone (around 3211), consider a buy position. 🛒📊
🔻 Stop Loss: Set below the base at 3185.109 to limit risk. ⚠️🚫
🎯 Take Profit: Aiming for 3300, a major resistance level. 🎯📈
🔹 Indicators & Confluence:
📏 DEMA (9): 3223.297 (Currently acting as resistance 🛑)
💰 Risk-Reward Ratio: Favorable setup (High Reward Potential ✅)
🔹 Potential Risks:
⚠️ If price drops below 3185, it could indicate a trend reversal 🔄⛔.
🌎 Economic News & Geopolitical Factors may impact Gold prices significantly. 📰📉
🔹 Conclusion:
📊 Bullish Opportunity 🦅📈 – If the price respects the RBR zone, it may continue upwards towards 3300! 🚀💰

Gold Price Analysis:Key Supply & Demand Zones with Potential Bkl🔥 Key Levels & Zones
🔵 Supply Zone (3,135-3,140 USD) 📉
Acts as resistance where selling pressure increases.
If price reaches here, expect a potential pullback.
🟢 Demand Zone (3,085-3,095 USD) 📈
Strong support area with buying interest.
Price has tested this zone multiple times = accumulation.
🎯 Target Point (~3,167 USD) 🚀
If price breaks out, it may rally towards this level!
❌ Stop Loss (~3,080 USD) ⛔
Marked below demand zone to limit risk.
---
📊 Trend Analysis
🔹 Trend Line Break ⚡
The price broke the previous uptrend = potential reversal or deeper correction.
🔹 Market Structure 🏗️
Price consolidating inside the demand zone = possible bullish move ahead.
🔹 Double Bottom Formation (DBF) at Supply Zone 🔄
Shows failed breakout attempts = strong resistance.
---
🔍 Indicators & Insights
📌 DEMA (9 close) at 3,099 USD 📈
Price hovering around this moving average = market indecision.
---
🚦 Possible Scenarios
✅ Bullish Scenario:
If price holds the demand zone & breaks above 3,110 USD, it could rally to supply zone (~3,135 USD).
A breakout above 3,140 USD could lead to the target zone (~3,167 USD) 🚀.
❌ Bearish Scenario:
If price breaks below 3,085 USD, it may hit stop loss (3,080 USD) and continue lower.
---
🎯 Trading Plan
🟩 Long Entry ➡️ Around 3,090-3,100 USD 📊
🛑 Stop Loss ➡️ Below 3,080 USD 🚨
🎯 Target ➡️ 3,135-3,167 USD 🎉

Gold (XAU/USD) Bullish Breakout – Trade Setup & Key Levels🔍 Key Observations:
🔹 Trend Line Breakout:
📉⬇️ A downward trend line was broken, signaling a potential bullish reversal.
📈✅ The price has moved above the trend line, confirming the breakout.
🔹 Support & Resistance Zones:
🟦 Support Area: $3,000 - $3,010 (Buy Zone)
🟥 Resistance Area: $3,030 - $3,040 (Sell Pressure)
📊 Trade Setup:
✅ Buy Plan:
🔄 Wait for a pullback to the support zone (🟦 light blue area) before entering.
🎯 Target: $3,056.97 📈🏁
🛑 Stop Loss: $2,999.02 ❌🚨
📈 Indicators & Confirmation:
📊 DEMA (9-period) = $3,026.48 (near the current price, suggesting a neutral-to-bullish trend).
🔥 Conclusion:
🔵 Bullish Setup Active 🚀
⚠️ Wait for price reaction at support before entering.
❌ If price drops below $2,999, the setup is invalidated.
📌 Final Tip: Watch for a bullish candlestick pattern 📊 at support before executing the trade! 🎯

XAU/USD Analysis: Bearish Pullback Towards $3,000 SupportXAU/USD (Gold Spot vs. U.S. Dollar) Technical Analysis - 1H Chart
1. Price Action & Trend Analysis
The market has been in a strong uptrend, characterized by higher highs and higher lows.
Recently, the price faced resistance near the $3,040 level, leading to a rejection.
A pullback is currently in progress, suggesting a possible retracement to a demand zone.
2. Key Levels
Resistance Zone (Supply Zone): Around $3,040 - $3,045 where price has been rejected multiple times.
Support Zone (Demand Zone): Around $3,000 - $3,005, a previous accumulation area.
Current Price: $3,023.695
3. Market Structure & Expected Move
The price tested the resistance zone, failed to break above, and is now reacting downward.
A bearish projection (as shown in the chart) suggests a potential move toward the $3,000 - $3,005 support zone.
If the price reaches this level and finds buying pressure, we could see a reversal or continuation of the uptrend.
4. Indicators & Confluence Factors
Support-Resistance Flip: The previous support at $3,000 could act as a strong support again.
Bearish Momentum: Short-term price action suggests sellers are gaining control after rejection at resistance.
Liquidity Zones: The highlighted purple zones represent institutional order blocks where significant buy/sell orders exist.
5. Trading Plan & Strategy
Bearish Scenario: If price breaks below $3,000, we could see further downside pressure.
Bullish Scenario: A bounce from $3,000 could provide buying opportunities for another attempt at breaking $3,040.
6. Conclusion
The market is currently retracing from resistance, and a short-term bearish move is expected toward $3,000.
Traders should watch for price reaction at $3,000 to determine if it holds as support or breaks for further downside.
