IEX technical analysisStock Overview: Indian Energy Exchange Ltd (NSE: IEX) is currently priced at INR 187.62. The company operates an electronic platform for trading electricity and renewable energy certificates in India.
Key Levels:
Support: 97.55, 144.81
Upside Swing Zone: 163.83, 193.42
Possible Upside Levels: 289.85, 337.10, 397.30
Technical Indicators:
RSI: The Relative Strength Index (RSI) is at 56.85, indicating neutral to slightly bullish momentum as it is above the midpoint of 50.
Volume: The latest monthly volume is 47.25M, showing a significant increase compared to previous months, suggesting heightened trading activity and interest in the stock.
Sector and Market Context: Indian Energy Exchange Ltd operates within the energy sector, which has been experiencing volatility due to fluctuating energy prices and regulatory changes. Despite these challenges, the stock has shown resilience, maintaining a steady upward trend over the past few years. The overall market trend has been bullish, with increased investor interest in renewable energy and sustainable practices, positively impacting IEX's business model.
Risk Considerations:
Regulatory Risks: Changes in government policies and regulations related to energy trading could impact the company's operations and profitability.
Market Volatility: Fluctuations in energy prices and demand can lead to unpredictable stock movements.
Competition: The presence of other energy trading platforms and technological advancements could pose competitive risks.
Analysis Summary: Indian Energy Exchange Ltd has demonstrated strong performance within the energy sector, supported by increased trading activity and a neutral to slightly bullish RSI. Key levels indicate potential upside, but investors should be mindful of regulatory risks and market volatility. The stock's resilience and alignment with market trends in renewable energy make it a noteworthy candidate for further observation.
Search in ideas for "INDICATORS"

GBP/USD Head & Shoulders Breakdown – Bearish Trade Setup AlertPattern Breakdown:
Left Shoulder:
* Formed around April 15
* Medium-high peak
* Indicates early resistance
Head:
* Tallest peak around April 16
* Price exhaustion sign
Right Shoulder:
* Lower high formed after the head
* Matches the left shoulder
* Lower momentum from bulls
Neckline (Support):
* Horizontal blue zone
* Price has broken below
* Bearish confirmation
Trade Setup:
Entry Point:
* 🔽 1.32349
* Just below the neckline for confirmation
Stop Loss:
* ⛔ 1.32532
* Above right shoulder to limit risk
Target Point:
* 🎯 1.31200
* Based on height of the pattern
* Great Risk-to-Reward Ratio.
Indicators:
EMA 7 (Black Line)
* 📉 Current Price below EMA
* Acting as dynamic resistance.
What to Watch:
🔍 Look for strong bearish candle close below neckline
✅ Re-test of neckline as resistance can be ideal for entry
⏳ Wait for momentum confirmation if not entered yet.

EUR/USD) resistance level rejected) Analysis Read The ChaptianSMC Trading point update
updated chart provides a more refined bearish outlook for EUR/USD. Here's the idea behind this analysis:
---
Market Structure Overview:
Resistance Level: ~1.14292
Mid Support Zone: ~1.13500
Major Support (Target Point): ~1.12658
Current Price: 1.13787
---
Indicators:
EMA 200 (1.12174): Price is above the 200 EMA, indicating an overall bullish bias, but that may be weakening.
RSI (14): Around 54.37, slightly bullish but neutral—no strong momentum.
---
Trading Idea:
1. Short-Term Bullish Move:
Price is expected to rise to test the resistance level around 1.14292.
2. Bearish Reversal at Resistance:
From there, a rejection is anticipated, leading to a drop back to the mid support (~1.13500).
3. Break Below Mid Support:
If the price fails to hold the mid support zone, a breakdown is likely to continue toward the target point at 1.12658, which aligns with the previous big support level.
Mr SMC Trading point
---
Strategy Suggestion:
Sell Setup 1: At resistance (~1.14292), with confirmation like bearish candles or divergence on RSI.
Sell Setup 2: On breakdown and retest of the 1.13500 support zone.
Take Profit: Target at 1.12658.
Stop Loss: Above 1.14300 or above the most recent swing high.
---
Pales support boost 🚀 analysis follow)

Bitcoin Bearish Reversal Setup: Rising Wedge Breakdown Targeting1. Entry Point:
Marked around $86,853, this is where a potential short (sell) trade might have been initiated.
2. Stop Loss:
Placed above $88,783, protecting the trade in case the market goes against the position.
3. Target Point (Take Profit):
Aiming down toward $74,443.76, suggesting a large bearish move is anticipated.
4. EMA Indicators:
30 EMA (Red Line) at ~$84,271: Indicates short-term trend.
200 EMA (Blue Line) at ~$83,496: Indicates long-term trend.
Price is currently trading above the 200 EMA but slightly below the 30 EMA, showing mixed short-term momentum.

BTC/USD Short Setup – Triple Top Reversal with EMA Confirmation Entry Point (Sell): Around $85,699.52
Stop Loss: $86,741.44 (above resistance zone)
Target (Take Profit): $82,982.09
This provides a Risk-Reward Ratio of approximately 1:2, a commonly acceptable ratio in trading.
📈 Indicators:
EMA 30 (Red) is currently above the EMA 200 (Blue), indicating bullish momentum—but this setup anticipates a trend reversal.
If price breaks below the EMAs, that would confirm bearish strength.
🧠 Conclusion:
This setup is based on:
A strong resistance zone,
Bearish reversal pattern (triple top),
Risk management via stop loss and take profit levels.
If you're trading this:
Wait for confirmation with a bearish candlestick below the EMAs or a break of recent support.
Manage position size based on stop distance and your account risk tolerance.

Short Bitcoin
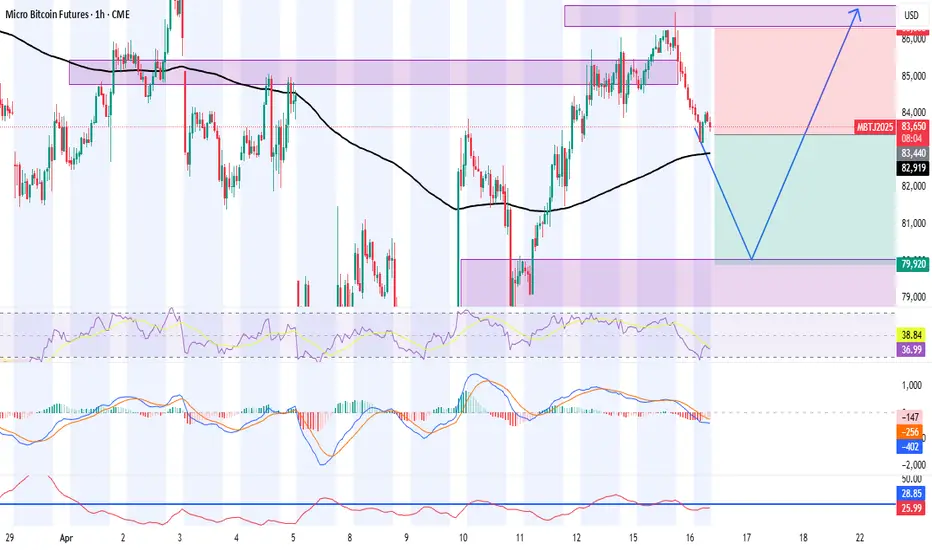
### 📉 Micro Bitcoin Futures (MBT1!) - 4H Chart Analysis 🕵️♂️
**Current Price:** $83,725
**Chart Type:** 4H (CME Futures)
---
### 🔍 Market Context:
- MBT is currently facing resistance at the **200 EMA** and the marked **supply zone** around **$84,000–$86,300**.
- After failing to break this resistance, price has started a retracement.
---
### 🧠 Trade Idea:
We're watching for a **pullback into the demand zone** between **$80,000 – $80,950**, where buyers have previously shown strength.
---
### 🔧 Strategy Setup:
- **Entry Zone:** $80,000 – $80,950 (Demand Area)
- **Stop Loss:** Below $79,920 (Structure invalidation)
- **Target 1:** $83,700 (Previous high / 200 EMA area)
- **Target 2:** $86,300 (Top of supply zone)
---
### 📊 Indicators:
- **RSI** is cooling down from overbought levels.
- **MACD** showing early signs of a bearish crossover – supporting short-term retracement thesis.
- **Volume** appears to be decreasing on the drop – suggesting potential for buyer re-entry soon.
---
### ✅ Trade Bias:
**Bullish on pullback.**
Waiting for price to retest demand and form bullish confirmation before entering long.
---
🔔 **Note:** Patience is key. Let the price come to the zone. Enter only on confirmation (e.g. bullish engulfing, pin bar, or reversal divergence on RSI/MACD).
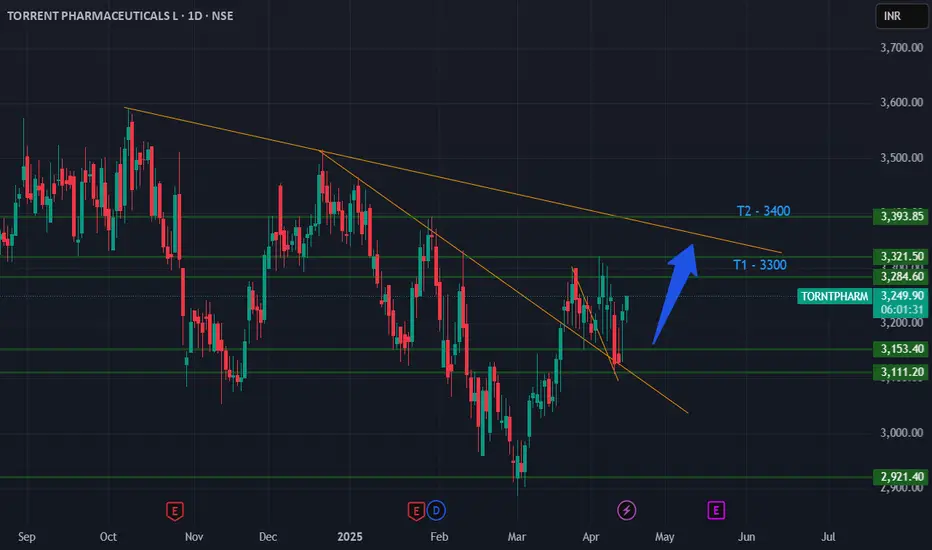
TORNTPHARM Bullish Breakout: Targeting ₹3300 & ₹3400 from CMP ₹Current Market Price (CMP): ₹3245
Target 1 (T1): ₹3300
Target 2 (T2): ₹3400
Stop Loss (SL): ₹3180 (below recent swing low for risk management)
Timeframe: Daily/Weekly
Trade Type: Long (Buy)
Technical Analysis
Trend Analysis:
- TORNTPHARM is in a steady uptrend, supported by higher highs and higher lows on the daily chart.
- The stock is trading above its 50-day and 200-day EMAs, indicating bullish momentum.
Key Levels:
- Support: ₹3200–₹3180 (recent swing low and near 50-day EMA).
- Resistance: ₹3300 (psychological level and minor resistance), ₹3400 (previous high and key resistance zone).
- A breakout above ₹3300 could accelerate momentum toward ₹3400.
Indicators:
Chart Patterns:
- The stock is forming a bullish continuation pattern (consolidation near highs), with a potential breakout above ₹3250–₹3270.
- A strong close above ₹3250 could confirm the move toward T1 and T2.
Trade Setup
Entry: Buy at CMP ₹3245 or on a breakout above ₹3250 with strong volume.
- Target 1: ₹3300 (1.7% upside, short-term target).
- Target 2: ₹3400 (4.8% upside, medium-term target).
- Stop Loss: ₹3180 (1.9% downside risk, below support zone).
- Risk-Reward Ratio: ~1:2.5 (favorable for swing trading).
Rationale
- TORNTPHARM is benefiting from strong fundamentals in the pharmaceutical sector, with consistent revenue growth and positive market sentiment.
- Technicals indicate a continuation of the bullish trend, with ₹3300 and ₹3400 as achievable targets based on prior resistance levels.
- The stop loss at ₹3180 protects against a potential trend reversal or pullback to stronger support.
Risk Management
- Position size: Limit risk to 1–2% of capital based on the ₹65 stop loss (₹3245 - ₹3180).
- Monitor for high volatility around key resistance levels (₹3300 and ₹3400).
- Exit if the stock breaks below ₹3180 on a daily close or shows signs of bearish divergence on RSI/MACD.
Additional Notes
- Sector Context: The Indian pharma sector is showing resilience due to export growth and domestic demand. TORNTPHARM’s strong product portfolio supports the bullish outlook.
- News Catalyst: Keep an eye on quarterly earnings or regulatory updates that could impact price movement.
- Time Horizon: 2–4 weeks for T1, 4–8 weeks for T2, depending on market conditions.
Disclaimer: This is not financial advice. Conduct your own research and consult a financial advisor before trading. Past performance does not guarantee future results.
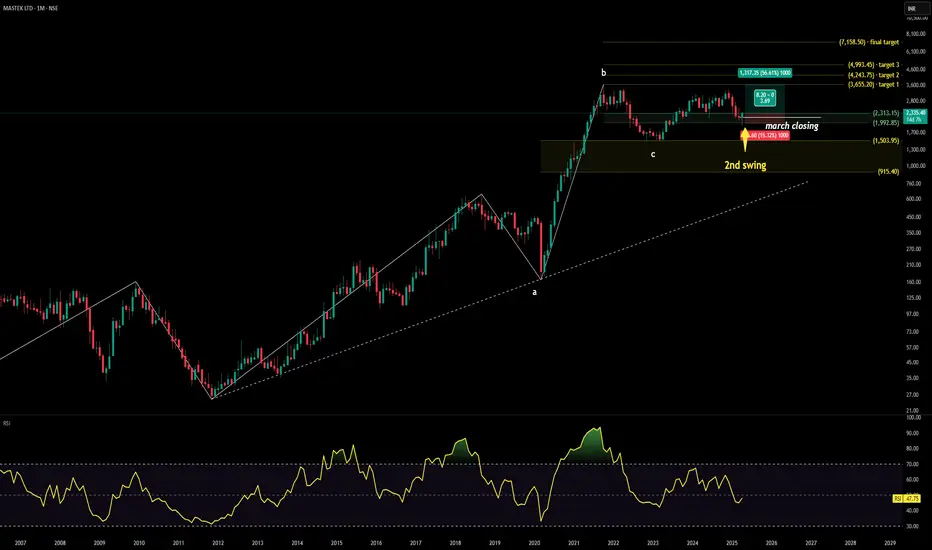
MASTEK technical analysis Stock Overview: Mastek Ltd, listed on the NSE (National Stock Exchange of India), is currently priced at ₹2,335.40. It operates in the information technology services sector, specializing in digital transformation, IT solutions, and enterprise applications for businesses globally.
Key Levels:
Support zone: ₹1,992.85
Upside swing zone: ₹2,313.15 - ₹2,335.40
Possible upside levels: ₹3,655.20, ₹4,243.75, ₹4,993.45
Technical Indicators:
Relative Strength Index (RSI): The RSI is at 47.75, indicating a neutral stance—neither oversold nor overbought. This suggests limited momentum in either direction currently but highlights a balanced demand-supply scenario.
Volume: The monthly volume is 9.94M, reflecting significant investor interest. A surge in volume near the current closing price might support potential price movements in the identified swing zone.
Sector and Market Context: Mastek operates within the IT sector, which has seen mixed performance in recent months due to global macroeconomic challenges, including inflation and tightening monetary policies. However, with increasing demand for digital transformation services globally, the sector holds long-term growth potential. On a broader market scale, Mastek’s price movement aligns with the IT sector’s recovery trend, although recent volatility has tempered the bullish outlook across global indices.
Risk Considerations: Potential risks include macroeconomic factors such as inflationary pressures and currency fluctuations that could affect IT sector margins. Market-wide uncertainties or sector-specific slowdowns in digital spending might also weigh on investor sentiment. Additionally, geopolitical developments or adverse earnings results could influence stock momentum.
Analysis Summary: Mastek Ltd presents a balanced technical outlook with neutral RSI, healthy volume trends, and established support levels. While its potential upside aligns with broader IT sector recovery trends, caution is warranted given prevailing macroeconomic risks.
ETH/USD Bearish Reversal Setup – Targeting $1,470 After ResistanPair: Ethereum / U.S. Dollar (ETH/USD)
Exchange: Coinbase
Timeframe: 15 minutes
Indicators:
EMA 30 (red line): ~1635.82
EMA 200 (blue line): ~1585.79
🟣 Key Levels & Zones
Resistance Zone (Purple Rectangle Top): Around $1,647 – previously tested and rejected.
Support Zone (Purple Rectangle Bottom): Around $1,470 – marked as the "EATARGET POINT".
Current Price: ~$1,645
📉 Bearish Breakdown Setup
Chart Pattern: There’s a potential double top or distribution zone forming near the resistance.
Projection: The price is expected to break below the smaller support zone and drop to the target zone around $1,470.67, representing an 11.13% drop.
Measured Move Tool: Indicates a bearish price target if the price breaks down from the current consolidation.
✅ Confluence
Price is currently hovering under resistance.
EMAs show short-term bullish momentum but could flatten if breakdown confirms.
Support near $1,635 is being tested – a break below could trigger the expected drop.
⚠️ Trading Implications
Short Setup: A trader might look to enter short around $1,647 if breakdown confirmation occurs.
Stop Loss: Just above the resistance zone (~$1,650+).
Take Profit: Near $1,470 zone.

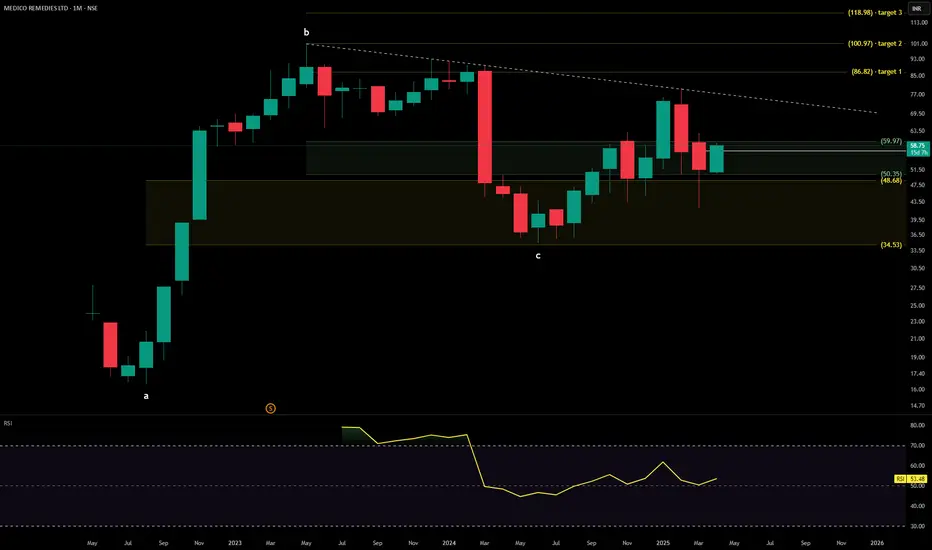
MEDICO REMEDIES technical analysisMedico Remedies Ltd. (NSE: MEDICO) is currently priced at 58.75 INR. The company specializes in manufacturing and marketing pharmaceutical formulations across various therapeutic segments.
Key Levels: Support levels are identified at 50.23 INR and 34.53 INR, suggesting potential price stabilization at these thresholds. The upside swing zone lies between 59.97 INR and 62.00 INR, indicating an area of possible upward momentum. Key upside levels are noted at 86.82 INR, 100.97 INR, and 118.98 INR, which could act as benchmarks for further price movements.
Technical Indicators: The Relative Strength Index (RSI) currently stands at 53.48, reflecting neutral momentum. RSI gauges the speed and magnitude of price changes, with levels above 70 indicating overbought conditions and below 30 signifying oversold conditions. Recent trading volume is recorded at 7.86 million, showcasing moderate activity that suggests the presence of investor interest and the potential for confirming price trends.
Sector and Market Context: Medico Remedies operates in the pharmaceutical sector, known for its resilience and strong demand. Recent trends in the pharmaceutical industry highlight growth potential due to heightened focus on health and wellness globally. While broader market volatility has influenced stocks across sectors, the pharmaceutical industry has demonstrated relative stability, outperforming several other sectors.
Risk Considerations: The stock faces risks such as regulatory changes, market competition, and dependency on global economic health. Factors like adverse clinical outcomes or shifts in healthcare policies could disrupt growth. Additionally, broader market risks, including interest rate fluctuations, inflation, and geopolitical developments, remain influential.
Analysis Summary: Medico Remedies Ltd. portrays a balanced technical outlook with neutral momentum and moderate upside potential if it surpasses the swing zone. The stock's alignment with a stable and resilient pharmaceutical sector supports growth prospects, although caution is warranted due to regulatory and market risks. Overall, the analysis suggests monitoring its progression for further insights without leaning towards a specific buy/sell directive.
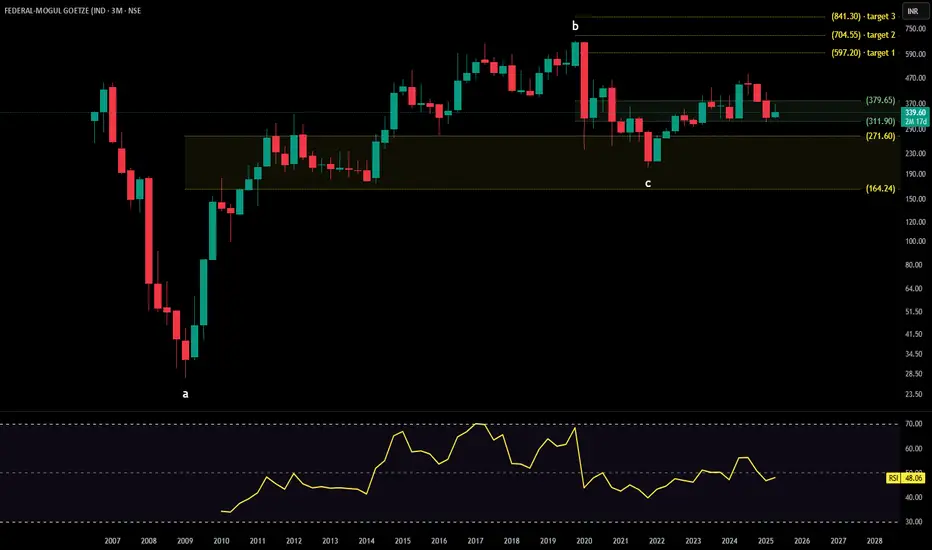
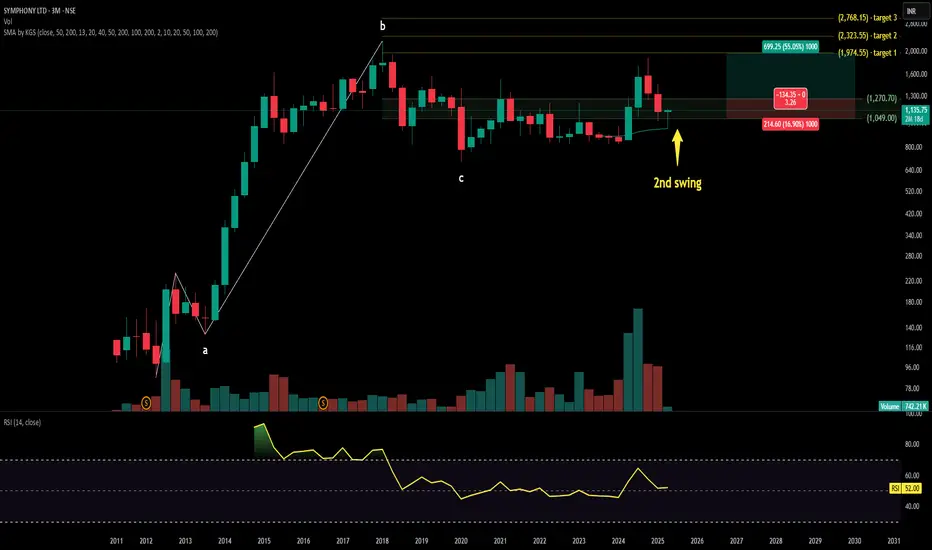
FEDERAL MOGUL GOETZE technical analysisStock Overview: Symphony Ltd., listed on the NSE, is currently trading at INR 1,135.75. The company specializes in manufacturing air coolers and industrial cooling solutions, recognized for its energy-efficient and innovative products.
Key Levels: The stock has a key support level at INR 576.15. The upside swing zone lies between INR 925.15 and INR 1,270.70. Possible upside levels are INR 1,974.55, INR 2,323.55, and INR 2,768.15.
Technical Indicators: The Relative Strength Index (RSI) is at 50.24, indicating neutral momentum as it is neither in the overbought nor oversold range. The trading volume is moderate at 742.21K, reflecting steady market participation.
Sector and Market Context: Symphony Ltd. operates within the consumer goods sector, particularly in the cooling solutions market. The sector has experienced consistent demand due to rising temperatures and a growing preference for energy-efficient products. Despite macroeconomic challenges like inflation and fluctuating interest rates, the consumer goods sector has shown resilience, supported by innovation and sustainability initiatives. Symphony’s performance aligns with these sectoral trends, maintaining stability amidst broader market volatility.
Risk Considerations: Key risks include potential fluctuations in raw material costs, which could impact production expenses. Additionally, heightened competition within the cooling solutions market and shifts in consumer preferences may influence market share. Broader macroeconomic factors, such as inflation, interest rate changes, and geopolitical events, could also affect stock performance. Regulatory changes and environmental policies may pose operational and financial challenges.
Analysis Summary: Symphony Ltd. demonstrates a stable performance with clearly defined support and upside levels. The RSI indicates neutral momentum, while trading volume reflects moderate activity. The flat MA lines suggest a consolidation phase. The stock’s alignment with sector trends highlights its resilience, though investors should remain cautious of risks such as raw material price volatility and competitive pressures. Overall, Symphony Ltd. presents a balanced outlook, with no direct buy or sell recommendations provided.
BTC/USD) breakout up trand analysis Read The ChaptianMr SMC Trading point update
bullish analysis of Bitcoin (BTC/USD) on the 4-hour timeframe, showing a potential breakout and rally scenario. breakdown:
---
1. Market Structure:
Downtrend Channel: Price has been moving within a falling channel.
Double Bottom Pattern: Marked by two green arrows — a bullish reversal signal.
Breakout Attempt: Price is testing the upper trendline and 200 EMA (~$83,952), suggesting possible breakout.
---
2. Key Zones:
FVG (Fair Value Gap): Around $78,678 — a demand zone where price could retest before moving higher.
Breakout Confirmation Zone: ~$85,130 — breaking above this with volume signals strength.
Target Point: $95,206 — an upside target projecting ~31.77% gain from the breakout.
---
3. Indicators:
200 EMA: Currently acting as resistance. Break above it confirms bullish momentum.
RSI: Around 60 — pointing upward with bullish divergence from recent lows, showing increasing buying pressure.
---
4. Scenarios:
Scenario 1 (Bullish Continuation):
Breaks above trendline and 200 EMA.
Retest (optional) and then heads toward $95,206 target.
Scenario 2 (Retest First):
Price dips into the FVG/demand zone.
Finds support and launches upwards, confirming a strong base.
Mr SMC Trading point
---
Summary of the Idea:
This is a buy setup on breakout or on pullback:
Aggressive Entry: Break and close above $85,130.
Safe Entry: Pullback into $78,678 area (FVG).
Target: $95,206
Risk Zone: Below $78,000 (invalidates bullish structure).
Pales support boost 🚀 analysis follow)

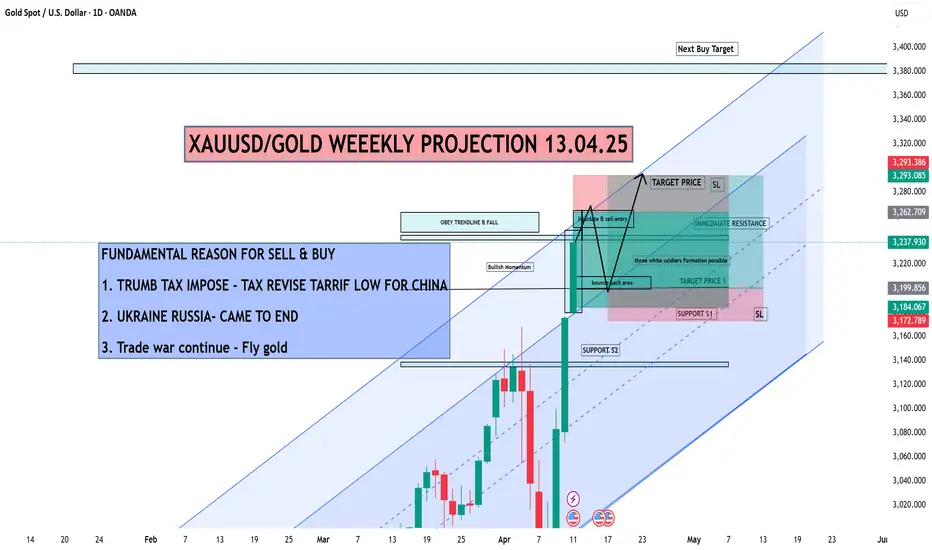
XAUUSD/GOLD WEEKLY PROJECTION 13.04.25Trend: Price is following a clear bullish trend channel.
Bullish Indicators:
"Three White Soldiers" candlestick pattern suggests continued bullish momentum.
"Bounce back area" suggests a buying opportunity after a dip.
Price Targets:
Target Price 1: Around 3,200–3,240
Main Target Price: Near 3,293
Support Zones:
Support S1: ~3,184
Support S2: ~3,140
Resistance:
Immediate Resistance: Just below the target price zone.
SYMPHONY technical analysis Stock Overview: Symphony Ltd., listed on the NSE, is currently trading at INR 1,135.75. The company specializes in manufacturing air coolers and industrial cooling solutions, recognized for its energy-efficient and innovative products.
Key Levels: The stock has a key support level at INR 576.15. The upside swing zone lies between INR 925.15 and INR 1,270.70. Possible upside levels are INR 1,974.55, INR 2,323.55, and INR 2,768.15.
Technical Indicators: The Relative Strength Index (RSI) is at 50.24, indicating neutral momentum as it is neither in the overbought nor oversold range. The trading volume is moderate at 742.21K, reflecting steady market participation.
Sector and Market Context: Symphony Ltd. operates within the consumer goods sector, particularly in the cooling solutions market. The sector has experienced consistent demand due to rising temperatures and a growing preference for energy-efficient products. Despite macroeconomic challenges like inflation and fluctuating interest rates, the consumer goods sector has shown resilience, supported by innovation and sustainability initiatives. Symphony’s performance aligns with these sectoral trends, maintaining stability amidst broader market volatility.
Risk Considerations: Key risks include potential fluctuations in raw material costs, which could impact production expenses. Additionally, heightened competition within the cooling solutions market and shifts in consumer preferences may influence market share. Broader macroeconomic factors, such as inflation, interest rate changes, and geopolitical events, could also affect stock performance. Regulatory changes and environmental policies may pose operational and financial challenges.
Analysis Summary: Symphony Ltd. demonstrates a stable performance with clearly defined support and upside levels. The RSI indicates neutral momentum, while trading volume reflects moderate activity. The flat MA lines suggest a consolidation phase. The stock’s alignment with sector trends highlights its resilience, though investors should remain cautious of risks such as raw material price volatility and competitive pressures. Overall, Symphony Ltd. presents a balanced outlook, with no direct buy or sell recommendations provided.
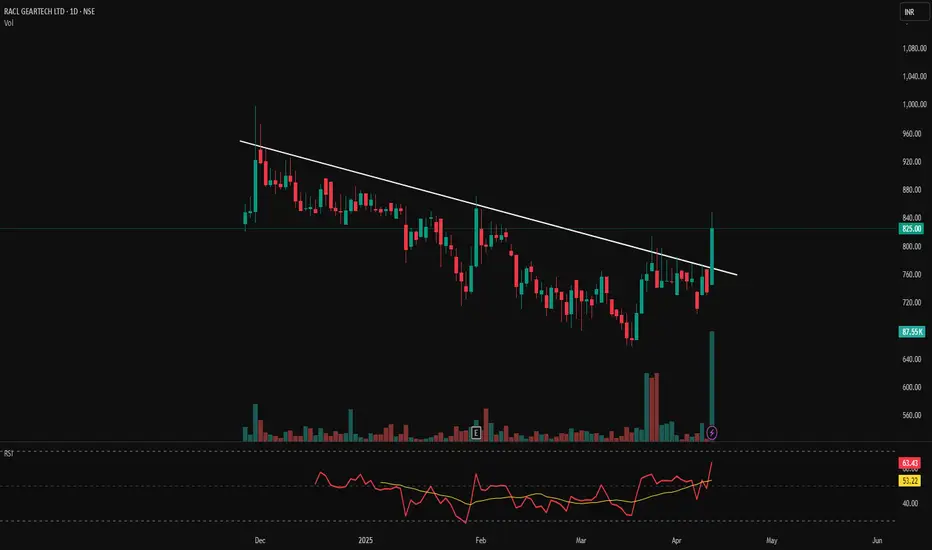
RACL Geartech Ltd - Trendline Breakout with Volume ConfirmationRACL Geartech Ltd – Trendline Breakout with Volume Confirmation! 🚀🔥
📅 Date: April 12, 2025
📊 Chart Overview:
RACL Geartech has shown a strong bullish breakout above a long-standing descending trendline resistance, backed by a massive volume surge—a classic breakout confirmation signal.
📌 Key Levels:
📈 Breakout Level (Previous Resistance): ₹760
✅ New Support: ₹760
🔼 Resistance Zones Ahead: ₹860 ➡️ ₹900 ➡️ ₹950
⚠️ Stop-loss for Swing Position: ₹740 (below breakout + trendline)
📈 Technical Indicators:
📊 Volume Spike: Today’s volume (87.5K) is significantly higher than the recent average, indicating strong buying interest.
📉 RSI (Relative Strength Index): At 63.43, showing positive momentum with potential room before entering overbought territory.
📉 MACD-like indicator (yellow line vs red line crossover): Clear upward crossover—bullish shift in momentum.
📏 Trendline drawn from December 2024 highs to recent lower highs—now convincingly broken.
🧠 Trade Strategy:
🎯 Consider buying on dips near ₹770–₹785 if retest occurs.
🛡 SL: ₹740
🎯 Targets: ₹860 ➡️ ₹900 ➡️ ₹950
📌 Disclaimer: This chart is for educational and analytical purposes. Always conduct your own analysis or consult a registered financial advisor before taking any trading/investment decision.
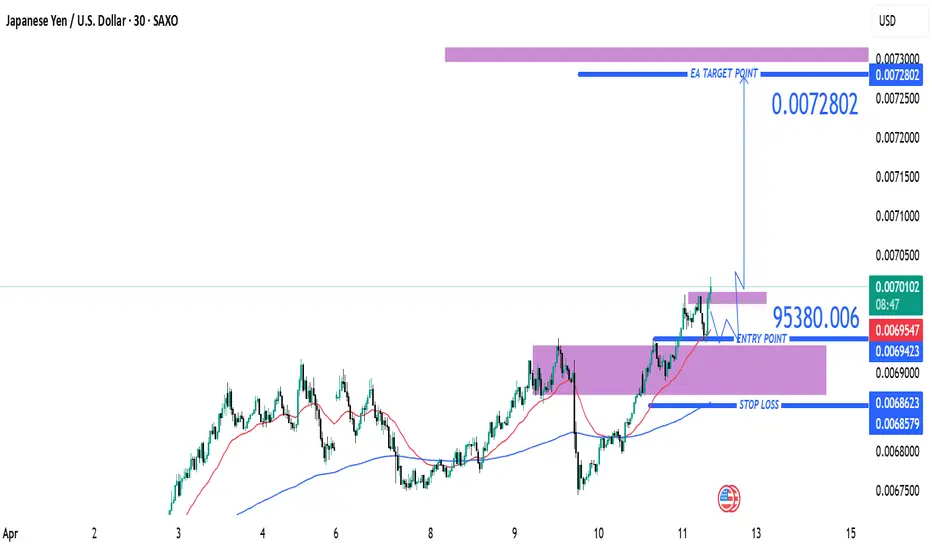
JPY/USD Bullish Breakout – Targeting 0.0072802 After Retest (AprEntry Point: ~0.0069539
Take Profit (TP): 0.0072802
Stop Loss (SL): 0.0068579
Risk/Reward Ratio:
Risk: ~0.000096
Reward: ~0.000326
Approx. R/R = 1:3.4 → Excellent reward-to-risk
🧠 Strategy Insight
Trade Type: Long (Buy)
This is a bullish continuation setup aiming for higher highs after a breakout from a consolidation range.
Price Action:
Strong bullish trend visible since early April.
Price consolidated in a purple zone (likely a demand/support zone), then broke out and is now retesting that zone — classic breakout and retest pattern.
Indicators:
Two moving averages (likely 50 EMA in red and 200 EMA in blue) are in bullish alignment:
Price is above both EMAs.
50 EMA is above the 200 EMA, confirming bullish momentum.
Support & Resistance Zones:
Entry near previous resistance turned support — solid structure for long positioning.
TP zone near prior highs, possibly based on historical resistance (purple shaded zone above).
SL placed below the most recent demand zone and 200 EMA — a conservative and safe stop.
🔁 Trade Scenarios
✅ Bullish Outcome (Preferred):
Price respects the retest zone and pushes toward 0.0072802.
Strong momentum or fundamental catalysts could support the breakout continuation.
❌ Bearish Risk:
Price dips below the entry and breaks the demand zone and EMAs.
SL at ~0.0068579 helps manage this risk effectively.
🧩 Summary
This is a well-structured trend continuation long setup with textbook breakout-retest logic. The high R/R makes it an attractive opportunity assuming bullish conditions persist.
📌 Suggested Title
"JPY/USD Long Trade Setup – Breakout Retest Toward 0.0072802 (April 11, 2025)"
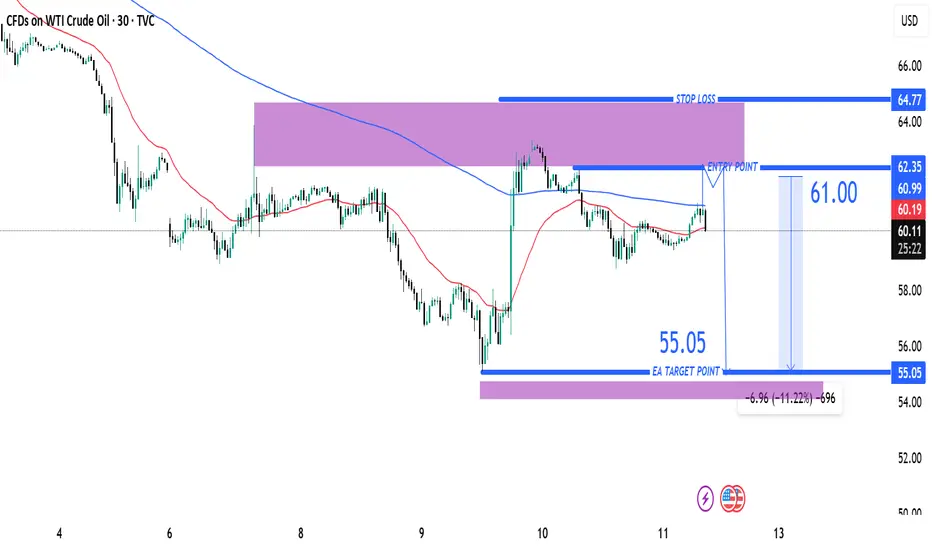
USOIL Short Trade Idea – Targeting $55.05 from $61.00Entry Point: ~61.00 USD
Stop Loss (SL): 64.77 USD
Target (TP): 55.05 USD
Risk/Reward Ratio: Favorable
Risk: ~3.77 USD
Reward: ~5.95 USD
Approximate R/R ratio: 1:1.58
🧠 Strategy Insight
Trend Context:
Prior to the entry zone, price shows a strong downtrend.
The price retraced upward into a resistance zone (highlighted in purple).
The setup suggests a short position anticipating rejection from this zone.
Indicators:
Moving Averages (red & blue):
Likely 50 EMA and 200 EMA showing bearish alignment (price mostly under both).
Resistance Zone:
The purple shaded region represents a supply zone, where price previously reversed.
Entry Zone Analysis:
Entry just below a recent rejection candle.
It's a conservative spot to catch a move back in the direction of the dominant trend.
Target Zone (55.05):
Likely based on a recent support level or demand zone from earlier price action.
Matches previous lows.
🔁 Possible Scenarios
✅ Bearish Scenario (Ideal Outcome):
Price gets rejected from the resistance zone and continues the downtrend toward the target at 55.05.
❌ Bullish Scenario (Risk):
Price breaks above 61.00 and continues toward 64.77, invalidating the short setup.
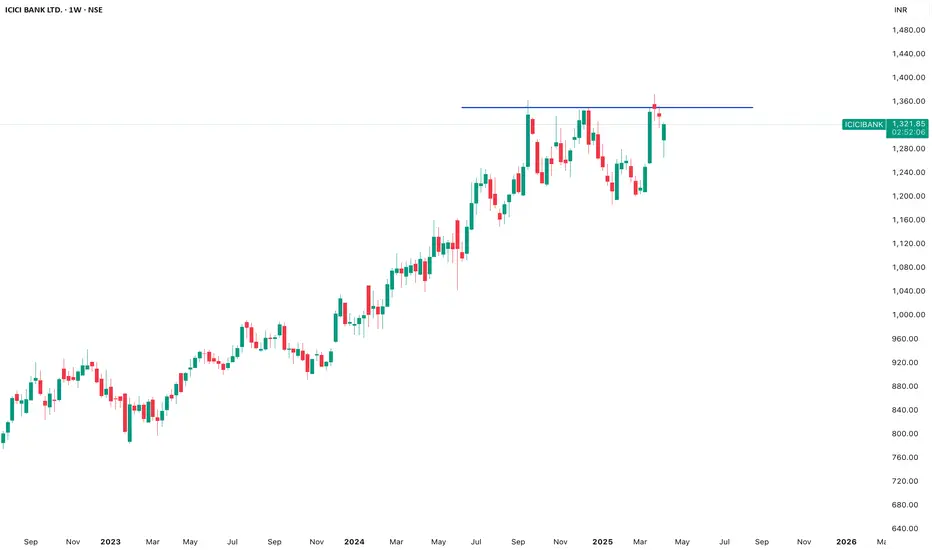
### ICICI Bank Price Analysis (April 11, 2025)### ICICI Bank Price Analysis (April 11, 2025)
#### **Current Price and Recent Trends**
- **Latest Price (April 8, 2025):** ₹1,299.90
- **Intraday Movement (April 8, 2025):**
- **Open:** ₹1,299.85
- **High:** ₹1,310.05
- **Low:** ₹1,287.35
- **Close:** ₹1,299.90 (+0.96% from the previous close).
- **52-Week Range:** ₹1,186.00 – ₹1,373.00
#### **Performance Metrics**
- **Short-Term Trends:**
- April 7, 2025: Declined by -3.58% to ₹1,287.55.
- April 4, 2025: Rose by +0.43% to ₹1,335.30.
- **Medium-Term Trends:**
- March saw fluctuations between ₹1,311 and ₹1,373.
- **Long-Term Trends:**
- ICICI Bank has shown consistent growth over the past year, supported by strong fundamentals.
#### **Fundamental Insights**
- ICICI Bank remains one of the top-performing private sector banks in India:
- **Market Cap:** Over ₹9 lakh crore.
- **P/E Ratio:** Competitive compared to peers in the banking sector.
- **Strong Asset Quality:** Stable NPA ratios and robust loan growth.
#### **Technical Analysis**
- **Support Levels:** ₹1,287 (recent low) and ₹1,265 (strong support from April trends).
- **Resistance Levels:** ₹1,310–₹1,320 (near-term resistance).
- **Moving Averages:**
- Trading slightly below the SMA20 but above SMA50 indicates potential consolidation before further movement.
- **Momentum Indicators:**
- RSI suggests neutral momentum with room for upward movement if market sentiment improves.
#### **Sector Outlook**
The banking sector is expected to benefit from:
- Increased credit growth due to economic recovery.
- Stable interest rate environment supporting profitability.
#### **Strengths**
1. Consistent performance despite market volatility.
2. Strong fundamentals with diversified revenue streams.
3. Resilient asset quality and loan book growth.
#### **Weaknesses**
1. Short-term volatility due to global banking uncertainties.
2. Resistance near ₹1,310 may limit upside in the immediate term.
### Conclusion:
ICICI Bank remains a strong long-term investment option due to its robust fundamentals and leadership in the private banking space. However, short-term traders should monitor resistance levels around ₹1,310 and support near ₹1,287 for trading opportunities.
LAL PATH LAB technical analysisStock Overview: Dr. Lal Path Labs Ltd., NSE, current price: INR 2,667.75. Dr. Lal Path Labs Ltd. is a leading diagnostic and healthcare service provider in India, offering a wide range of tests and services.
Key Levels:
Support levels: INR 2,068.65, INR 1,476.85.
Upside swing zone: INR 2,710.75, INR 2,348.15.
Possible upside levels: INR 3,938.90, INR 4,530.70, INR 5,284.50, INR 7,461.35.
Technical Indicators:
RSI (Relative Strength Index) is at 50.20, indicating a neutral momentum.
Volume is at 2.6M, showing moderate trading activity.
MA (Moving Average) lines indicate the stock is currently above the long-term moving average, suggesting a potential upward trend.
Sector and Market Context: Dr. Lal Path Labs Ltd. operates in the healthcare sector, which has shown resilience and growth potential, especially in the post-pandemic era. The overall market trends indicate a cautious optimism with healthcare stocks generally performing well due to increased demand for diagnostic services.
Risk Considerations: Potential risks include regulatory changes, market volatility, and competition within the healthcare sector. Economic downturns or adverse events could also impact stock performance.
Analysis Summary: Dr. Lal Path Labs Ltd. shows a balanced technical outlook with key support levels providing a safety net and potential upside levels indicating room for growth. The stock's performance is aligned with sector trends, but investors should remain cautious of market conditions and sector-specific risks.

Gold (XAU/USD) 15-Min Short Setup: Bearish Reversal from ResistaEntry Point: $3,127.10
Stop Loss: $3,141.53
Target Point (Take Profit): $3,080.62
Technical Indicators:
EMA 30 (red line): $3,111.98 – showing short-term trend
EMA 200 (blue line): $3,056.92 – showing long-term trend
Setup Explanation:
This is a short/sell setup based on the following:
The price action has hit a resistance zone near $3,127 and shows signs of rejection.
The setup assumes that the price will reverse from this zone and head lower.
The Risk-to-Reward Ratio appears decent, aiming for a move of about -1.45% (-$45.34).
Current Status:
Price is currently around $3,119.69, below the entry point.
A slight bounce

BANK NIFTY 50700BANK NIFTY 50700
Price Action: Bank Nifty closed at 51,502.70, down 0.18%
Technical Indicators:
RSI (14): Neutral at 53.92.
MACD: Showing a buy signal.
Stochastic RSI: Overbought at 99.29, suggesting caution.
ADX: Indicates a weak trend

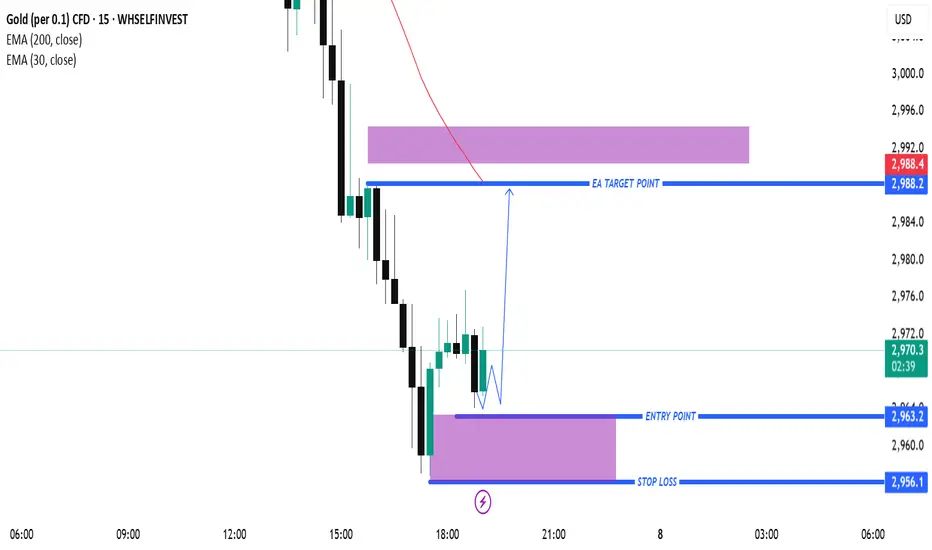
Gold (XAU/USD) Intraday Buy Setup – Demand Zone Reversal with 3.Timeframe: Appears to be intraday (possibly 5-15 minutes).
Indicators:
EMA 30 (red): Showing recent bearish momentum.
EMA 200 (blue): Positioned above, indicating a longer-term bearish trend.
Candlestick Pattern: After a steep drop, price shows signs of consolidation and potential reversal.
📌 Trade Setup (Long/Bullish Bias)
Entry Zone: Around $2,963.2
Price is expected to pull back into this purple demand zone before moving up.
Stop Loss (SL): $2,956.1
Placed below the support zone to limit downside risk.
Take Profit (TP / Target Point): $2,988.2
A previous supply zone near the EMA 30, where selling pressure could return.
📊 Risk-Reward Ratio
Risk: $2,963.2 - $2,956.1 = $7.1
Reward: $2,988.2 - $2,963.2 = $25
RRR (Reward-to-Risk Ratio): ~3.5:1
This is a solid ratio, suggesting a high-potential trade if the setup plays out.
📈 Bullish Scenario
Price pulls back into the demand zone (entry).
A bullish candlestick confirmation or wick rejection could trigger a buy.
Target is the previous structure + EMA zone.
Gold (XAUUSD) Reversal Setup: Buy Opportunity from Demand Zone t GOLD (XAUUSD)
Timeframe: 30-minute
Indicators:
EMA 30 (Red): 3,000.22
EMA 200 (Blue): 3,042.92
🔍 Price Action & Zones
Current Price: 2,982.27
Support Zone (Demand Zone): ~2,940.27 (highlighted in purple, labeled as STOP LOSS)
Resistance Zone (Supply Zone): ~3,040.17–3,042.92 (labeled as EA TARGET POINT)
📈 Trade Idea (Based on Drawing)
Strategy: Buy from demand zone, targeting supply zone
Entry: Near 2,940.27
Stop Loss: Slightly below 2,940.27
Target: ~3,040.17
Risk to Reward: ~1:2.6 (visually)
📊 EMA Dynamics
Bearish Bias in the Medium Term: Price is trading below the 200 EMA, indicating an overall bearish trend.
Short-Term Weakness: The price has also dropped below the 30 EMA, confirming bearish momentum in the short run.
🔄 Possible Scenario
Price is currently heading back down toward the demand zone, where a bounce is anticipated.
If it respects that zone, we may see a reversal toward the target zone at ~3,040.
If it breaks below 2,940, the setup would be invalidated (stop loss hit).
⚠️ Things to Watch
Rejection or support confirmation at 2,940 zone is key before entry.
Be cautious of continued bearish momentum if economic news or global risk sentiment shifts.
Look for bullish reversal patterns (e.g. hammer, bullish engulfing) at the demand zone for confirmation.
