HIKALHIKAL LTD, NSE Current Price: ₹401.20 Pharmaceutical and agrochemical company specializing in crop protection, specialty chemicals, and pharmaceuticals.
Key Levels:
Support (Yellow Zone): ₹318.60 - ₹375.75
Swing Zone (Green Zone): ₹375.75 - ₹414.45
Target Levels: T1: ₹635.40, T2: ₹750.50, T3: ₹897.10, Final Target: ₹1,320.50
Technical Indicators:
RSI: Neutral to slightly bullish at 58.52.
Volume: Moderate at 102.99K, reflecting steady market interest.
Moving Averages (MA): 200-MA at ₹192.82 acts as long-term support; shorter MAs indicate consistent bullish trends.
Sector Context: The pharma and agrochemical industries remain resilient. Broader market trends show cautious optimism, favoring essential and innovative sectors.
Risk Considerations:
Market volatility and investor sentiment shifts.
Regulatory changes in pharma/agrochemicals.
Global factors like inflation or supply chain issues.
Analysis Summary: HIKAL LTD shows neutral-to-bullish potential. Support and target zones offer insights for price movements. Regulatory and market risks should be considered before any action. This is not a buy/sell recommendation.
Search in ideas for "INDICATORS"

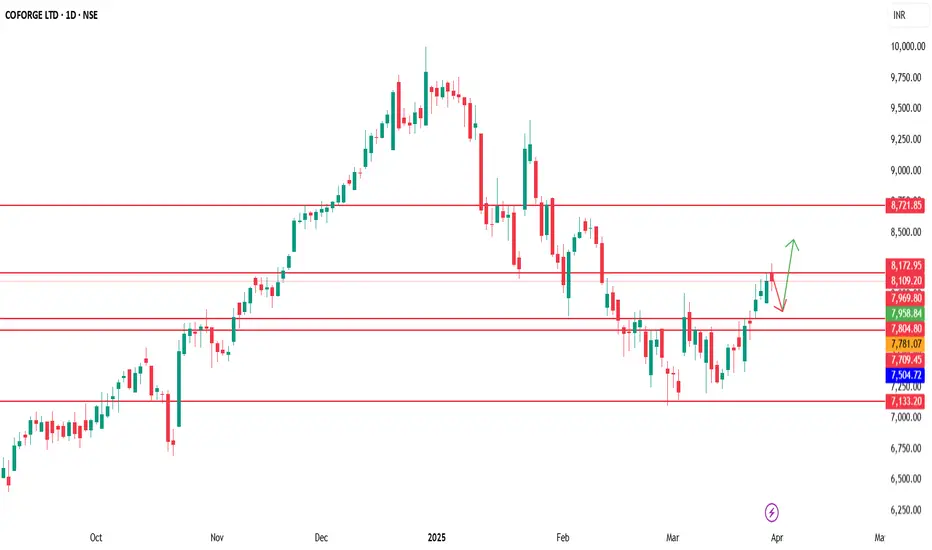
Coforge – Key Levels & Market Outlook📌 Coforge (NSE: COFORGE) – Key Levels & Market Outlook
Coforge (COFORGE) is currently trading above a strong support level at ₹7,800. If the stock sustains this level and breaks past the ₹8,200 resistance, it could rally toward the ₹8,500-₹8,600 target zone. However, if it fails to hold ₹7,800, the next key support lies at ₹7,700, and a breakdown below this could trigger further downside toward ₹7,400.
🔍 Technical Indicators:
📊 Supertrend (10,3): The stock remains in a buy mode, indicating a bullish trend as long as it holds ₹7,800.
📈 Fibonacci Retracement: ₹8,200 aligns with a key retracement level; a breakout above this zone could strengthen the bullish outlook.
📉 MACD (Moving Average Convergence Divergence): On the verge of a bullish crossover, signaling a potential upside move.
📊 RSI (Relative Strength Index): Currently near 56; a move above 60-65 would confirm strong buying momentum.
📌 Key Levels to Watch:
✅ Support Level: ₹7,800
📍 Resistance Level: ₹8,200
🚀 Upside Targets: ₹8,500-₹8,600
⚠ Breakdown Risk: Below ₹7,700, the stock could decline toward ₹7,400.
A decisive move above ₹8,200 could fuel further bullish momentum, pushing Coforge toward ₹8,500-₹8,600. On the downside, a break below ₹7,700 may lead to extended selling pressure. Keep an eye on IT sector performance, global market trends, and institutional activity for further confirmation.
LTIMindtree – Key Levels & Market Outlook📌 LTIMindtree (NSE: LTIM) – Key Levels & Market Outlook
LTIMindtree (LTIM) is currently holding above the critical support zone of ₹4,470-₹4,450. If the stock sustains above this level and breaks past the ₹4,680-₹4,710 resistance zone, it could trigger an upside move toward ₹4,870+. However, a breakdown below ₹4,450 may lead to further downside pressure.
🔍 Technical Indicators:
📊 Ichimoku Cloud: The stock is trading near the cloud resistance; a breakout above ₹4,710 would confirm bullish momentum.
📈 VWAP (Volume Weighted Average Price): Price is currently hovering near VWAP, suggesting accumulation at lower levels.
📉 Stochastic RSI: Near 55, indicating neutral momentum; a move above 70 would confirm strong bullish strength.
📊 Open Interest & Delivery Volume: Increasing delivery volume suggests accumulation, supporting a potential breakout above resistance.
📌 Key Levels to Watch:
✅ Support Zone: ₹4,470-₹4,450
📍 Resistance Zone: ₹4,680-₹4,710
🚀 Upside Target: ₹4,870+
⚠ Breakdown Risk: Below ₹4,450, the stock may see downside toward ₹4,380.
A sustained move above ₹4,710 could accelerate buying momentum, leading toward ₹4,870+, while failure to hold ₹4,450 could invite selling pressure. Keep an eye on IT sector trends, global market cues, and institutional activity for further confirmation.

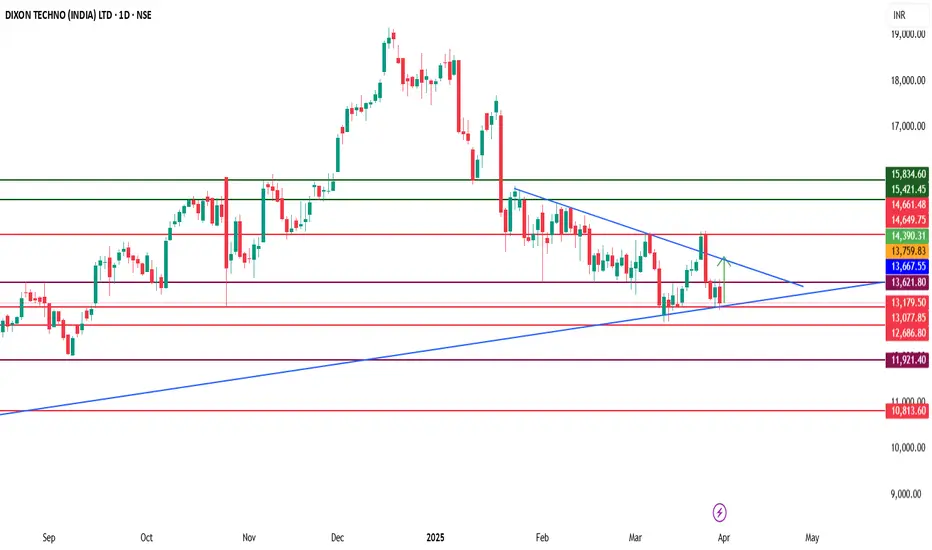
Dixon Technologies: Key Levels & Market Outlook📌 Dixon Technologies (NSE: DIXON) – Key Levels & Market Outlook
Dixon Technologies (DIXON) is currently trading above a crucial support zone of ₹13,000-₹12,800. If the stock sustains this level and breaks above the ₹13,630 resistance, it could see an upside move toward ₹14,000-₹14,600. However, a breakdown below ₹12,800 may lead to further downside pressure.
🔍 Technical Indicators:
📊 Supertrend (10,3): The indicator is currently in a buy mode, supporting a bullish outlook as long as ₹12,800 holds.
📈 Fibonacci Retracement: The ₹13,630 resistance aligns with a key retracement level; a breakout above this could confirm strength.
📉 ADX (Average Directional Index): Currently at 23, suggesting a developing trend; a move above 25-30 would indicate strong bullish momentum.
📊 OBV (On-Balance Volume): Rising OBV signals strong accumulation, supporting an upward breakout scenario.
📌 Key Levels to Watch:
✅ Support Zone: ₹13,000-₹12,800
📍 Resistance Level: ₹13,630
🚀 Upside Targets: ₹14,000-₹14,600
⚠ Breakdown Risk: Below ₹12,800, the stock may slide toward ₹12,500.
A sustained move above ₹13,630 could accelerate buying momentum, pushing Dixon toward ₹14,000-₹14,600. On the other hand, a break below ₹12,800 may invite selling pressure. Keep an eye on sector trends, demand in electronics, and institutional activity for further confirmation.
Kalyan Jewelers – Key Levels & Market Outloo📌 Kalyan Jewelers (NSE: KALYANKJIL) – Key Levels & Market Outlook
Kalyan Jewelers (KALYANKJIL) is currently holding above a strong support level at ₹460. If the stock sustains above this level, it could witness a breakout, targeting ₹506-₹523 in the near term. However, if it fails to hold ₹460, the next major support is at ₹450, and a breakdown below this level may lead to a further decline toward ₹433.
🔍 Technical Indicators:
📊 Bollinger Bands: The stock is trading near the middle band, indicating a neutral trend. A breakout above ₹480 could push it toward the upper band near ₹506.
📈 RSI (Relative Strength Index): Currently around 55; a move above 60 would confirm bullish momentum.
📉 MACD (Moving Average Convergence Divergence): On the verge of a bullish crossover, signaling potential upside strength.
📊 Volume & Open Interest: Rising volume near key levels could confirm strength, while lower volume on dips suggests weak selling pressure.
📌 Key Levels to Watch:
✅ Support Level: ₹460
📍 Upside Targets: ₹506-₹523
🚨 Breakdown Level: ₹450
📉 Downside Target: ₹433 if ₹450 support fails.
A sustained move above ₹480 could strengthen bullish momentum, leading to ₹506-₹523. On the flip side, a break below ₹450 may accelerate selling toward ₹433. Keep an eye on sector trends, gold prices, and institutional activity for additional confirmation.

Godrej Consumer Products – Key Levels & Market O📌 Godrej Consumer Products (NSE: GODREJCP) – Key Levels & Market Outlook
Godrej Consumer Products (GODREJCP) is currently holding above a strong support level at ₹1074. If the stock sustains above this level, it could witness a breakout once it trades in the ₹1205-₹1210 zone, potentially leading to an upside move toward ₹1300. However, failure to hold ₹1074 may trigger further downside.
🔍 Technical Indicators:
📊 Bollinger Bands: The stock is moving toward the upper band, indicating a potential breakout above ₹1210.
📈 Fibonacci Retracement: The ₹1205-₹1210 zone aligns with a key retracement level, making it a crucial breakout point.
📉 RSI (Relative Strength Index): Currently near 58; a move above 60-65 could confirm strong bullish momentum.
📊 Volume & Delivery Percentage: Increasing volume near resistance suggests accumulation; a breakout with high volume would confirm strength.
📌 Key Levels to Watch:
✅ Support Level: ₹1074
📍 Breakout Zone: ₹1205-₹1210
🚀 Upside Target: ₹1300
⚠ Breakdown Risk: Below ₹1074, the stock could test lower levels around ₹1050.
A sustained move above ₹1210 could trigger strong buying interest, leading to ₹1300 in the near term. However, failure to cross ₹1205-₹1210 may result in sideways movement or selling pressure. Keep an eye on sector performance, market sentiment, and institutional activity for confirmation.

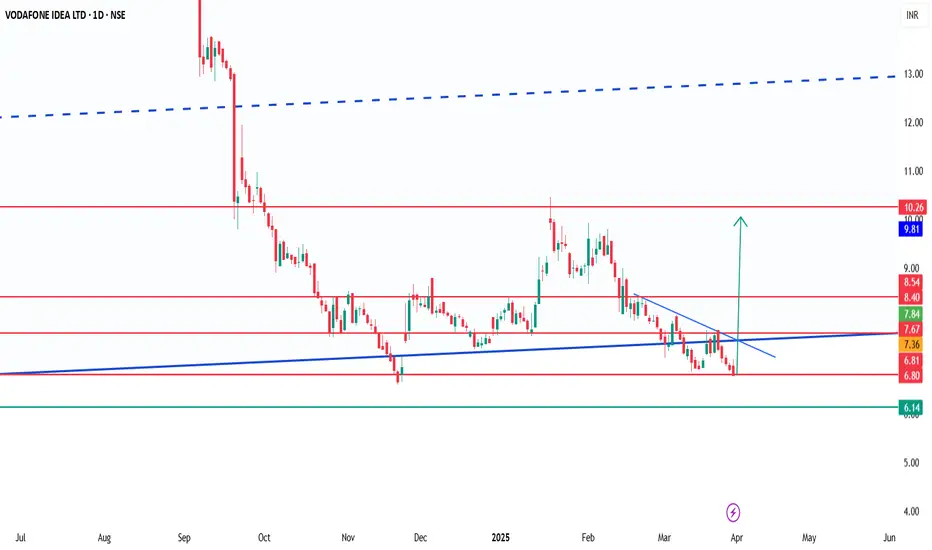
Vodafone Idea – Key Levels & Market Outlook📌 Vodafone Idea (NSE: VODAFONE) – Key Levels & Market Outlook
Vodafone Idea (VODAIDEA) is currently trading near a strong support level at ₹6.80. If this level holds, the stock could see a potential breakout once it crosses the ₹7-₹8 resistance zone, paving the way for an upside move toward ₹10. However, a breakdown below ₹6.80 may lead to further weakness.
🔍 Technical Indicators:
📊 Bollinger Bands: The stock is near the lower band, indicating a potential bounce if buying momentum picks up. A breakout above ₹8 could confirm strength.
📈 ADX (Average Directional Index): Currently around 20, suggesting a weak trend; a rise above 25 would confirm bullish strength.
📉 Stochastic Oscillator: Hovering near the oversold zone (below 25), signaling a possible reversal if demand increases.
📊 Volume & Open Interest: Rising volume on up-moves and increasing delivery percentage could confirm accumulation by investors.
📌 Key Levels to Watch:
✅ Support Level: ₹6.80
📍 Resistance Zone: ₹7.00-₹8.00
🚀 Upside Target: ₹10.00
⚠ Breakdown Risk: Below ₹6.80 could lead to a slide toward ₹6.50 or lower.
A decisive move above ₹8 could trigger fresh buying, pushing prices toward ₹10. However, failure to hold ₹6.80 might invite selling pressure. Keep an eye on market sentiment, telecom sector updates, and volume trends for confirmation.
GBP/USD 1-Hour Chart Analysis: Bearish Setup with Key ResistanceGBP/USD 1-Hour Chart Analysis: Bearish Setup with Key Levels
Key Technical Indicators:
Current Price: $1.29427
30 EMA (Red Line): $1.29453 (Short-term trend)
200 EMA (Blue Line): $1.29351 (Long-term trend)
Key Resistance Zone: $1.29663 - $1.29851 (shaded purple)
Support & Target Levels:
TP 1: $1.29358
TP 2: $1.29153
TP 3: $1.28895
Final Target: $1.28662
Analysis:
Trend:
The price is struggling around the 30 EMA and 200 EMA, showing indecision.
The shaded resistance zone ($1.29663 - $1.29851) is a key area where sellers may take control.
Trade Setup:
Entry: Expected near $1.29663 (potential rejection from resistance).
Stop Loss: Above $1.29851 (to minimize risk if price breaks higher).
Take Profit Targets: Multiple levels, with the final target at $1.28662.
Bearish Confirmation:
If price gets rejected at resistance, a downside move toward support levels is likely.
A break below 1.29358 could accelerate selling pressure.
Conclusion:
The chart suggests a potential bearish trade setup, with resistance acting as a key rejection point.
Watch for confirmation signals at the resistance zone before entering a short trade.
A break above $1.29851 would invalidate the bearish outlook.

Gold (XAUUSD) 15-Minute Chart Analysis: Bullish Setup with Key SGold (XAUUSD) 15-Minute Chart Analysis
Key Technical Indicators:
Current Price: $3,122.28
30 EMA (Red Line): $3,115.90 (Short-term trend indicator)
200 EMA (Blue Line): $3,081.17 (Long-term trend indicator)
Support Zone: Around $3,106.62
Target Point: $3,154.02
Analysis:
Trend:
The price is in an uptrend, as it is trading above both the 30 EMA and 200 EMA.
The 30 EMA is acting as dynamic support, showing strong buying interest at pullbacks.
Key Levels:
Support: $3,106.62 (marked in blue) is expected to hold as a key support level.
Resistance Zone (Previous Supply Area): Around $3,090-$3,100 (shaded purple) was previously a resistance zone but has now turned into support.
Target Level: $3,154.02 is the expected bullish target if the price respects the support zone.
Trade Setup:
Bullish Scenario: The price may pull back to the support zone (~$3,106.62) before bouncing higher towards the target.
Stop Loss: Below $3,106.62 to minimize risk.
Entry Point: A retest of the support area with bullish confirmation could provide an optimal entry for a long trade.
Risk Management:
Stop Loss: Set just below the support zone.
Reward-to-Risk Ratio: Favorable if targeting $3,154.02 with a stop at $3,106.62.
Conclusion:
The chart suggests a bullish outlook, with price expected to continue its upward momentum if support holds.
A breakout above $3,123 could further confirm bullish strength.
Caution: If the price breaks below $3,106, further downside movement toward the 200 EMA ($3,081.17) is possible.

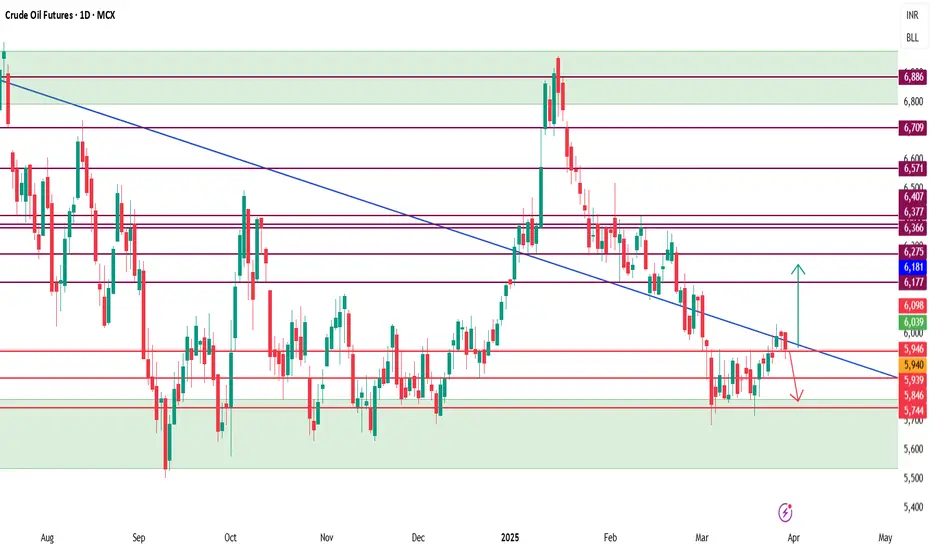
Crude Oil Futures (MCX) – Key Levels & Market Outlook📌 Crude Oil Futures (MCX) – Key Levels & Market Outlook
Crude Oil Futures (MCX) is currently trading near a strong support level at ₹5900. If this level holds, we could see a potential recovery towards ₹6000-₹6100, with further upside momentum targeting ₹6200-₹6300. However, a break below ₹5900 may invite further downside pressure.
🔍 Technical Indicators:
📊 Bollinger Bands: Price is testing the lower band near ₹5900, suggesting a possible bounce if supported by buying interest. A breakout above ₹6100 could signal increased bullish momentum.
📈 ADX (Average Directional Index): Currently around 22, indicating a weak trend. A rise above 25 would suggest stronger directional movement.
📉 Stochastic Oscillator: In the oversold zone (below 20), signaling a potential reversal if buying pressure increases.
📊 Open Interest & Volume: Increasing OI with price recovery could confirm strength, while declining OI on rallies may indicate weak buying conviction.
📌 Key Levels to Watch:
✅ Support Level: ₹5900
📍 Resistance Zone: ₹6000-₹6100
🚀 Upside Targets: ₹6200-₹6300
⚠ Breakdown Risk: Below ₹5900 could lead to a decline toward ₹5800 or lower.
A break above ₹6100 could fuel bullish momentum toward ₹6200-₹6300, while a failure to hold ₹5900 may result in extended selling pressure. Keep an eye on global crude demand, inventory data, and geopolitical developments for additional confirmation.
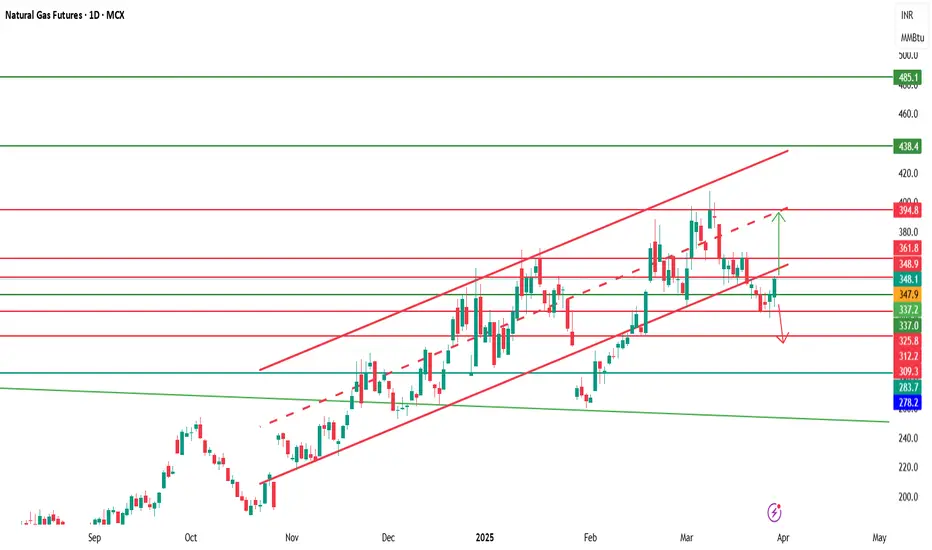
Natural Gas Futures (MCX) – Key Levels & Trend Outlook📌 Natural Gas Futures (MCX) – Key Levels & Trend Outlook
Natural Gas Futures (MCX) is currently trading near a critical support zone of ₹335-₹325. If this level holds, we could see a potential rebound toward the ₹350-₹360 resistance zone. A breakout above this resistance could trigger further upside towards ₹375-₹400.
🔍 Technical Indicators:
📊 200-Day EMA: ₹330 – Acting as a key support level; holding above it may sustain bullish momentum.
📈 RSI (Relative Strength Index): Currently around 48 – A push above 55-60 would confirm bullish strength.
📉 MACD (Moving Average Convergence Divergence): Close to a bullish crossover, signaling potential upward momentum.
📊 Volume Analysis: Strong buying interest on rallies, while dips show lower selling pressure.
📌 Key Levels to Watch:
✅ Support Zone: ₹335-₹325
📍 Resistance Zone: ₹350-₹360
🚀 Upside Targets: ₹375-₹400
🚨 Breakdown Level: Below ₹325 could lead to further weakness.
A break above ₹360 could accelerate bullish momentum towards ₹375-₹400, while a drop below ₹325 may invite further downside pressure. Keep an eye on weather patterns, global LNG supply trends, and inventory data for additional confirmation.
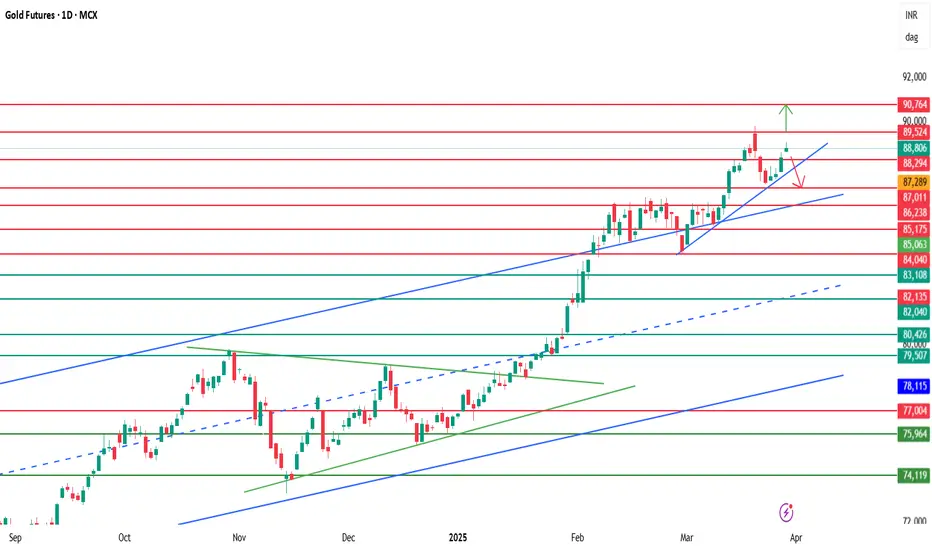
Gold Futures (MCX) – Key Levels & Trend Outlook📌 Gold Futures (MCX) – Key Levels & Trend Outlook
Gold Futures (MCX) is currently trading near a critical support zone of ₹88,500-₹88,000. Holding above this level could trigger fresh buying, leading to an upside move towards ₹90,000+. However, immediate resistance is seen in the ₹88,700-₹89,500 range, which needs to be breached for further strength.
🔍 Technical Indicators:
📊 200-Day EMA: ₹88,200 – Acting as dynamic support; sustaining above this level strengthens the bullish outlook.
📈 RSI (Relative Strength Index): Currently around 55 – A breakout above 60 could confirm bullish momentum.
📉 MACD (Moving Average Convergence Divergence): Close to a bullish crossover, signaling potential upside strength.
📊 Volume Analysis: Rising volumes on rallies suggest strong buying interest, while lower volumes on dips indicate weak selling pressure.
📌 Key Levels to Watch:
✅ Support Zone: ₹88,500-₹88,000
📍 Resistance Zone: ₹88,700-₹89,500
🚀 Upside Target: ₹90,000+
🚨 Breakdown Level: Below ₹88,000 could lead to weakness.
A break above ₹89,500 could fuel bullish momentum toward ₹90,500-₹91,000, while a fall below ₹88,000 may invite further downside pressure. Keep an eye on global gold prices, USD movement, and central bank policy cues for confirmation.
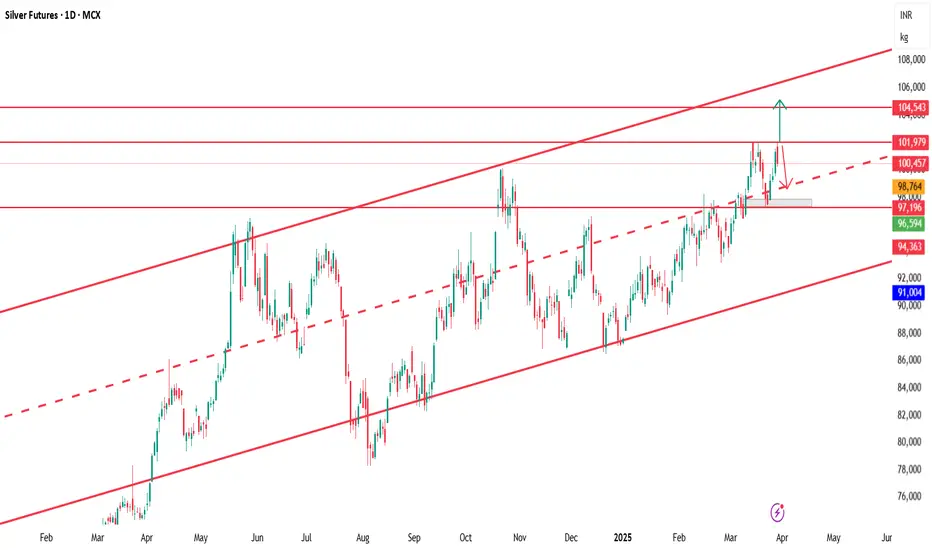
Silver Futures (MCX) – Key Levels & Trend Outlook📌 Silver Futures (MCX) – Key Levels & Trend Outlook
Silver Futures (MCX) is currently trading near a crucial support zone of ₹97,000-₹98,000. A strong rebound from this level could push prices towards ₹1,04,000, current resistance seen around ₹1,01,800. However, a decisive break below ₹97,000 may trigger further downside toward ₹95,500-₹94,800.
🔍 Technical Indicators:
📊 200-Day EMA: ₹98,200 – Acting as a strong dynamic support; holding above this level may sustain bullish sentiment.
📈 RSI (Relative Strength Index): Currently near 57 – A move above 60 could confirm bullish momentum.
📉 MACD (Moving Average Convergence Divergence): Recently showed a bullish crossover, indicating possible upward momentum.
📊 Volume Analysis: Rising volumes on up-moves indicate strong buying interest, while lower volumes on dips suggest weak selling pressure.
📌 Key Levels to Watch:
✅ Support Zone: ₹97,000-₹98,000
📍 Upside Targets: ₹1,04,000, ₹1,06,000
🚨 Breakdown Level: ₹97,000
📉 Downside Targets: ₹95,500, ₹94,800
A break above ₹1,01,800 could strengthen bullish momentum, while sustained weakness below ₹94,800 may indicate a deeper correction. Keep an eye on global silver prices, USD movement, and interest rate cues for additional confirmation.
TATA CONSUMERSStock Overview: TATA Consumer Product Ltd, NSE, current price: ₹1,001.90. TATA Consumer Product Ltd operates in the consumer products sector, focusing on food and beverages.
Key Levels:
Support level: ₹878.30 (yellow zone)
Swing zone: ₹970.40 - ₹1,024.50 (green zone)
Technical Indicators:
RSI (Relative Strength Index): Currently at 49.61, indicating neutral momentum.
Volume: 9.34M, reflecting moderate trading activity.
Moving Averages (MA): The stock price is above the 200-day MA but below the 50-day MA, signaling mixed trends.
Sector and Market Context: TATA Consumer Product Ltd benefits from its strong brand presence and diverse product portfolio, which allows it to capture a significant market share. Additionally, recent consumer trends, such as a growing preference for healthier food and beverage options, align with the company’s strategy and could further boost its performance in the sector. Market trends show cautious optimism, with investors favoring stable stocks amidst volatility.
Risk Considerations: Potential risks include inflation, shifts in consumer behavior, and global economic events. Company-specific risks such as supply chain disruptions or management changes could also impact performance.
Analysis Summary: TATA Consumer Product Ltd exhibits key support and resistance levels, with target prices suggesting growth potential. Neutral RSI and moderate volume indicate balanced momentum. While moving averages present mixed signals, the stock remains a stable contender within its sector. Investors should weigh market conditions and company-specific risks carefully before making decisions.

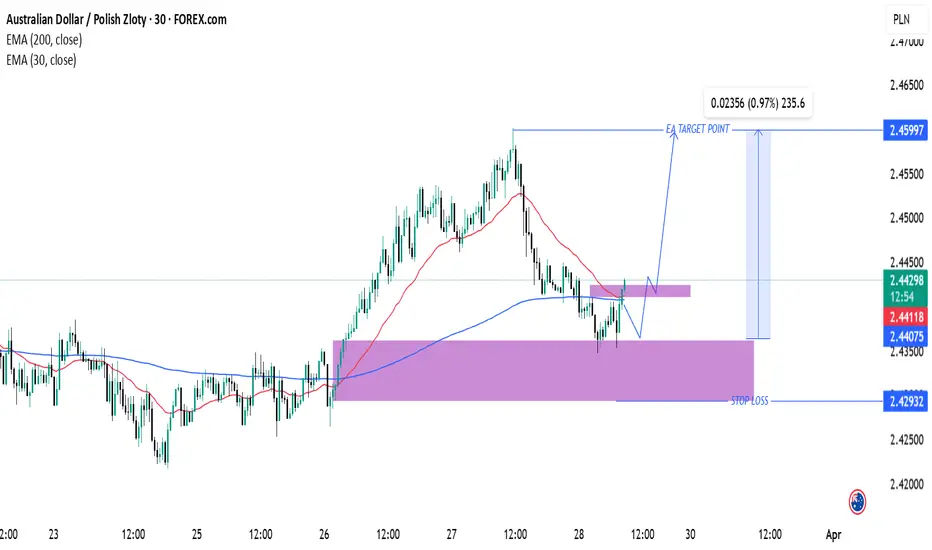
AUD/PLN Trade Setup: Bullish Reversal & Target ProjectionAUD/PLN Technical Analysis & Trade Setup
Chart Overview:
Currency Pair: Australian Dollar (AUD) / Polish Zloty (PLN)
Timeframe: 30-minute chart
Indicators:
200 EMA (Blue): 2.44075
30 EMA (Red): 2.44113
Key Levels & Strategy:
Support & Resistance:
Major Support Zone: Around 2.42932 (Stop Loss Area)
Intermediate Resistance: Near 2.44228
Target Resistance (Take Profit): 2.45997
Trade Projection:
The price recently bounced off the support zone (purple).
A possible retracement and retest of resistance before a strong upward move.
Targeting 0.97% profit potential from 2.44228 to 2.45997.
Entry Strategy:
Confirmation of support hold at 2.44075 - 2.44228.
If price respects this zone, a bullish continuation is expected.
If support fails, price may revisit the stop-loss area (2.42932).
Conclusion:
If price sustains above 2.44113, a bullish move is expected.
Watch for a breakout above resistance for a confirmed long entry.
A drop below 2.42932 would invalidate the setup.
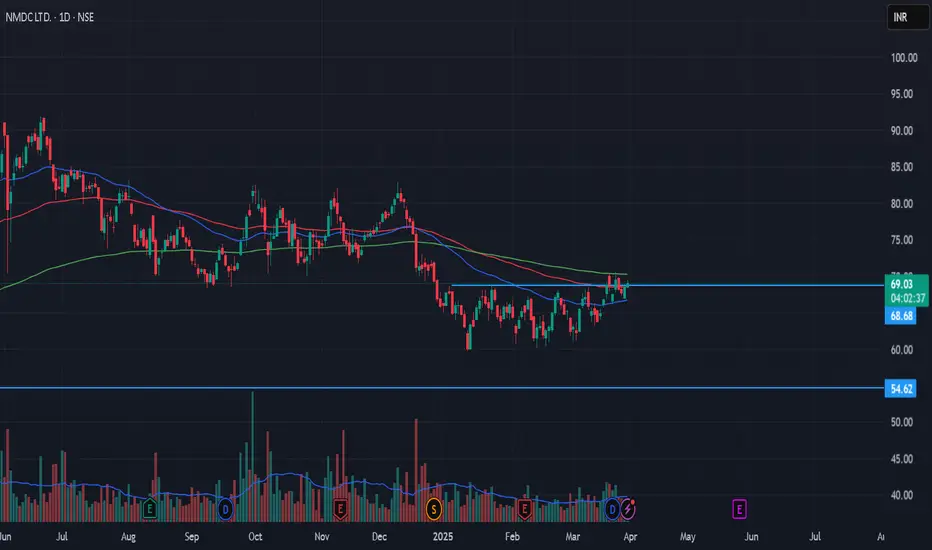
Range breakout🚀 NMDC Breakout Alert! 📈🔥
Stock: NMDC Ltd. (NSE)
Breakout Level: ₹68.70
Current Price: ₹69.12 (+0.83%)
Indicators:
✅ Price breaking above key resistance
AMBUJA CEMENTS Stock Overview: Ambuja Cements Ltd, traded on the NSE, current price: ₹532.45. Ambuja Cements Ltd is a major cement manufacturing company in India, producing and selling cement and clinker.
Key Levels:
Support (yellow zone): ₹399.10, ₹432.00, ₹464.90
Swing Zone (green zone): ₹512.95 - ₹550.05
Technical Indicators:
RSI (Relative Strength Index): Currently at 49.33, indicating neutral momentum as it is near the midpoint of 50.
Volume: 13.99M, showing significant trading activity.
MA (Moving Averages): The stock price is above the 200-day MA (₹549.14) but below the 50-day MA (₹516.90), signaling mixed trends.
Sector and Market Context: Ambuja Cements Ltd operates in the construction materials sector, which has been experiencing moderate growth. The overall market trends show a recovery phase post-pandemic, with infrastructure development being a key driver.
Risk Considerations: Potential risks include fluctuations in raw material prices, regulatory changes, and economic downturns that could impact construction activities. Market conditions such as interest rate changes and global economic events might also influence the stock's movement.
Analysis Summary: Ambuja Cements Ltd shows a mixed technical outlook with neutral RSI and significant trading volume. The stock is in a swing zone with key support and target levels identified. Investors should consider sector performance and market conditions while evaluating this stock.

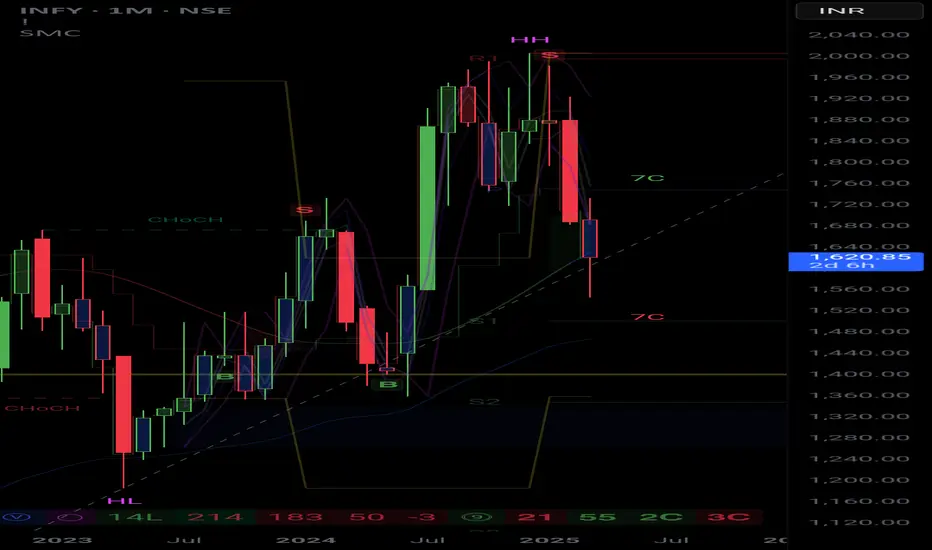
Infosys (INFY) Stock Forecast – March 2025Infosys (INFY) Stock Forecast – March 2025
Current Price: ₹1,619.50
Timeframe: Monthly Chart (1M)
Technical Analysis & Forecast
1. Trendline Support: The stock is currently testing a key trendline support on the monthly chart.
2. Breakdown Possibility: If INFY closes below this trendline, it may head towards the ₹1,400 level, aligning with the S2 support zone.
3. Resistance Levels: The recent rejection from ₹1,850-1,900 suggests strong selling pressure at those levels.
4. Market Structure:
Lower highs (LH) formation indicates a possible bearish continuation.
Change of character (ChoCH) signals uncertainty in trend direction.
5. Indicators:
Moving Averages: INFY is testing its long-term moving averages. A break below these could accelerate the downside.
Volume & Momentum: Selling pressure has increased, and bulls need to reclaim key resistance levels for a recovery.
My View
INFY is taking trendline support this month. If this support is broken, we can expect ₹1,400 as the next downside target. However, if buyers defend this level, a rebound towards ₹1,750 is possible.
Disclaimer
This analysis is for educational and informational purposes only. It is not financial advice. Please conduct your own research or consult with a professional before making any trading decisions.
PIRAMAL PHARMAStock Overview: Piramal Pharma, NSE, current price: ₹226.72. Piramal Pharma is a pharmaceutical company involved in the development, manufacturing, and distribution of pharmaceutical products.
Key Levels:
Support (yellow zone): ₹155.77
Swing zone (green zone): ₹188.29 to ₹229.93
Technical Indicators:
RSI (Relative Strength Index): The RSI is currently at 52.54, indicating a neutral momentum as it is near the midpoint of the scale (50).
Volume: The volume is 55.27M, showing significant trading activity which can indicate investor interest and potential volatility.
MA (Moving Average): The SMA (Simple Moving Average) is at ₹203.91, suggesting that the stock is trading above its long-term average, which can be a bullish signal.
Sector and Market Context: Piramal Pharma's performance should be analyzed in the context of the pharmaceutical sector, which has been experiencing growth due to increased demand for healthcare products. The overall market trends show a mixed sentiment with some sectors performing better than others.
Risk Considerations: Potential risks include regulatory changes, market competition, and global economic conditions that could impact the pharmaceutical industry. Additionally, any adverse events related to drug approvals or recalls could influence the stock's movement.
Analysis Summary: Piramal Pharma shows potential for growth with key target levels identified. The stock is currently trading above its moving average, and the RSI indicates neutral momentum. Investors should consider sector performance and market conditions, along with potential risks, before making any investment decisions.

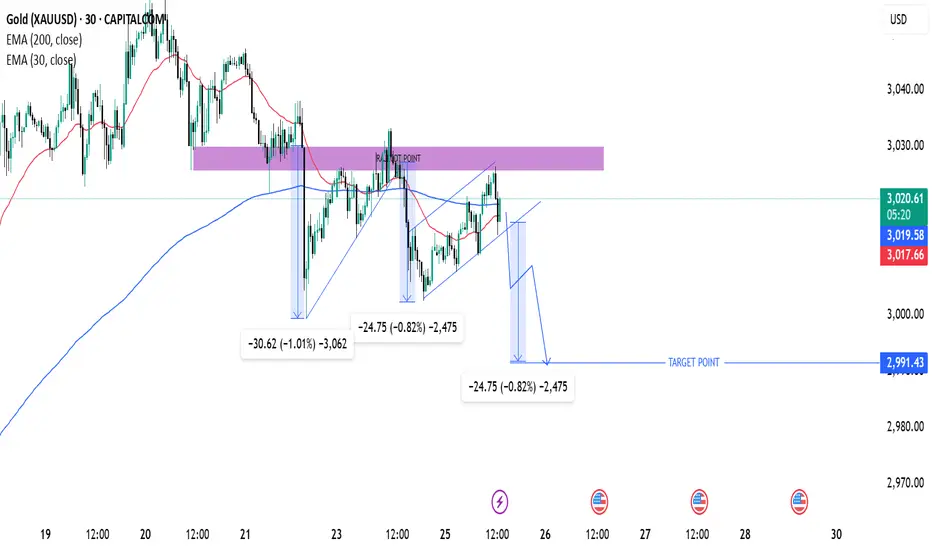
Gold (XAU/USD) Bearish Setup – Potential Drop to $2,991This is a trading setup for Gold (XAU/USD) on the 30-minute timeframe, showing a potential bearish move.
Analysis:
Key Indicators:
200 EMA (blue line) at 3,019.55: Acting as a resistance level.
30 EMA (red line) at 3,017.45: Providing short-term trend guidance.
Price Action & Structure:
The price previously rejected from a resistance zone (purple area) and started forming lower highs.
Repeated bearish patterns suggest another potential drop.
The chart highlights measured moves of previous declines (-30.62, -24.75), indicating a possible repeat of the pattern.
Trade Setup:
Bearish Outlook: Price is expected to drop towards the target point at 2,991.43.
Entry: Near the break of the lower trendline in the ascending wedge.
Target: 2,991.43 (marked as "TARGET POINT").
Risk Management: Ensure proper stop-loss placement above recent highs.
Conclusion:
If price respects the pattern, a downward move is likely.
A confirmed break below support could accelerate the drop.
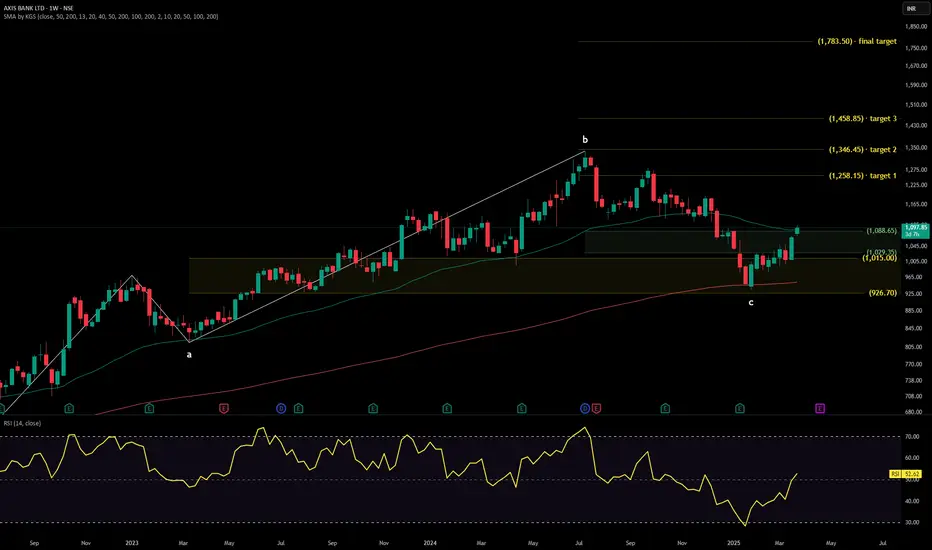
AXIS BANKTechnical Analysis Report
Stock Overview: Axis Bank Ltd - NSE - Current Price: ₹1,097.85. Axis Bank Ltd is a prominent private sector bank in India, offering a wide range of financial services, including retail banking, corporate banking, and treasury operations.
Key Levels:
Support (Yellow Zone): ₹926.70 - ₹952.52
Swing Zone (Green Zone): ₹1,015.00 - ₹1,091.53
Technical Indicators:
RSI (Relative Strength Index): The RSI value is 52.62, indicating neutral momentum as it is close to the midpoint of 50.
Volume: The trading volume is 8.28M, reflecting moderate investor interest. Higher volume often signals stronger price movements.
MA (Moving Average): The stock is trading above its 50-day moving average (₹1,091.53) but below its 200-day moving average (₹952.52), suggesting a mixed trend.
Sector and Market Context: Axis Bank operates in the financial sector, which has been experiencing fluctuations due to economic conditions, interest rate changes, and regulatory policies. While the overall market shows signs of recovery, uncertainties persist, impacting the banking sector's performance.
Risk Considerations: Potential risks include changes in interest rates, regulatory shifts, economic downturns, and geopolitical events. These factors could influence the stock's movement and overall market sentiment.
Analysis Summary: Axis Bank Ltd presents a mixed technical outlook with identified support and resistance levels. The RSI indicates neutral momentum, and the volume suggests moderate investor interest. Moving averages provide a mixed trend signal. Investors should carefully consider sector and market conditions, along with potential risks, before making investment decisions.
ready for targets MARUTI SUZUKI Stock Overview: Maruti Suzuki India Ltd., traded on NSE, current price: ₹11,732.80. Maruti Suzuki India Ltd. is a leading automobile manufacturer in India, primarily engaged in the production and sale of passenger vehicles.
Technical Indicators:
RSI (Relative Strength Index): The RSI value is 47.68, indicating neutral momentum as it is neither in the overbought (>70) nor oversold (<30) zone.
Volume: The trading volume is 2.07 million, reflecting moderate activity.
MA (Moving Averages): Multiple moving averages (e.g., 50, 200-day SMA) suggest trend direction and potential support/resistance levels.
Sector and Market Context: Maruti Suzuki operates in the automobile sector, which is witnessing fluctuations due to evolving consumer demand, regulatory policies, and economic conditions. The sector is also influenced by the growing focus on electric vehicles and sustainability. The broader market shows signs of recovery post-pandemic, which could positively impact the automobile industry.
Risk Considerations: Potential risks include market volatility, changes in government policies, global economic conditions, supply chain disruptions, and competition from other manufacturers. Additionally, fluctuations in raw material prices and foreign exchange rates could affect performance.
Analysis Summary: Maruti Suzuki India Ltd. exhibits neutral momentum with moderate trading activity. The stock is currently in a swing zone, with potential targets identified. Investors should carefully consider market conditions, sector performance, and associated risks before making decisions.

Swing Trade Projection for ESCORTS KUBOTA LTDCurrent Analysis:
Momentum Indicators:
Rate of Change (ROC): Currently at 4.84, above the 0 line, indicating a positive momentum.
Commodity Channel Index (CCI): The CCI is at 196, signaling strong upward momentum.
Relative Strength Index (RSI): At 58 on a daily basis, showing a positive trend and potential for further upside.
Trade Setup:
Entry Point: Consider entering near the current level of 3,220 INR (or on pullbacks to around 3,263 INR, if there's a rejection and potential for a rebound).
Target 1: 3,435 INR (primary target, crucial resistance).
Target 2: 3,565 INR (near-term target).
Extended Target: 3,810 INR (if momentum continues).
Stop Loss: Set a stop loss around 3050 INR, below the support zone to manage downside risk.
Disclaimer: This is not financial advice and is for educational purposes only. Please assess your own risk tolerance and consult a financial advisor before making any investment decisions. Past performance is not indicative of future results.
