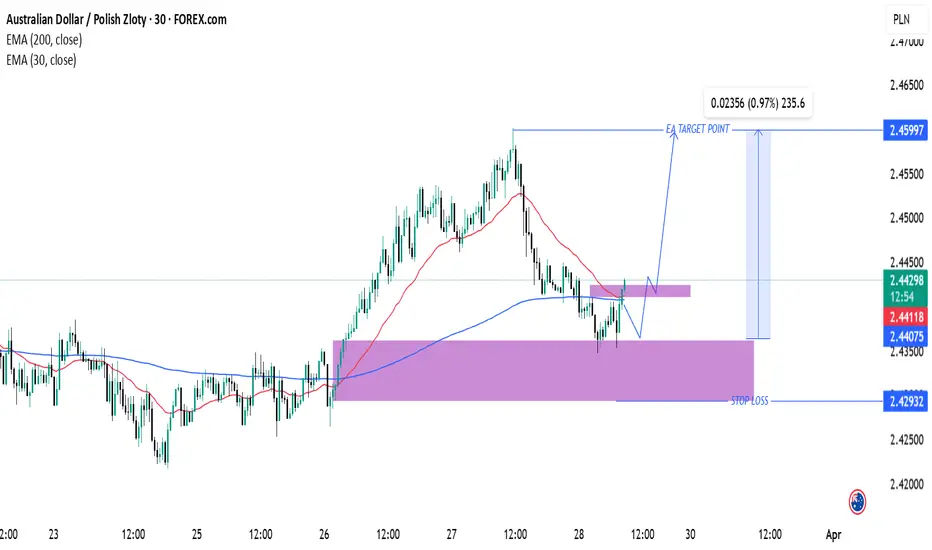
AUD/PLN Trade Setup: Bullish Reversal & Target ProjectionAUD/PLN Technical Analysis & Trade Setup
Chart Overview:
Currency Pair: Australian Dollar (AUD) / Polish Zloty (PLN)
Timeframe: 30-minute chart
Indicators:
200 EMA (Blue): 2.44075
30 EMA (Red): 2.44113
Key Levels & Strategy:
Support & Resistance:
Major Support Zone: Around 2.42932 (Stop Loss Area)
Intermediate Resistance: Near 2.44228
Target Resistance (Take Profit): 2.45997
Trade Projection:
The price recently bounced off the support zone (purple).
A possible retracement and retest of resistance before a strong upward move.
Targeting 0.97% profit potential from 2.44228 to 2.45997.
Entry Strategy:
Confirmation of support hold at 2.44075 - 2.44228.
If price respects this zone, a bullish continuation is expected.
If support fails, price may revisit the stop-loss area (2.42932).
Conclusion:
If price sustains above 2.44113, a bullish move is expected.
Watch for a breakout above resistance for a confirmed long entry.
A drop below 2.42932 would invalidate the setup.
Search in ideas for "INDICATORS"
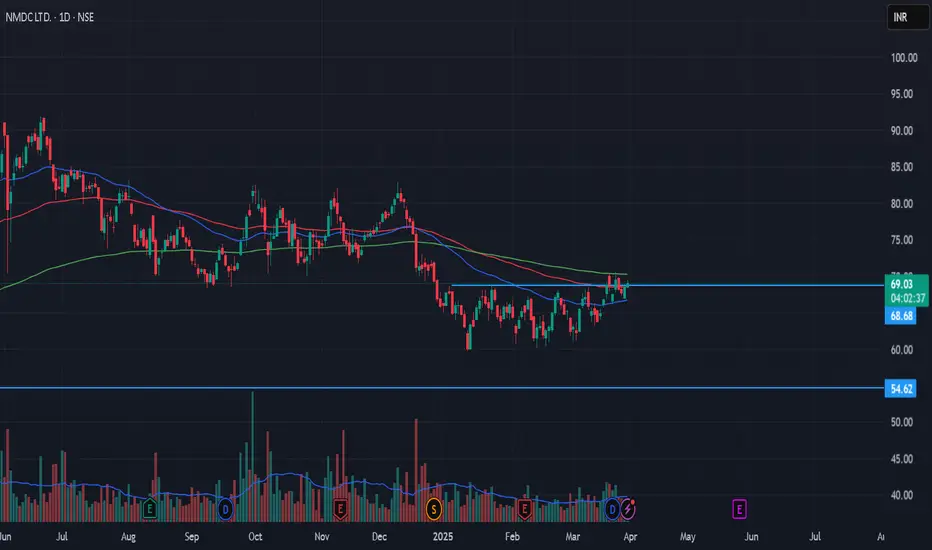
Range breakout🚀 NMDC Breakout Alert! 📈🔥
Stock: NMDC Ltd. (NSE)
Breakout Level: ₹68.70
Current Price: ₹69.12 (+0.83%)
Indicators:
✅ Price breaking above key resistance
AMBUJA CEMENTS Stock Overview: Ambuja Cements Ltd, traded on the NSE, current price: ₹532.45. Ambuja Cements Ltd is a major cement manufacturing company in India, producing and selling cement and clinker.
Key Levels:
Support (yellow zone): ₹399.10, ₹432.00, ₹464.90
Swing Zone (green zone): ₹512.95 - ₹550.05
Technical Indicators:
RSI (Relative Strength Index): Currently at 49.33, indicating neutral momentum as it is near the midpoint of 50.
Volume: 13.99M, showing significant trading activity.
MA (Moving Averages): The stock price is above the 200-day MA (₹549.14) but below the 50-day MA (₹516.90), signaling mixed trends.
Sector and Market Context: Ambuja Cements Ltd operates in the construction materials sector, which has been experiencing moderate growth. The overall market trends show a recovery phase post-pandemic, with infrastructure development being a key driver.
Risk Considerations: Potential risks include fluctuations in raw material prices, regulatory changes, and economic downturns that could impact construction activities. Market conditions such as interest rate changes and global economic events might also influence the stock's movement.
Analysis Summary: Ambuja Cements Ltd shows a mixed technical outlook with neutral RSI and significant trading volume. The stock is in a swing zone with key support and target levels identified. Investors should consider sector performance and market conditions while evaluating this stock.

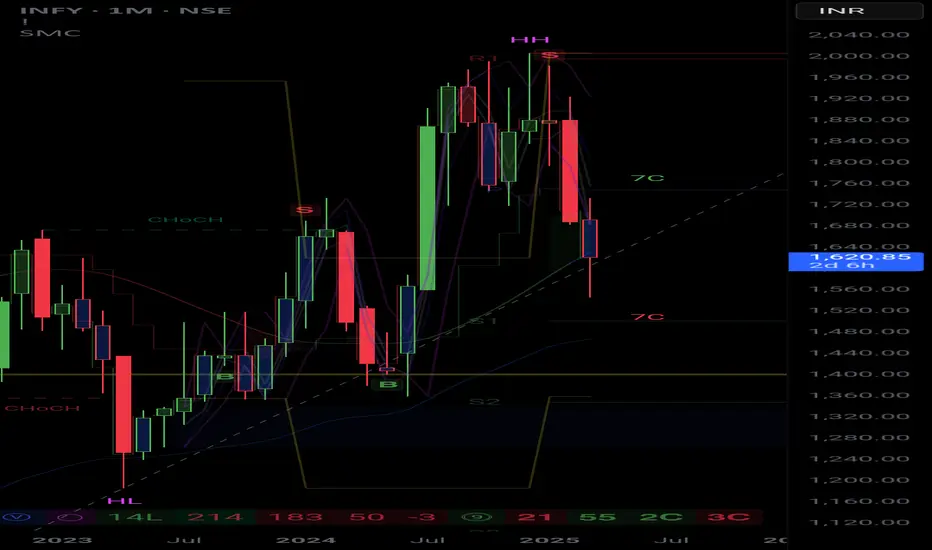
Infosys (INFY) Stock Forecast – March 2025Infosys (INFY) Stock Forecast – March 2025
Current Price: ₹1,619.50
Timeframe: Monthly Chart (1M)
Technical Analysis & Forecast
1. Trendline Support: The stock is currently testing a key trendline support on the monthly chart.
2. Breakdown Possibility: If INFY closes below this trendline, it may head towards the ₹1,400 level, aligning with the S2 support zone.
3. Resistance Levels: The recent rejection from ₹1,850-1,900 suggests strong selling pressure at those levels.
4. Market Structure:
Lower highs (LH) formation indicates a possible bearish continuation.
Change of character (ChoCH) signals uncertainty in trend direction.
5. Indicators:
Moving Averages: INFY is testing its long-term moving averages. A break below these could accelerate the downside.
Volume & Momentum: Selling pressure has increased, and bulls need to reclaim key resistance levels for a recovery.
My View
INFY is taking trendline support this month. If this support is broken, we can expect ₹1,400 as the next downside target. However, if buyers defend this level, a rebound towards ₹1,750 is possible.
Disclaimer
This analysis is for educational and informational purposes only. It is not financial advice. Please conduct your own research or consult with a professional before making any trading decisions.
PIRAMAL PHARMAStock Overview: Piramal Pharma, NSE, current price: ₹226.72. Piramal Pharma is a pharmaceutical company involved in the development, manufacturing, and distribution of pharmaceutical products.
Key Levels:
Support (yellow zone): ₹155.77
Swing zone (green zone): ₹188.29 to ₹229.93
Technical Indicators:
RSI (Relative Strength Index): The RSI is currently at 52.54, indicating a neutral momentum as it is near the midpoint of the scale (50).
Volume: The volume is 55.27M, showing significant trading activity which can indicate investor interest and potential volatility.
MA (Moving Average): The SMA (Simple Moving Average) is at ₹203.91, suggesting that the stock is trading above its long-term average, which can be a bullish signal.
Sector and Market Context: Piramal Pharma's performance should be analyzed in the context of the pharmaceutical sector, which has been experiencing growth due to increased demand for healthcare products. The overall market trends show a mixed sentiment with some sectors performing better than others.
Risk Considerations: Potential risks include regulatory changes, market competition, and global economic conditions that could impact the pharmaceutical industry. Additionally, any adverse events related to drug approvals or recalls could influence the stock's movement.
Analysis Summary: Piramal Pharma shows potential for growth with key target levels identified. The stock is currently trading above its moving average, and the RSI indicates neutral momentum. Investors should consider sector performance and market conditions, along with potential risks, before making any investment decisions.

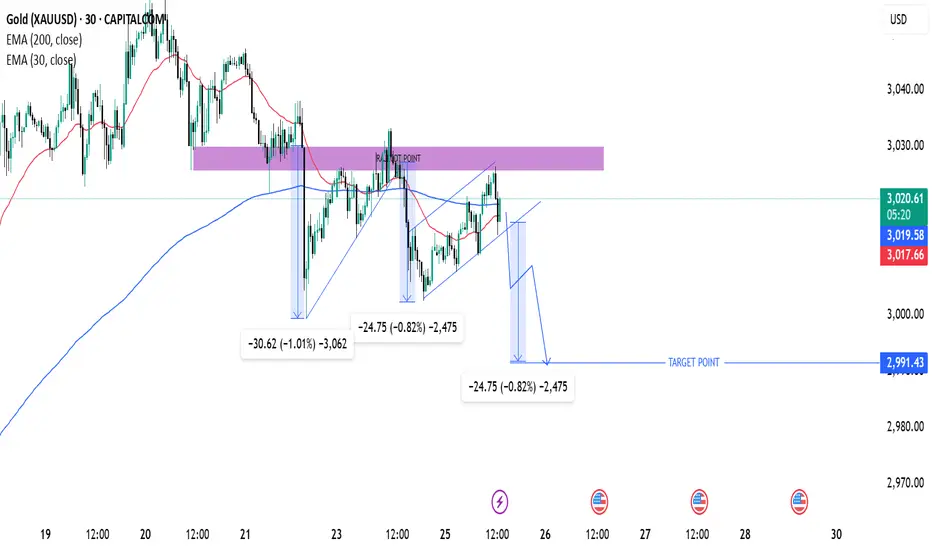
Gold (XAU/USD) Bearish Setup – Potential Drop to $2,991This is a trading setup for Gold (XAU/USD) on the 30-minute timeframe, showing a potential bearish move.
Analysis:
Key Indicators:
200 EMA (blue line) at 3,019.55: Acting as a resistance level.
30 EMA (red line) at 3,017.45: Providing short-term trend guidance.
Price Action & Structure:
The price previously rejected from a resistance zone (purple area) and started forming lower highs.
Repeated bearish patterns suggest another potential drop.
The chart highlights measured moves of previous declines (-30.62, -24.75), indicating a possible repeat of the pattern.
Trade Setup:
Bearish Outlook: Price is expected to drop towards the target point at 2,991.43.
Entry: Near the break of the lower trendline in the ascending wedge.
Target: 2,991.43 (marked as "TARGET POINT").
Risk Management: Ensure proper stop-loss placement above recent highs.
Conclusion:
If price respects the pattern, a downward move is likely.
A confirmed break below support could accelerate the drop.
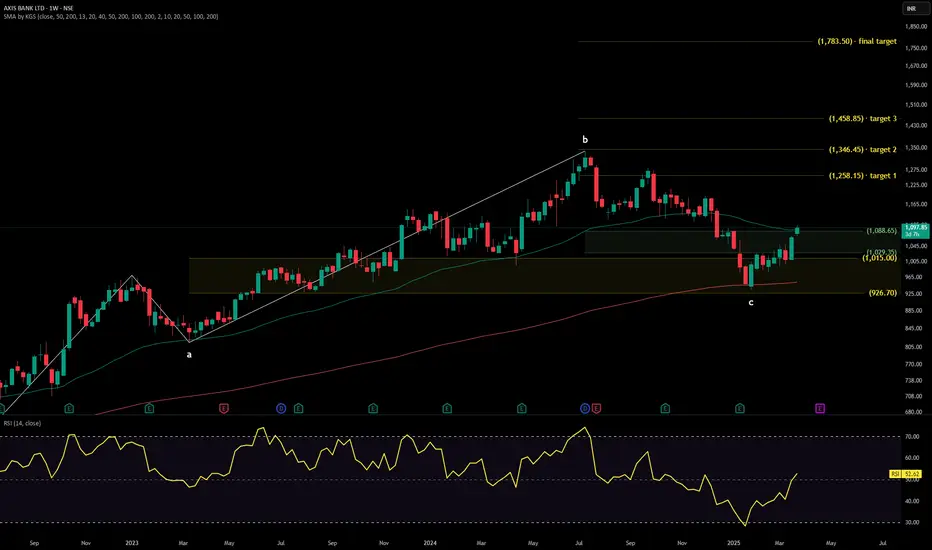
AXIS BANKTechnical Analysis Report
Stock Overview: Axis Bank Ltd - NSE - Current Price: ₹1,097.85. Axis Bank Ltd is a prominent private sector bank in India, offering a wide range of financial services, including retail banking, corporate banking, and treasury operations.
Key Levels:
Support (Yellow Zone): ₹926.70 - ₹952.52
Swing Zone (Green Zone): ₹1,015.00 - ₹1,091.53
Technical Indicators:
RSI (Relative Strength Index): The RSI value is 52.62, indicating neutral momentum as it is close to the midpoint of 50.
Volume: The trading volume is 8.28M, reflecting moderate investor interest. Higher volume often signals stronger price movements.
MA (Moving Average): The stock is trading above its 50-day moving average (₹1,091.53) but below its 200-day moving average (₹952.52), suggesting a mixed trend.
Sector and Market Context: Axis Bank operates in the financial sector, which has been experiencing fluctuations due to economic conditions, interest rate changes, and regulatory policies. While the overall market shows signs of recovery, uncertainties persist, impacting the banking sector's performance.
Risk Considerations: Potential risks include changes in interest rates, regulatory shifts, economic downturns, and geopolitical events. These factors could influence the stock's movement and overall market sentiment.
Analysis Summary: Axis Bank Ltd presents a mixed technical outlook with identified support and resistance levels. The RSI indicates neutral momentum, and the volume suggests moderate investor interest. Moving averages provide a mixed trend signal. Investors should carefully consider sector and market conditions, along with potential risks, before making investment decisions.
ready for targets MARUTI SUZUKI Stock Overview: Maruti Suzuki India Ltd., traded on NSE, current price: ₹11,732.80. Maruti Suzuki India Ltd. is a leading automobile manufacturer in India, primarily engaged in the production and sale of passenger vehicles.
Technical Indicators:
RSI (Relative Strength Index): The RSI value is 47.68, indicating neutral momentum as it is neither in the overbought (>70) nor oversold (<30) zone.
Volume: The trading volume is 2.07 million, reflecting moderate activity.
MA (Moving Averages): Multiple moving averages (e.g., 50, 200-day SMA) suggest trend direction and potential support/resistance levels.
Sector and Market Context: Maruti Suzuki operates in the automobile sector, which is witnessing fluctuations due to evolving consumer demand, regulatory policies, and economic conditions. The sector is also influenced by the growing focus on electric vehicles and sustainability. The broader market shows signs of recovery post-pandemic, which could positively impact the automobile industry.
Risk Considerations: Potential risks include market volatility, changes in government policies, global economic conditions, supply chain disruptions, and competition from other manufacturers. Additionally, fluctuations in raw material prices and foreign exchange rates could affect performance.
Analysis Summary: Maruti Suzuki India Ltd. exhibits neutral momentum with moderate trading activity. The stock is currently in a swing zone, with potential targets identified. Investors should carefully consider market conditions, sector performance, and associated risks before making decisions.

Swing Trade Projection for ESCORTS KUBOTA LTDCurrent Analysis:
Momentum Indicators:
Rate of Change (ROC): Currently at 4.84, above the 0 line, indicating a positive momentum.
Commodity Channel Index (CCI): The CCI is at 196, signaling strong upward momentum.
Relative Strength Index (RSI): At 58 on a daily basis, showing a positive trend and potential for further upside.
Trade Setup:
Entry Point: Consider entering near the current level of 3,220 INR (or on pullbacks to around 3,263 INR, if there's a rejection and potential for a rebound).
Target 1: 3,435 INR (primary target, crucial resistance).
Target 2: 3,565 INR (near-term target).
Extended Target: 3,810 INR (if momentum continues).
Stop Loss: Set a stop loss around 3050 INR, below the support zone to manage downside risk.
Disclaimer: This is not financial advice and is for educational purposes only. Please assess your own risk tolerance and consult a financial advisor before making any investment decisions. Past performance is not indicative of future results.

NIFTY Smallcap 250 – Bullish Head & Shoulder PatternKey Highlights: Nifty Smallcap 250 Index
✅ Bullish Head & Shoulder Breakout
✅ Neckline at 15,000 – Critical Psychological Level
✅ Price Trading Above 20 EMA – Short-term Trend Turning Bullish
✅ RSI Gaining Strength – Momentum Supporting Upside Move
Chart Pattern Analysis:
The NIFTY Smallcap 250 has formed a classic bullish inverse Head & Shoulder pattern, signaling a potential trend reversal. Today, the price is breaking above the neckline at 15,000, which is a key psychological resistance level.
A decisive closing above this neckline with a strong bullish candle will further validate the breakout, indicating a potential upside continuation.
Technical Indicators:
📌 20 EMA Crossover: Price is now trading above the 20-day Exponential Moving Average (EMA), confirming a short-term bullish trend shift.
📌 RSI Momentum: The Relative Strength Index (RSI) is heading towards the bullish zone, showing increasing buying strength and momentum. A move above 60 could further fuel the rally.
📌 Volume Confirmation: A surge in trading volume will add strength to this breakout, confirming buyers’ interest in small-cap stocks.

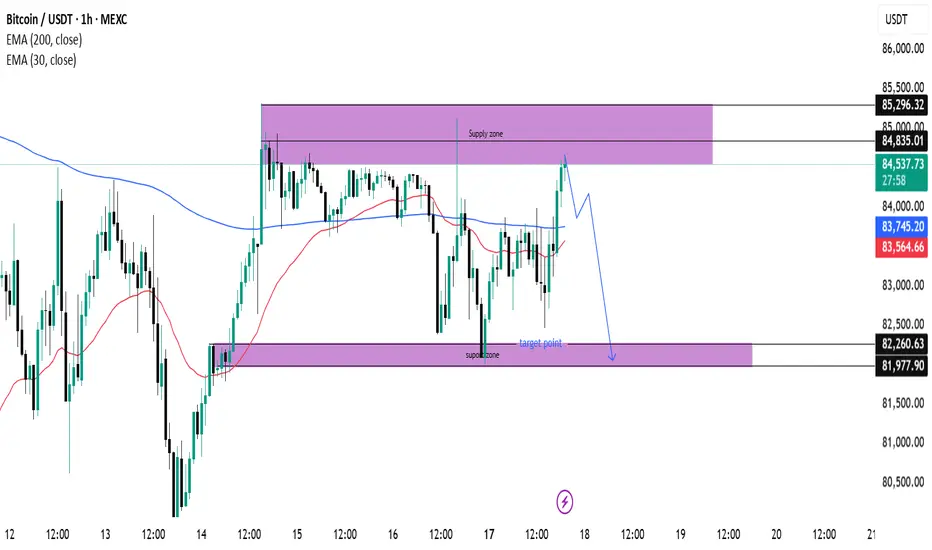
(BTC/USDT) Analysis: Supply Zone Rejection & Potential Drop Key Technical Levels:
Supply Zone (~85,296 - 84,835):
The price has reached a supply zone, which is acting as resistance. A rejection from this area could push BTC down.
Support Zone (~82,260 - 81,977):
This is a demand area where buyers might step in if the price declines.
Indicators:
EMA 30 (Red Line - 83,553.82): Short-term trend indicator.
EMA 200 (Blue Line - 83,743.52): Long-term trend indicator, currently above the price, indicating potential resistance.
Price Action & Prediction:
The price has touched the supply zone and is showing signs of rejection.
The blue projected path suggests a potential pullback followed by a drop toward the support zone (~82,260).
If price breaks below the support zone, further downside could be expected.
Potential Trade Idea:
Short Setup: If rejection at the supply zone continues, a short position could target the 82,260 support zone.
Long Setup: If price reaches the support zone and shows bullish reactions, a long position could aim for a rebound toward resistance.
"Gold Price Analysis: Supply Zone Rejection & Potential Drop Key Technical Levels:
Supply Zone Resistance (~3,004.973): Price is currently testing this resistance area, which could lead to a potential rejection.
FVG (Fair Value Gap) Support Level (~2,949.378 - 2,945.323): This area is marked as a potential support zone where price might find buying interest.
EMA 200 Support (2,945.323): A critical dynamic support level that aligns with the FVG zone.
Indicators:
EMA 30 (Red Line - 2,990.457): Short-term trend indicator.
EMA 200 (Blue Line - 2,945.323): Long-term trend indicator.
Price Action & Prediction:
The price is in the supply zone resistance and could potentially reject downwards.
The blue projected path suggests a pullback to the FVG support zone before a possible rebound.
If price breaks below this support, further downside could be expected.
Potential Trade Idea:
Short Setup: If rejection occurs at resistance, a short trade targeting the FVG/EMA 200 support could be considered.
Long Setup: If price reaches the FVG zone and finds support, a long position targeting previous highs could be a strategy.

Gold (XAU/USD) 15-Minute Analysis – Bearish Reversal from ResistThis chart is a 15-minute timeframe analysis of Gold (XAU/USD) using TradingView. Here's the breakdown of the analysis:
Key Levels & Setup:
Entry Zone (ENTRE): Around 3,004.172 - 3,003.999
Stop Loss (SL): 3,010.919 - 3,010.746 (Above the resistance zone)
Take Profit Targets:
TP1: 2,995.869
TP2: 2,987.219
TP3: 2,980.646
Technical Indicators:
Exponential Moving Averages (EMAs):
EMA 30 (Red Line): 2,992.313 (Short-term trend)
EMA 200 (Blue Line): 2,978.242 (Long-term trend)
Market Structure & Trade Idea:
The price is near a resistance zone (purple area), indicating a potential short-selling opportunity.
If the price fails to break above the resistance and reverses, it could drop toward the take profit levels.
The risk-to-reward ratio looks favorable, with the stop loss set just above resistance.
A break below the 30 EMA could further confirm bearish momentum toward 200 EMA.
Trade Execution Plan:
Short Entry: If the price respects the resistance area and starts to reject downward.
Stop Loss: Above the resistance at 3,010.919.
Take Profits: TP1, TP2, and TP3 as per the marked levels.
Conclusion:
Bearish Setup: If price rejects resistance.
Bullish Risk: If price breaks above resistance and holds, the trade setup is invalid.

UPL Ltd - Renko Analysis & Trade Setup
🔍 Stock: UPL Ltd (NSE)
📊 Chart Type: Renko (1% )
📆 Timeframe: Daily
Technical Analysis:
1. Resistance Zone (650-650.50)
- The price is testing a strong resistance zone around ₹650.
- This level has been previously respected, leading to pullbacks.
2. Bearish Reversal Signal
- The latest red Renko brick suggests potential downside momentum.
- A short-term correction could be in play.
3. Support Levels:
- The next major support is around ₹588-590.
- If the price fails to hold above ₹635, we might see further downside towards this level.
4. Indicators:
- The trendline still shows bullish momentum, but signs of weakness are appearing.
- RSI is currently above 60, indicating strength but also the possibility of overbought conditions.
Trade Setup:
✅ Bearish Bias: If price stays below ₹635, a potential short trade can be considered with a target of ₹590.
✅ Stop-loss: A strict stop-loss above ₹650 to protect from false breakouts.
✅ Bullish Confirmation: If price reclaims ₹650 convincingly, a breakout trade towards ₹675+ could be on the cards.
🔔 Conclusion:
UPL is at a key inflection point. A rejection at ₹650 can lead to a correction, while a breakout can fuel further upside. Keep an eye on price action for confirmation!
#UPL #Renko #StockMarket #TechnicalAnalysis #TradingView #NSE #SwingTrading

Reasons for a Neutral to Cautiously Bullish StrategyBased on current trends, technical analysis, and market forecasts, the investment strategy for Nifty 50 can be categorized as Neutral to Cautiously Bullish.
Reasons for a Neutral to Cautiously Bullish Strategy:
1. Technical Indicators:
Support Zone: 23,900–24,000 (if held, could lead to a rebound).
Resistance Levels: 24,500–24,800 (needs a breakout for a stronger rally).
Higher Lows & Recovery Attempts: A recent bounce from a key support level suggests potential stabilization.
2. Market Sentiment & News Impact:
Trade Policy Uncertainties: The market remains volatile due to global economic concerns.
Sector Strength: IT and banking stocks show resilience, supporting a potential uptrend.
Corporate Earnings & GDP Growth: Forecasts indicate moderate growth, supporting a recovery.
3. Institutional Forecasts:
PL Capital’s Target: 27,867 in 12 months (bullish outlook).
Nomura’s Range: 21,800–25,700 (neutral to moderate growth).
Jefferies’ Growth Projection: 10% gain by year-end, targeting 26,000.
Investment Strategy:
Short-Term: Neutral – Monitor price action around 24,000–24,500 before taking aggressive positions.
Medium to Long-Term: Cautiously Bullish – If Nifty sustains above 24,500, it may enter a new uptrend, making it a buy-on-dips opportunity.
Risk Management: Maintain stop-losses near 23,700 to avoid downside risks.

GBP/JPY Trading Strategy - Buy to 194GBP/JPY Trading Strategy - Buy to 194
I. Technical Analysis
1. Overall Trend
On the H4 timeframe, GBP/JPY shows signs of a bullish reversal:
The price has broken through the previous resistance zone 190.4 - 191.0 and is holding above it.
EMA 33 & EMA 50 are starting to slope upwards, indicating an uptrend.
Volume is increasing as the price bounces off the support zone.
On the D1 timeframe, GBP/JPY is recovering from a correction, aiming for the next resistance zone 194.0 - 194.2.
2. Key Support & Resistance Levels
✅ Strong Support (Potential Buy Zone):
190.2 - 190.4: Newly established support after the breakout.
189.2: Strong support; if broken, the uptrend may be invalidated.
✅ Target Resistance (Take Profit - TP):
194.0 - 194.2: Significant resistance on H4 & D1 charts.
✅ Trend Confirmation Indicators:
RSI > 55, not overbought, still has room to rise.
Volume increasing on price rise, confirming buyers' control.
II. Trade Setup
1. Entry Point
BUY entry when price retraces to 190.4 - 191.0.
Split orders:
50% of the position at 190.4.
Remaining 50% at 190.0 if the price continues to correct.
2. Stop Loss (SL)
189.2: If the price breaks this level, the uptrend is invalidated.
3. Take Profit (TP)
TP1: 192.5 → Close 50% of the position and move SL to breakeven.
TP2: 194.0 - 194.2 → Close the remaining position.
4. Risk/Reward Ratio (R:R)
Average Entry: 190.7
SL: 189.2 (-1.5 pips)
TP: 194.0 (+3.3 pips)
R:R = 2.2:1 → Favorable risk-reward ratio for swing trading.
III. Risk Management & Market Scenarios
🔸 If price moves in our favor:
✅ When the price reaches 192.5, move SL to breakeven to secure capital.
🔸 If price drops to 189.2:
❌ Exit all positions as the uptrend is invalidated.
🔸 Key signals to watch:
⚠️ If price surges past 191.8 without a pullback, consider waiting for a retracement before entering.
IV. Conc......
BUY GBP/JPY at 190.4 - 190.0, TP 194.0, SL 189.2.
Good R:R ratio (2.2:1), suitable for swing trading.
Holding period: Within this week, monitor closely.
Welcome Follow Me, Thanks!

ready to fly SPICE JETCompany Overview: SpiceJet Ltd. is one of India's leading low-cost airlines, headquartered in Gurgaon, Haryana. Established in 1984 as ModiLuft, the airline was rebranded as SpiceJet in 2004. SpiceJet operates a fleet of Boeing 737 and Bombardier Dash 8 aircraft, covering 73 destinations, including 60 domestic and 13 international routes. The airline is known for its affordable fares and innovative services, such as being the first airline in India to introduce electric tarmac coaches and mid-air cab facilities.
1. Price Chart Analysis:
Current Price: ₹45.91
Trend: The stock is currently in a consolidation phase with a potential for an upward breakout.
Target Levels: ₹60.86, ₹73.81, ₹83.02, ₹94.76
Levels:
Primary Support Zone: ₹34.90 - ₹44.50
Swing Zone: ₹48.78- ₹54.27
2. Technical Indicators:
Relative Strength Index (RSI): 43.60 (Neutral momentum)
Volume: 10.5M (Current period)
3. Key Observations:
Current Price: ₹45.91
Price Change: ₹+1.20 (+2.68%)
Volume: 10.5M
Timeframe: March 1, 2025
The stock is trading within a consolidation phase, suggesting a potential for an upward breakout.
The RSI indicates neutral momentum, suggesting that the stock is neither overbought nor oversold.
The volume indicates a healthy level of trading activity, supporting the current price movement.
4. Earnings Overview:
Q3 FY25 Net Profit: ₹26 crore
Q3 FY24 Net Loss: ₹300 crore
Revenue Growth: 35% increase to ₹1,651 crore
Key Highlights:
SpiceJet turned profitable in Q3 FY25, recording a net profit of ₹26 crore, compared to a net loss of ₹300 crore in the same quarter last year.
The airline's revenue surged by 35%, driven by strong passenger demand and improved operational efficiency.
For the first time in a decade, SpiceJet's net worth became positive, marking a significant milestone in its financial recovery.
5. Conclusion: SpiceJet Ltd. is showing signs of potential upward movement, with key resistance levels ahead. The neutral RSI suggests that there is room for further upward movement without immediate risk of overbought conditions. Investors should watch for potential breakouts above the resistance levels and monitor the support zones for any signs of reversal.

Nifty 50 - Potential Deep Correction AheadAfter analyzing the current structure of the Nifty 50 index, I believe we're looking at a potential deeper correction in the market. The larger downtrend has been playing out with Wave A completing at 23,263.15. We're now in Wave C, and a deeper correction could be expected with Wave C potentially extending further down.
Key points:
Wave 5 might be Wave 3 and could indicate a bigger correction.
Wave C could target 21,292.70, with further downside potential.
The Max retracement for Wave 4 suggests a corrective rally without violating the start of Wave 1.
Fibonacci extension indicates a deeper retracement, possibly extending beyond the 1.618 level.
I believe there's a strong chance the market might head lower, and this could mark the start of a bigger trend reversal.
Would love to hear your thoughts and if others are seeing a similar pattern! Let's see how this unfolds.
Chart Details:
Timeframe: 4-Hour Chart
Indicators: Fibonacci retracements, wave counting
Key Levels:
Target for Wave C: 21,292.70 or lower
Max retracement for Wave 4: 22,720.30
1.618 extension: Lower levels are anticipated.

Tata Steel Ltd (NSE) – Simple Technical AnalysisPrice Action:
The stock appears to have been in a downtrend within a descending channel.
Recently, the price is attempting to break out from this channel.
Support & Resistance (Pivot Points - Fibonacci Levels):
The current price is ₹138.82.
Immediate resistance: Near ₹145 - ₹150 (Pivot R1).
Major resistance: ₹183.80 (Potential upside target).
Support levels: ₹109 (S1) and lower Fibonacci pivot levels.
Technical Indicators:
MACD (Moving Average Convergence Divergence):
The MACD (blue line) is trying to cross above the Signal Line (orange line).
Histogram is reducing negative momentum, indicating a potential bullish crossover.
Trend Breakout Potential:
If the stock sustains above the descending channel, a bullish breakout towards ₹183 could be expected.
Risk-Reward Analysis:
Upside Target: ₹183 (about 32% gain from current price).
Downside Risk: ₹109 (about 21% loss from current price).
Risk-Reward Ratio: ~1.5 (favorable for long position).
Prediction & Trading Strategy:
Bullish Scenario:
If price holds above ₹140 and breaks resistance at ₹150, we can expect an upside move towards ₹183.
The MACD crossover confirms strength in price momentum.
Bearish Scenario:
If the stock fails to hold above ₹130 and re-enters the descending channel, it might revisit ₹109 or lower.
Entry & Stop Loss:
Entry: ₹140-145 (after confirming breakout).
Stop Loss: Below ₹130.
Target: ₹183.
Conclusion:
Bullish bias if breakout holds.
Wait for confirmation above ₹140-145 for a strong move.
If rejected at resistance, a drop towards ₹109 is possible.

EURUSD NEXT POSSIBLE MOVE SAXO:EURUSD
**EUR/USD Technical Analysis – February 24, 2025**
As of February 24, 2025, the EUR/USD pair is trading near the 1.0515 level, experiencing upward momentum following recent market developments.
**Key Levels:**
- **Resistance:** 1.0530, 1.0550
- **Support:** 1.0480, 1.0450
**Technical Indicators:**
- **Relative Strength Index (RSI):** The RSI is approaching overbought territory, indicating strong bullish momentum.
- **Moving Averages:** The pair is trading above both the 100 and 200 simple moving averages on the 4-hour chart, suggesting a continuation of the upward trend.
**Trade Recommendation:**
Considering the current technical setup, a **buy** position may be appropriate if the price breaks above the 1.0530 resistance level.
- **Entry Point:** Buy at 1.0540
- **Take Profit (TP):** 1.0600
- **Stop Loss (SL):** 1.0510
**Risk Management:**
This trade setup offers a reward-to-risk ratio of approximately 2:1. Ensure that your position size aligns with your risk tolerance and overall trading strategy.
**Conclusion:**
The EUR/USD pair is currently exhibiting bullish signals, influenced by recent market events such as the German election results. A sustained move above the 1.0530 resistance level could validate a buying opportunity. Traders should monitor price action closely and adjust their strategies accordingly.
*Disclaimer: Trading forex carries a high level of risk and may not be suitable for all investors. Ensure you fully understand the risks involved and seek independent advice if necessary.

Sardaen stock for watchLet's dive into the analysis of **Sarda Energy & Minerals Ltd.** (often referred to as **Sarda Energy**), which is a leading player in the Indian steel industry, focusing on both production and power generation.
### **Fundamental Analysis of Sarda Energy & Minerals Ltd.**
#### **Overview of Sarda Energy & Minerals Ltd.**
- **Sector:** Steel, Mining, Power Generation
- **Industry:** Steel, Iron & Steel Products, Power
- **Founded:** 1973 by Mr. Sushil Sarda
- **Headquarters:** Raipur, Chhattisgarh, India
- **Market Cap:** Approx. ₹5,000-6,000 crore (as per the latest data)
Sarda Energy & Minerals Ltd. (SEML) is a diversified company involved in manufacturing steel, ferro alloys, power generation, and mining. It is known for its integrated steel plant in Chhattisgarh, and the company also focuses on power generation through its captive power plants.
#### **Key Financials (Latest Report)**
- **Revenue Growth:** The company has shown steady revenue growth due to its integrated business model, which combines steel production, power generation, and mining. The demand for steel and other products has generally been stable, contributing to this growth.
- **Profitability:** Sarda Energy has shown solid profitability, driven by its strong operational efficiency and backward integration into mining. The company has also benefited from the higher demand for steel and ferro alloys in domestic and export markets.
- **Debt Levels:** The company has moderate debt levels, which are typical in the capital-intensive steel industry. However, it has shown an ability to manage its debt efficiently, with its operational cash flows supporting its debt servicing.
- **Return Ratios:** The return on equity (RoE) and return on capital employed (RoCE) ratios of Sarda Energy have generally been above industry averages, indicating efficient use of shareholder capital.
#### **Valuation Ratios**
- **P/E Ratio:** Sarda Energy's P/E ratio can fluctuate based on commodity price cycles, but it is typically in line with other steel companies of similar size and market positioning.
- **P/B Ratio:** Sarda Energy has a P/B ratio that reflects its strong asset base, driven by its mining and power generation assets. The company’s stock is likely to be valued higher due to its integrated nature and diversified revenue streams.
- **Debt-to-Equity Ratio:** As a capital-intensive sector, the company’s debt-to-equity ratio is typical of the steel industry. However, it’s crucial to watch this ratio in relation to its ability to generate consistent cash flows.
#### **Industry & Macro Trends**
- **Steel Sector Growth:** The Indian steel sector has shown steady growth in the past decade, driven by infrastructure development, urbanization, and government spending on projects. Sarda Energy, with its strong domestic presence, stands to benefit from these trends.
- **Ferro Alloy and Mining Demand:** Demand for ferro alloys and minerals (mainly manganese and iron ore) has been rising, driven by the steel and energy sectors. Sarda Energy’s backward integration into mining gives it a cost advantage and ensures supply stability.
- **Government Policy:** Initiatives like "Make in India" and infrastructure development programs by the government continue to drive demand for steel products. Additionally, policies like anti-dumping duties on imported steel could help domestic producers like Sarda Energy.
- **Commodity Price Fluctuations:** Steel and ferro alloy prices are subject to global commodity price fluctuations. While demand is growing, prices can be volatile, impacting margins.
---
### **Technical Analysis of Sarda Energy & Minerals Ltd.**
Let's look at potential technical levels and patterns for **Sarda Energy & Minerals Ltd.**, assuming the stock is being analyzed:
#### **Price Action:**
- **Current Price:** The stock price of Sarda Energy would reflect its financial performance, steel demand trends, and broader market sentiment. If the stock price is consolidating in a range, it may indicate indecision among investors.
#### **Key Levels:**
- **Support Levels:**
- **₹300-₹320:** This is an important support level where the stock might find buying interest. A breach below this level could suggest further downside risk.
- **₹280-₹290:** If the stock falls to this level, it would likely test another critical support. A bounce from here could signal a buying opportunity.
- **Resistance Levels:**
- **₹380-₹400:** A resistance level for Sarda Energy. If the stock breaks above this level with strong volume, it could suggest further upward momentum.
- **₹420-₹440:** This is another significant resistance zone where selling pressure may build. If the stock moves above this zone, it could target higher levels.
#### **Moving Averages:**
- **50-Day Moving Average (50-MA):** A close above the 50-day moving average would indicate short-term bullishness, while trading below it could suggest a bearish trend.
- **200-Day Moving Average (200-MA):** The 200-day moving average is a key indicator of the long-term trend. If the stock is trading above it, it suggests long-term strength.
#### **Momentum Indicators:**
- **RSI (Relative Strength Index):**
- If the RSI is above 70, the stock could be overbought, signaling a potential pullback.
- If the RSI is below 30, the stock could be oversold and may see a price reversal or consolidation.
- **MACD (Moving Average Convergence Divergence):**
- A bullish signal occurs when the MACD line crosses above the signal line. A bearish crossover (MACD line crossing below the signal line) would indicate a potential downtrend.
#### **Volume Analysis:**
- **Volume Trends:** Rising volume along with price increases is a bullish signal, indicating strong buying interest. Conversely, increasing volume during price declines can suggest that selling pressure is dominant.
- **Volume Spikes:** A large volume spike near key support or resistance levels can signify a potential breakout or breakdown.
---
### **Conclusion:**
- **Fundamental Strengths:**
- Sarda Energy & Minerals Ltd. has a strong position in the Indian steel, mining, and power sectors, benefiting from vertical integration, solid financial management, and a diversified revenue base.
- Its focus on high-margin products like ferro alloys and its ability to manage its debt levels provide a competitive edge in the industry.
- **Technical Outlook:**
- Support levels around ₹300-₹320 and resistance near ₹380-₹400 should be closely watched. A breakout above ₹400 could signal bullish momentum.
- The stock's 50-day and 200-day moving averages will give insight into short-term and long-term trends, while RSI and MACD will help gauge market sentiment and potential price movements.
#### **Risks to Consider:**
- **Commodity Price Volatility:** Sarda Energy’s profitability is tied to the price of steel and ferro alloys, which can be volatile.
- **Debt and Capital Intensive Nature:** The company’s capital structure and debt levels need to be monitored closely, especially if there’s a downturn in the steel market.
---
**Disclaimer:**
The information provided is for educational purposes only and should not be construed as financial or investment advice. I am not a SEBI-registered advisor, and this analysis is not a recommendation to buy, sell, or hold any securities. Accuracy and timeliness of the data cannot be guaranteed. Always conduct your own research or consult with a professional before making investment decisions. I do not take responsibility for any losses incurred.

Paytm stock breakoutLet's dive into the **Paytm (One97 Communications Ltd.)** analysis from both a **fundamental** and **technical** perspective.
### **Fundamental Analysis of Paytm (One97 Communications Ltd.)**
#### **Overview of Paytm**
- **Sector:** Financial Services, Technology
- **Industry:** Digital Payments, Financial Technology (FinTech)
- **Founded:** 2010 by Vijay Shekhar Sharma
- **Headquarters:** Noida, India
- **Market Cap:** Approx. ₹47,000 crore (as of the latest data)
Paytm is one of India’s leading digital payment platforms, offering services in mobile wallets, payments, banking, insurance, and wealth management. Paytm became a household name in India, especially after the 2016 demonetization, which significantly boosted the adoption of digital payment systems.
#### **Key Financials (Latest Report)**
- **Revenue Growth:** Paytm has shown significant growth in its top line, driven by the expansion of its digital payments and financial services products. The company has diversified into multiple areas, including lending, insurance, and wealth management.
- **Profitability:** Despite its high revenue growth, Paytm has faced challenges in achieving consistent profitability. As of the latest financial results, the company has been operating at a loss, mainly due to high customer acquisition costs, marketing, and operational expenses.
- **Debt Levels:** Paytm has taken on some debt for its expansion, but it is generally well-funded by investors, having raised significant capital through its IPO.
- **Market Share:** Paytm is one of the dominant players in India’s digital payments sector, competing with other fintech giants like Google Pay, PhonePe, and MobiKwik.
#### **Valuation Ratios**
- **P/E Ratio:** Paytm is not currently profitable, so it does not have a meaningful P/E ratio.
- **P/B Ratio:** As Paytm is still in a growth phase, its Price-to-Book (P/B) ratio reflects the market's valuation of its future growth potential. It remains relatively high compared to traditional companies.
- **Losses & Burn Rate:** Paytm has faced a high burn rate as it invests heavily in customer acquisition, technology, and expanding its financial product offerings. Investors are waiting for the company to scale and achieve profitability.
#### **Industry & Macro Trends**
- **Digital Payments Growth:** The digital payments market in India is expanding rapidly, driven by increased smartphone penetration, digital adoption, and government initiatives like UPI. Paytm stands to benefit from this market shift.
- **Financial Services Expansion:** Paytm has been diversifying into other areas of financial services, including lending, insurance, and wealth management, which should provide additional growth avenues.
- **Regulatory Risks:** Being a fintech company, Paytm is subject to regulatory scrutiny, especially around its lending practices and financial products. Changes in regulations could impact its business model.
- **Competition:** Paytm faces intense competition from established players like Google Pay, PhonePe, and Amazon Pay. Additionally, traditional banks are increasingly investing in their digital offerings, increasing the competitive pressure.
---
### **Technical Analysis of Paytm**
Let's look at Paytm's potential technical outlook based on its stock price movement, assuming you're analyzing the stock after it went public:
#### **Price Action:**
- **Current Price:** The stock price of Paytm (One97 Communications) has been volatile since its IPO, trading below its listing price at various points, reflecting investor sentiment and concerns about its long-term profitability.
- **Chart Patterns:** Given the volatility, Paytm might show consolidation patterns, breakout formations, or flag patterns that can indicate future price movement.
#### **Key Levels:**
- **Support Levels:**
- **₹600-₹620:** Paytm has found support at this range in the past, where the stock could consolidate. If the price falls here again, this could be a potential buying opportunity.
- **₹500-₹530:** A critical support zone. If the stock breaks below this level, it might suggest further downside potential.
- **Resistance Levels:**
- **₹750-₹770:** The stock has faced resistance near this level multiple times. A breakout above this resistance could indicate potential upside and momentum.
- **₹900-₹950:** This level could act as a significant barrier if the stock experiences upward momentum, representing key psychological resistance.
#### **Moving Averages:**
- **50-Day Moving Average (50-MA):** If Paytm is trading above its 50-day moving average, it suggests short-term bullishness. If it trades below, it indicates potential weakness.
- **200-Day Moving Average (200-MA):** A key indicator of long-term trend direction. If Paytm is trading above its 200-day MA, it would indicate that the long-term trend is positive.
#### **Momentum Indicators:**
- **RSI (Relative Strength Index):** The RSI gives an indication of whether the stock is overbought or oversold. If the RSI is above 70, the stock could be overbought, and if below 30, it could be oversold.
- **Current RSI:** If RSI is nearing 70, it may signal that the stock is approaching overbought conditions.
- **MACD (Moving Average Convergence Divergence):**
- A positive MACD (where the MACD line crosses above the signal line) would suggest bullish momentum, whereas a negative MACD would signal weakening momentum.
#### **Volume Analysis:**
- **Volume Trends:** Rising volume during price increases signals strong buying interest. If the stock rises without a significant increase in volume, it could indicate a lack of conviction behind the move.
- **Volume Spikes:** A large volume spike near key support or resistance levels could signal the initiation of a breakout or breakdown.
---
### **Conclusion:**
- **Fundamental Strengths:**
- Paytm is a leader in India’s digital payment sector, with a massive user base and a wide array of services.
- The company is expanding its reach in financial services, which could drive growth in the future, though profitability remains a concern.
- **Technical Outlook:**
- The stock has experienced significant volatility since its IPO, with key support levels at ₹600-₹620 and resistance levels near ₹750-₹770.
- Paytm’s ability to sustain a bullish trend will depend on breaking through resistance levels and maintaining strong volume on upward moves.
#### **Risks to Watch:**
- **Profitability Concerns:** Paytm’s high marketing and operational expenses could continue to weigh on profitability in the short term.
- **Competition & Market Sentiment:** Paytm faces competition from established fintech players and changing market dynamics, which could affect its market share and valuation.
---
**Disclaimer:**
The information provided is for educational purposes only and should not be construed as financial or investment advice. I am not a SEBI-registered advisor, and this analysis is not a recommendation to buy, sell, or hold any securities. Accuracy and timeliness of the data cannot be guaranteed. Always conduct your own research or consult with a professional before making investment decisions. I do not take responsibility for any losses incurred.

Patanjali stock Long Let’s analyze **Patanjali Foods Limited** (previously known as **Ruchi Soya Industries**), which is one of the key companies under the Patanjali group and focuses on food products, including edible oils, soya foods, and other packaged products.
### **Fundamental Analysis of Patanjali Foods Limited**
#### **Overview of Patanjali Foods Ltd.**
- **Sector:** FMCG (Fast-Moving Consumer Goods)
- **Industry:** Edible Oils & Food Processing
- **Parent Group:** Patanjali Ayurved (owned by Baba Ramdev and Acharya Balkrishna)
- **Headquarters:** Haridwar, India
- **Market Cap:** Approximately ₹50,000 crore (as per the latest reports)
Patanjali Foods is one of India’s leading companies in the edible oil and food products sector. It produces a range of products such as edible oils (under the brand name "Patanjali"), soya, and other processed foods. It has a strong presence in the Indian market, particularly after it was acquired by Patanjali Ayurved and rebranded as Patanjali Foods.
#### **Key Financials (Latest Report)**
- **Revenue Growth:** The company has shown strong growth due to its expanding product portfolio and aggressive marketing strategies. In recent years, Patanjali Foods has benefitted from the rising demand for healthy cooking oils and packaged food products.
- **Profitability:** The company’s margins have been under pressure in some years due to raw material price fluctuations (e.g., the cost of edible oils). However, Patanjali Foods remains relatively profitable.
- **Debt Levels:** Post-acquisition, Patanjali Foods has focused on reducing its debt levels and improving financial health, but it still carries some debt from its past operations before the acquisition.
- **Brand Recognition:** The Patanjali brand has a significant impact on consumer purchasing behavior in India, and its market positioning has helped it maintain a competitive edge in the food sector.
#### **Valuation Ratios**
- **P/E Ratio:** Patanjali Foods has benefited from its acquisition and transformation, but its valuation can fluctuate based on commodity price trends and the competitive landscape in the edible oils sector.
- **P/B Ratio:** Given its strong brand, Patanjali Foods may command a premium valuation compared to other food sector companies.
- **Dividend Yield:** The company pays a dividend, reflecting a strong cash flow and a shareholder-friendly approach, though the yield might vary year-to-year depending on profitability.
#### **Industry & Macro Trends**
- **Edible Oil Market:** The demand for edible oils continues to rise, especially healthy oils such as sunflower, soybean, and mustard. Patanjali Foods benefits from this trend by offering a variety of edible oil products.
- **Health-Conscious Consumers:** As consumers become more health-conscious, Patanjali's focus on natural and Ayurvedic-based products positions it well in the market.
- **Competition:** Patanjali Foods faces competition from other major edible oil brands like Marico (Saffola), Adani Wilmar (Fortune), and Hindustan Unilever (Listerine).
---
### **Technical Analysis of Patanjali Foods Limited**
If you were analyzing **Patanjali Foods Ltd.** from a technical standpoint (assuming it were a publicly traded stock), the following would apply:
#### **Price Action:**
- **Current Price:** The stock price would fluctuate based on market sentiment, commodity price movements, and company announcements.
- **Chart Patterns:** Look for potential patterns such as bullish triangles, head and shoulders, or cup-and-handle patterns that could indicate breakout opportunities or price consolidations.
#### **Key Levels:**
- **Support Levels:**
- **₹1,000-₹1,050:** Historically, stocks in this price range tend to find support. If the stock moves below this level, it may trigger further declines.
- **₹900-₹950:** This zone would likely act as a second line of defense if prices drop further.
- **Resistance Levels:**
- **₹1,200-₹1,250:** A critical resistance level, as it represents a key psychological barrier. A breakout above this level could lead to further bullish movements.
- **₹1,350-₹1,400:** The next level of resistance where significant selling pressure might come in.
#### **Moving Averages:**
- **50-Day Moving Average (50-MA):** If the stock is above the 50-day MA, it suggests short-term bullish sentiment.
- **200-Day Moving Average (200-MA):** A stock trading above the 200-day MA shows long-term strength. If the stock breaks below this level, it would indicate weakening momentum.
#### **Momentum Indicators:**
- **RSI (Relative Strength Index):** The RSI helps determine whether a stock is overbought or oversold. An RSI above 70 would indicate overbought conditions, while an RSI below 30 would indicate oversold conditions.
- **MACD (Moving Average Convergence Divergence):** A positive MACD line crossing above the signal line would indicate bullish momentum, while a negative MACD could point toward bearish signals.
#### **Volume Analysis:**
- **Volume Trends:** Rising volume during an uptrend indicates strength. If the volume increases during price declines, it could indicate selling pressure.
- **Volume Spikes:** Large volume spikes at key support or resistance levels could indicate significant shifts in market sentiment.
---
### **Conclusion:**
- **Fundamental Strengths:**
- Patanjali Foods is a strong player in the Indian edible oils and food products sector, benefiting from the growing demand for natural, healthy products.
- The company has a solid brand presence, which helps it maintain a competitive edge in an increasingly crowded FMCG space.
- The company's focus on health-conscious products has helped it gain market share in the oil and packaged food sectors.
- **Technical Outlook:**
- Key support lies around ₹1,000-₹1,050, and resistance near ₹1,200-₹1,250. A breakout above these levels could signal further bullish movement.
- Moving averages, RSI, and MACD would be important to monitor to gauge the stock's short-term and long-term trend.
Patanjali Foods' strong brand equity, along with the overall positive sentiment in the FMCG sector, makes it an interesting stock to watch for potential investment, assuming it follows the growth trajectory of its parent company, Patanjali Ayurved.
---
**Disclaimer:**
The information provided is for educational purposes only and should not be construed as financial or investment advice. I am not a SEBI-registered advisor, and this analysis is not a recommendation to buy, sell, or hold any securities. Accuracy and timeliness of the data cannot be guaranteed. Always conduct your own research or consult with a professional before making investment decisions. I do not take responsibility for any losses incurred.
