ADANIPOWER: Multibagger for coming day'sCandle pattern: Morning DOJI Star.
Bouncing from Strong Support Level (Zone)
Indicators: Bouncing from OverSOLD Region.
LONG @ 28.90 to @ 27.70
Swing trade levels Plotted on Chart.
ST_TP (Short Term Target Price): plotted on Chart.
Disclaimer: Only For STUDY. For Taking Trade Decision Consult Financial Advisor.
LIKE / Comment /Share, If useful & enriched your knowledge.
Snapshot of Intraday Chart Updated later.
Search in ideas for "INDICATORS"

OFSS: Reversal supported by Harmonic, Oscillator, Candle PatternOFSS - Reversal Supported by Harmonic + Oscillator + Candle Pattern,
Candle Pattern: Bullish PIN.
Harmonics: Bullish BUTTERFLY.
Oscillators & Indicators: RSI, Stoch-RSI, W%R (on Chart) & some others oversold.
....more on chart.
Go LONG: @ LTP +0.5% to -0.5%
Target for Swing / Intraday: on Snapshot.
Target for Short term: Plotted on Chart
For FnO Traders
Intraday / Swing trade levels for next trading day on-wards.
TARGET / Res: @ 3494, @ 3503, @ 3516, - @ 3525 (HZ), @ 3551
More Accumulation / SUP.: @ 3468, @ @ 3460, @ 3446 - @ 3436 (BZ), @ 3410.
Disclaimer: Only For STUDY. For Taking Trade Decision Consult Financial Advisor.
LIKE / Comment /Share, If useful & enriched your knowledge.

Nifty Technicals
Nifty witnessed a negative closing ending the week 355.60 points down or 3.53 per cent down.
Lets analyse, why ?
Technically , if we go by analyzing past three week candles, they were all indecisive candles,suggesting both bulls and bears are fighting for their runs. let see what are those candles.
1. Doji - Indecisive candle
2. Shooting Star - Indecisive candle
3. Spinning Top - Indecisive candle
Hence candlesticks patterns were giving us clue to stay cautious from past three weeks.
Now let observe some other patterns on the charts ,
Channels: Nifty is trading in a up trending channel and the candles we were talking above are formed near or at its upper channel.
Harmonic Pattern: A harmonic pattern called ABCD was also witnessed on the weekly chart , suggesting supply zone @10030-10050.
Indicators: Rsi was also overbought on its weekly chart and at the same time divergence can be observed on its daily and hourly chart.
Hence we had many factors, supporting this fall.
Now , what next ??
Since the patterns are strong on weekly chart, the recent fall may accentuate further .
Following are levels that going to be crucial this month
Currently index closed right at the support i.e 9700 -9720, if it manages to hold 9700, it might see some bounce back till 9800 or 9900 levels.
But if it breaks this 9700 or closes below it , the next level to watch would be 9590, 9530, 9400, 9000.

YESBBANK Reversal Signals in Techno-Funda DataYESBBANK Reversal Signals in Techno-Funda Data.
In Harmonic Pattern: Bullish SHARK.
Pattern Confirms If made a LOW in between @ 1439.50 to @ 1431 .
Major Technical Indicators: OVERSOLD .
In Hourly Chart Positive Divergence Seen in RSI, W%R & CCI .
Div. Type Start Candle Closing Price Indicator Value End Candle Closing Price Indicator Value
RSI 17/05/2017 12:00 1455 23.09 17/05/2017 15:00 1454.75 27.28
W%R 17/05/2017 12:00 1455 -96.77 17/05/2017 15:00 1454.75 -92.44
CCI 17/05/2017 12:00 1455 -168.3 17/05/2017 15:00 1454.75 -119.65
Fundamentally:
TTM PE (X) TTM Sector PE(X) OPM Sec. OPM Net Profit Var (03/2017)
20.33 26.44 76.1 66.25 30
Conclusion: LONG for Decent Upside TGT
BEST LONG @ 1440- (Aggressive as Per Risk Appetite)
TGTs (Intra): @ 1468.7, @ 1472.8 - @ 1477 (strong), @ 1484+
TGTs (Positional): @ 1495.7, @ 1506.6 , @1536+
SL: @ 1422- (By Closing) OR @ 1410, Which Comes FIRST .

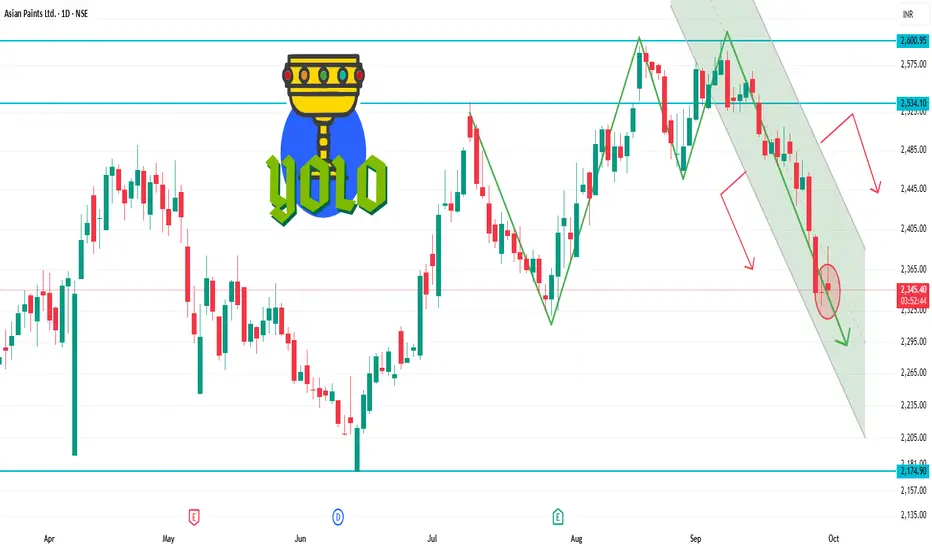
ASIANPAINT 1D Time frameCurrent Price Snapshot
Current Price: ₹2,345.50
Day’s Range: ₹2,342.00 – ₹2,388.80
52-Week Range: ₹2,124.75 – ₹3,358.00
Technical Indicators
RSI (14-day): 44.19 — indicates a neutral to slightly bearish momentum.
MACD: -4.010 — suggests bearish momentum.
Moving Averages:
5-day: ₹2,396.00 — indicates a Sell signal.
50-day: ₹2,389.00 — indicates a Sell signal.
200-day: ₹2,350.00 — indicates a Neutral signal.
Technical Summary: Predominantly Sell signals across various indicators.
Summary
Above ₹2,388.80: Potential rise toward ₹2,400 – ₹2,420.
Below ₹2,342.00: Potential fall toward ₹2,320 – ₹2,300.
Between ₹2,300 – ₹2,380: Likely range-bound movement.
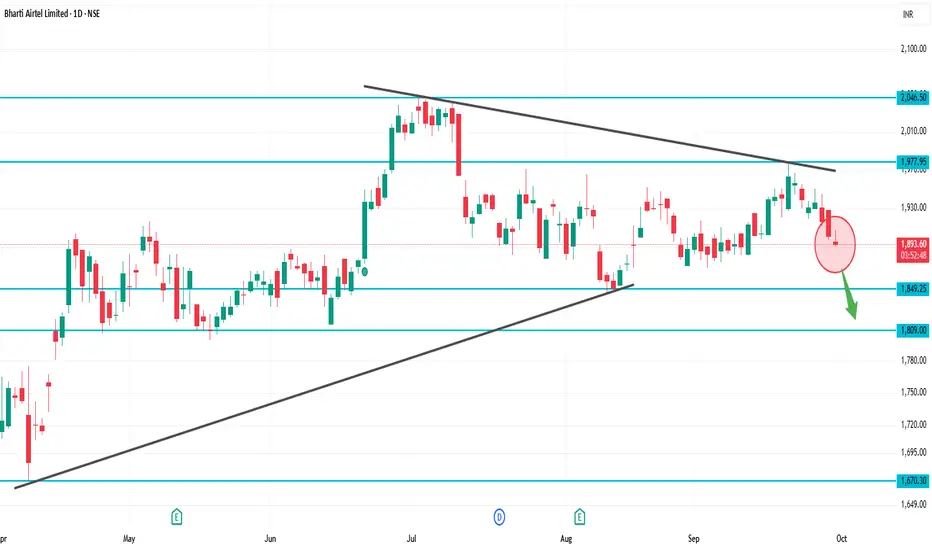
BHARTIARTL 1D Time frameCurrent Price Snapshot
Current Price: ₹1,897.80
Day’s Range: ₹1,890.80 – ₹1,907.60
52-Week Range: ₹1,511.00 – ₹2,045.80
Technical Indicators
RSI (14-day): 44.19 — indicates a neutral to slightly bearish momentum.
MACD: -4.010 — suggests bearish momentum.
Moving Averages:
5-day: ₹1,896.00 — indicates a Sell signal.
50-day: ₹1,890.00 — indicates a Sell signal.
200-day: ₹1,850.00 — indicates a Buy signal.
Technical Summary: Predominantly Sell signals across various indicators.
Summary
Above ₹1,907.60: Potential rise toward ₹1,920 – ₹1,940.
Below ₹1,890.80: Potential fall toward ₹1,880 – ₹1,860.
Between ₹1,860 – ₹1,900: Likely range-bound movement.
KOTAKBANK 1D Time frameCurrent Price Snapshot
Current Price: ₹1,991.60
Day’s Range: ₹1,990.50 – ₹2,015.00
52-Week Range: ₹1,679.05 – ₹2,301.90
Technical Indicators
RSI (14-day): 46.61 — indicates a neutral momentum.
MACD: -7.62 — suggests bearish momentum.
Moving Averages: Mixed signals — short-term averages are bearish, while long-term averages are bullish.
Technical Summary: Predominantly Sell signals across various indicators.
Summary
Above ₹2,015: Potential rise toward ₹2,050 – ₹2,100.
Below ₹1,990: Potential fall toward ₹1,950 – ₹1,900.
Between ₹1,950 – ₹2,010: Likely range-bound movement.

BAJFINANCE 1D Time frameCurrent Price Snapshot
Current Price: ₹999.00
Day’s Range: ₹989.45 – ₹1,002.30
52-Week Range: ₹645.10 – ₹1,036.00
Technical Indicators
RSI (14-day): 59.37 — indicates a neutral to slightly bullish momentum.
MACD: -4.010 — suggests bearish momentum.
Moving Averages: Mixed signals — short-term averages are bearish, while long-term averages are bullish.
Technical Summary: Predominantly Buy signals across various indicators.
Summary
Above ₹1,002.30: Potential rise toward ₹1,020 – ₹1,030.
Below ₹989.45: Potential fall toward ₹980 – ₹970.
Between ₹980 – ₹1,010: Likely range-bound movement.
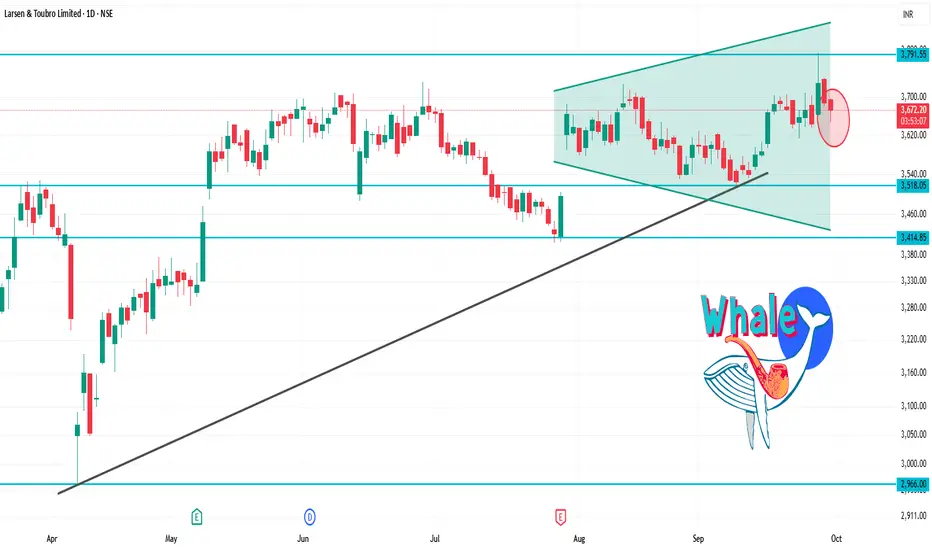
LT 1D Time frameCurrent Price: ₹3,655.30
Day’s Range: ₹3,648.00 – ₹3,696.60
52-Week Range: ₹2,965.30 – ₹3,963.50
Technical Indicators
RSI (14-day): 41.19 — indicates a neutral to slightly bearish momentum.
MACD: -1.47 — suggests bearish momentum.
Moving Averages: Mixed signals — short-term averages are bearish, while long-term averages are bullish.
Technical Summary: Predominantly Sell signals across various indicators.
Ye Chart Kuch Kehta Hai - Ramco Industries Limited (For Study)Based on the latest available fundamental and technical analysis, here is a rationale for considering a position in Ramco Industries Limited:
Fundamental Analysis
Ramco Industries has shown steady revenue growth, with a 10.5% YoY increase in Q1 FY2025-26 and a net profit growth of 28.3% in the same quarter, signaling improving operating performance and profitability.
The company’s trailing twelve months (TTM) financial ratios show a P/E of 28.55, P/B of 0.7, and P/S of 1.79, indicating that the stock may be reasonably valued with potential upside given its book value and sales metrics.
Ramco has a low debt-to-equity ratio (~0.03), indicating strong solvency and low financial risk, which supports financial stability and sustainable growth.
Recent quarters show positive trends in operating cash flow, reaching the highest in three years, suggesting good cash generation capacity.
The company is making consistent efforts to improve profitability and efficiency despite a moderate Return on Equity (ROE) around 2-4% range, indicating room for operational improvement.
Technical Analysis
The stock has been showing a positive trend with quarterly revenue and earnings growth supporting bullish momentum.
Recent trading activity shows strong volume spikes and price support near 310–345 INR levels, indicating good buyer interest at current valuation zones.
Momentum indicators and technical signals (such as MACD) reflect positive momentum and suggest a likelihood of continued upward movement in the near term.
Technical resistance levels have been tested, and breakout potential exists if these levels are decisively breached, providing a possible upside trigger.
Summary
Ramco Industries Limited presents a compelling case for investment based on solid fundamental performance improvements, positive cash flows, low leverage, and favorable technical indicators. While some fundamental metrics like ROE could improve, the company’s earnings growth and prudent financial management reduce downside risk. The stock’s current technical setup supports a potential upward price movement, making it an attractive position for investors seeking growth with moderate risk exposure.

Gold - Buy around 3627, target 3680-3699Gold Market Analysis:
Is gold trading aggressive today? Those who prefer to intercept and counter-trend trades and avoid losses are already questioning their lives. The market is like this; it's always right. Yesterday, we analyzed a long position at 3578, but the lowest point was only 3579. It's better to miss out on such a market than to make a mistake. In a one-sided rally, making a mistake is the most damaging. Today's approach remains bullish, and we're watching for buying activity. A surge doesn't have a top, and no one knows where it will be. Based on the current momentum, 3700 is just around the corner. Gold is advancing cautiously, with the daily chart pattern beginning to rise, and buying indicators are also rising. The 5-day moving average has already reached around 3594. There are essentially no selling opportunities above 3594. Yesterday's Monday rally actually exceeded market expectations. This week, I predict gains from Monday to Wednesday, with a daily correction expected on Thursday and Friday, but it will only be a correction, not a major drop. In today's Asian session, we will look for buying opportunities at support at 3627. This level provides minor support in the 1-hour chart and also supports hourly indicators. The Asian session has already reached a new high, indicating continued strength. Buying is recommended. If the price unexpectedly breaks below 3627, we will look for support in the 4-hour chart before buying. We are not considering selling during the Asian session.
Support is 3627, with strong support at 3600 and 3594. Resistance is not visible, and the market's strength-weakness dividing line is 3600.
Fundamental Analysis:
The previous sharp drop in non-farm payroll data led to a surge in gold prices. This week, we will monitor CPI data.
Trading Recommendations:
Gold - Buy around 3627, target 3680-3699

Ultracemco long targets : 12304,12332,12360,12490It has given long signal on Gann indicators today as well. It is long on most of my indicators.
Ultracemco long targets : 12304,12332,12360,12490
#Nifty50 #BankNifty #Sensex #StockMarketIndia #HNIInvestors #Swingtrading

Bullish USDJPY (Long Position)Time Frame: 1-Hour
Trade Direction: Bullish
Entry Price: 148.629
Target Price: 149.262
Stop Loss: 148.108
Risk-Reward Ratio: ~2.3:1
1. Chart Analysis:
The price action has been respecting a strong ascending trendline (blue line) indicating a consistent upward momentum over the past several hours.
Price has recently bounced off the trendline and is approaching a resistance zone near 148.6, showing potential for a continuation upward towards 149.262.
Support Level: The price has previously found support at the 148.1 level, confirming a solid demand zone in the market.
2. Indicator Support:
Exponential Moving Averages (EMA): The price is currently trading above both the 9-period and 20-period EMAs, which is a bullish sign indicating upward momentum. The EMAs are also in alignment, further supporting the bullish case.
Volume Trend: There is an increase in volume accompanying the recent bullish price action, confirming strong buying interest and supporting the idea of a potential breakout towards the target.
3. Risk Management:
The stop loss is placed just below the recent low at 148.108 to provide a reasonable buffer against any price retracement, keeping the trade within an acceptable risk range.
The target is set at 149.262, just below the key resistance level, ensuring that we capture the full potential of the current trend while minimizing the risk.
4. Trade Setup Logic:
This setup is based on the continuation of the uptrend, with strong support from both the price action and indicators. The price action has successfully bounced from the trendline, confirming a potential continuation move towards higher prices.
The target lies near a resistance zone, making it a logical point for potential profit-taking.
5. Conclusion:
The overall market structure and indicators are aligned in favor of a bullish position, providing a high-probability setup. With a clear risk-reward ratio, this trade offers a favorable risk profile and a solid chance for profit.

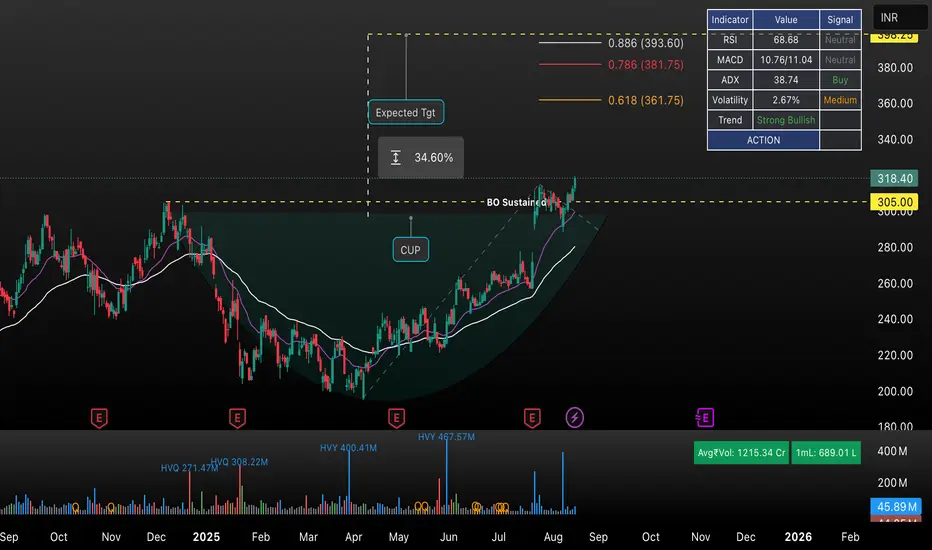
ETERNAL: Cup and Handle BreakoutThis chart presents a technical analysis of ETERNAL (ETERNAL) on the daily timeframe, captured on TradingView. A classic Cup and Handle pattern is identified, with a sustained breakout (BO Sustained) above the resistance at ₹305.00.
The projected upside (Expected Target) post-breakout highlights a potential move of approximately +34.6%, targeting the Fibonacci extension levels (0.618 at ₹361.75; 0.786 at ₹381.75; 0.886 at ₹393.60).
Indicators Panel:
• RSI: 68.68 (Neutral)
• MACD: Positive momentum
• ADX: 38.74 (Buy signal, strong trend)
• Volatility: 2.67% (Medium)
• Overall Trend: Strong Bullish
Key Technical Features:
• The breakout is accompanied by increased trading volume.
• 50EMA and 200EMA provide underlying support.
• Price action reflects strong bullish sentiment as per volatility and trend indicators.
This analysis is ideal for swing and positional traders watching for continued bullish follow-through after a classical pattern breakout.
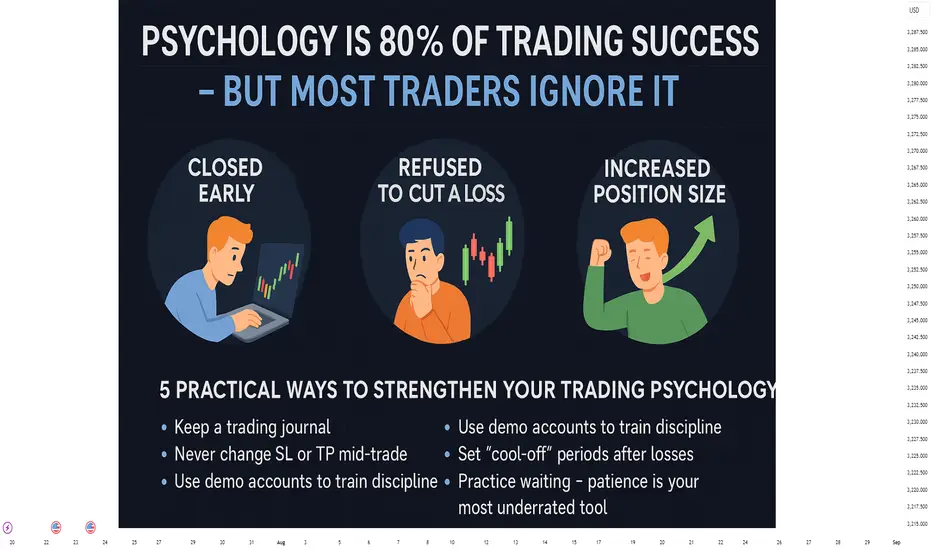
Psychology Is 80% of Trading Success But Most Traders Ignore ItPsychology Is 80% of Trading Success – But Most Traders Ignore It
“Have you ever entered a perfect trade… and still lost?”
Right direction.
Clear technical setup.
Trend confirmation was there.
Yet you closed early.
Or held a losing trade too long.
Or jumped back in out of revenge after a loss.
It wasn’t your system’s fault.
It was your psychology.
💡 Most traders don’t fail because of bad analysis – they fail because of poor emotional control
Let’s walk through some common real-life situations every trader has experienced at least once:
🎯 1. You closed your trade early – afraid the market might reverse
Case study:
A trader entered a long position on XAUUSD at a support zone (2360), aiming for TP at 2375.
But when price reached 2366, he closed out early – afraid to “lose profits.”
The market later hit his original TP perfectly.
➡️ This is classic loss aversion – the fear of losing what you’ve already gained.
🎯 2. You refused to cut a loss – hoping the price would come back
Case study:
A trader shorted EURUSD expecting a pullback, but price broke resistance and continued up.
Instead of cutting the loss, he widened his stop loss, holding onto hope.
The result? A bigger loss than planned.
➡️ This is denial – a refusal to accept you’re wrong, leading to emotional attachment to the trade.
🎯 3. You increased your position size after a winning streak
Case study:
After two strong wins, a trader feels confident and increases position size on the next trade…
Even though the setup isn’t as strong.
That trade ends in a loss – wiping out earlier profits.
➡️ This is overconfidence bias – a dangerous psychological state after wins.
📊 Technical skills only account for 20% – the remaining 80% is mastering yourself
You might:
Understand price structure
Use advanced indicators
Follow a solid trading system
But if you:
Break your stop loss rules
Scale up recklessly
Enter trades impulsively
Then your edge vanishes.
Success becomes inconsistent.
🧠 5 Practical Ways to Strengthen Your Trading Psychology
✅ Keep a trading journal – especially track your emotions
Ask: “Did I follow my plan? Or was I trading to ‘feel better’?”
✅ Never change SL or TP mid-trade
Stick to your original plan. Discipline builds consistency.
✅ Use demo accounts to train discipline, not to prove profitability
Treat each demo trade as if real money is at stake.
✅ Set mandatory “cool-off” periods after consecutive losses
For example: 2 losses = no trades for 24 hours.
✅ Practice waiting – patience is your most underrated tool
Pro traders often wait days for a valid setup. That’s not inactivity – that’s control.
🔁 Trading is not a search for the perfect system – it’s a journey of mastering your own mind
A strategy with only 55% win rate can still be highly profitable
…if paired with discipline, risk management, and emotional control.
But…
A system with 70% accuracy can still blow your account
…if your psychology breaks down under pressure.
🎯 Final Thoughts:
The financial markets reward those who can control themselves – not just those who analyze well.
You don’t need to be smarter than others.
You don’t need to master 10 indicators.
But you must be able to stay calm, act rationally, and follow your rules.
Knowledge lets you see the opportunity – but psychology determines if you survive it.
PepsiCo (PEP): A Potential Shift from Downtrend
Following a prolonged corrective phase that commenced in March 2025, PepsiCo's price action is exhibiting noteworthy signs of a potential bullish reversal. A significant breakout from a multi-week consolidation range on the daily timeframe suggests a possible shift from distribution to accumulation. This hypothesis is supported by strengthening momentum indicators and the reclamation of a key moving average, warranting a closer look at key technical levels.
Detailed Technical Analysis:
1. Price Action: Breakout from Consolidation
After establishing a clear downtrend, PEP entered a period of consolidation, forming a well-defined trading range with a base near the $127 level. Today's session saw a decisive breakout above the upper boundary of this range. Such a move often indicates an exhaustion of selling pressure and an influx of demand. For this bullish thesis to gain further conviction, continued closes above this breakout zone would be constructive. The quality of this breakout would be further substantiated by an accompanying surge in trading volume, which signals significant market participation.
2. Momentum Analysis: RSI Indicating Renewed Buying Interest
Daily RSI: The RSI on the daily chart has surged to 62. A move above the 60 level typically suggests that bullish momentum is accelerating and is now in a strong position.
Weekly RSI: On the weekly timeframe, the RSI has advanced above 42. While still below the key 50 midline, this upward trajectory from oversold territory indicates a notable waning of long-term bearish momentum and may be an early sign of a strengthening trend.
3. Trend Analysis: Reclamation of the 50 EMA
The stock has successfully achieved a close above its 50-Day EMA. This moving average is a widely watched indicator for the medium-term trend. For much of the recent downtrend, the 50 EMA acted as dynamic resistance. By reclaiming this level, it suggests a potential shift where it may now serve as dynamic support during any subsequent pullbacks.
Potential Forward Outlook & Key Levels to Monitor:
Primary Area of Resistance: The $143 zone stands out as the first significant technical hurdle. This level could coincide with prior price structure and may attract initial profit-taking from short-term traders.
Secondary Area of Resistance: Should the momentum carry the price decisively through the primary resistance, the next major level of interest appears to be around $158 . This area represents a more significant structural resistance from the preceding downtrend.
Area for Risk Management: The zone below $127 is a critical area to monitor. This level represents the floor of the recent consolidation base. A sustained break below this level would potentially invalidate the bullish breakout hypothesis and suggest a continuation of the prior downtrend.
Disclaimer: The information provided in this technical analysis is for informational and educational purposes only and should not be construed as financial or investment advice. It is an interpretation of historical price data and technical indicators. Market dynamics can change, and past performance is not indicative of future results. All trading and investment activities involve substantial risk. Always conduct your own thorough due diligence and consult with a qualified financial advisor before making any investment decisions.

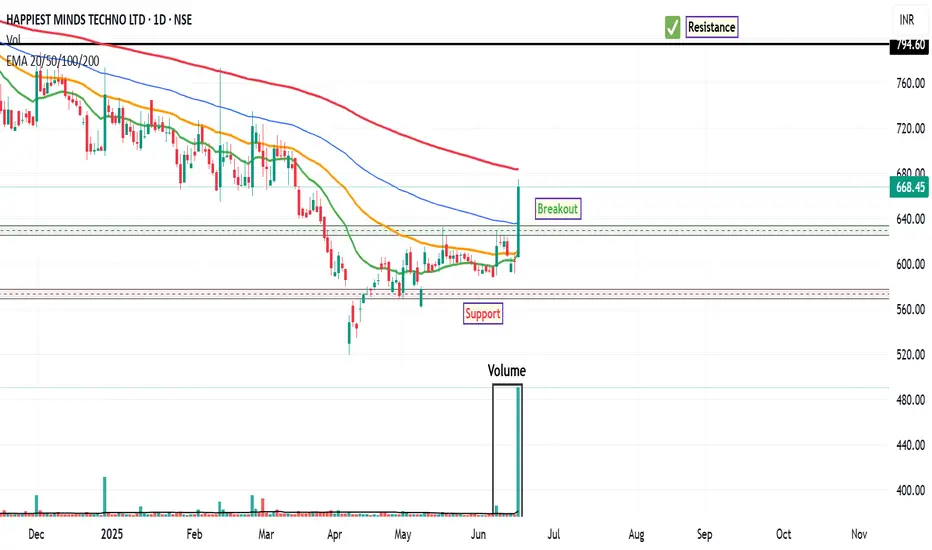
HAPPSTMND: Analysing the Bullish BreakoutHappiest Minds Technologies ( HAPPSTMND ) has recently exhibited a significant shift in market dynamics, marking a potential end to its prolonged downtrend that commenced in July 2024 . In a recent trading session, the stock registered an impressive 11% gain in single trading session signaling a resurgence of buyer interest.
This notable price appreciation was accompanied by a substantial surge in trading volume, with approximately 25M shares changing hands. This volume figure represents nearly 15 times the 20 MA volume, indicating a robust influx of buying conviction and significant market participation behind the upward move. Such a volumetric anomaly often provides strong confirmation for price breakouts or reversals.
From a momentum perspective, the technical indicators are also aligning to support a more constructive outlook. The MACD indicator on the weekly timeframe executed a bullish crossover several weeks ago, a development that typically precedes or accompanies long-term upward trends. Furthermore, the RSI has now advanced to the 54 level . While not yet in overbought territory, this move above the 50-mark suggests increasing bullish momentum and a healthy strengthening of the trend. This confluence of weekly MACD signals and improving daily RSI readings points towards a potentially strong long-term bullish movement.
Considering these technical observations, the stock may face a significant long-term resistance level around ₹794 . This level could present a crucial test for the prevailing bullish momentum, where a sustained breakout might pave the way for further upside. Conversely, for risk management purposes, traders may identify a suggested stop-loss zone and a breakout zone as illustrated on the accompanying chart, which would serve as key areas to monitor for potential shifts in price action or to define risk parameters.
Disclaimer: The information provided in this technical analysis is for informational and educational purposes only and should not be construed as financial advice. It is based on observations from historical price and volume data, and commonly used technical indicators. Market conditions can change rapidly, and past performance is not indicative of future results. All trading and investment decisions involve inherent risks, and losses can exceed initial investments. Always conduct your own comprehensive due diligence and consult with a qualified financial advisor before making any investment decisions.
INDIAN BANKAs of the close on June 2, 2025, Indian Bank (NSE: INDIANB) traded at ₹646.80, up 4.72% from the previous close of ₹617.65.
📊 Intraday Support and Resistance Levels
Based on technical analysis, here are the key intraday support and resistance levels for Indian Bank:
Support Levels:
₹620
₹600
₹585
Resistance Levels:
₹650
₹670
₹700
These levels are derived from recent price action and technical indicators. The stock has broken a strong resistance at ₹585 and is expected to move up further.
🧠 Analyst Insights
Technical indicators suggest a bullish trend for Indian Bank. The stock is trading above its key moving averages, indicating positive momentum. Analysts recommend monitoring the ₹650 resistance level closely; a decisive move above this could lead to further upside towards ₹670 and ₹700.
📈 Summary
Current Price: ₹646.80
Support Levels: ₹620, ₹600, ₹585
Resistance Levels: ₹650, ₹670, ₹700

Nalwa Sons Investment Ltd. (NSIL) Price Analysis### Nalwa Sons Investment Ltd. (NSIL) Price Analysis as of April 1, 2025:
#### **Current Price and Recent Trends**
- **Current Price (April 1, 2025):** ₹6,594.30 (Range: ₹6,268.53 - ₹6,895.56)
- **Previous Close (March 31, 2025):** ₹6,449.86
- **52-Week Range:** ₹2,245.15 - ₹9,974.00
- **All-Time High:** ₹9,974.00
#### **Key Metrics**
- **Market Cap:** ₹3,113 crore .
- **P/E Ratio (TTM):** 42.08 (High compared to sector average of 31.94)
- **Book Value Per Share:** ₹15,518.22 .
- **Dividend Yield:** 0%
#### **Technical Indicators**
- **Technical Strength:** Strong bullish momentum observed recently
- **RSI and EMA Trends:** Indicate positive momentum with potential for short-term gains
- **Volume Trends:** Average 20-day volume at 12,620 shares with a delivery percentage of 65.43%
#### **Forecast**
- **Short-Term Forecast (April 2, 2025):** Projected price range of ₹6,320.26 - ₹6,934.05 with an expected close around ₹6,613.46
- **Long-Term Outlook:** Potential growth of approximately 6.81% in one year with a target price of ₹6,570.93
#### **Strengths and Weaknesses**
**Strengths:**
- Excellent stability and strong technical indicators.
- Low Price-to-Book ratio of 0.39 suggests undervaluation relative to book value
**Weaknesses:**
- High P/E ratio indicates expensive valuations.
- Low profitability metrics such as ROA (0.45%) and ROE (0.53%)

JK Cement Ltd. – Cementing a Strong Future!JK Cement Ltd. has showcased a robust performance in Q4 FY24, marked by significant financial growth and positive technical indicators.
📊Technical Analysis:
Over the past decade, JK Cement's stock has demonstrated a consistent upward trajectory, reaching an all-time high of ₹3,800 in 2021. Following a correction to ₹2,000, the stock resumed its ascent, forming a pattern of higher lows. In January 2024, it surpassed the previous high, establishing ₹3,800 as a new support level.
The stock continued its bullish momentum, reaching ₹5,000, which acted as a resistance level. However, strong Q4 results propelled the stock beyond this barrier, and it is currently trading at ₹5,400. Notably, the trading volume surged to 1.22 million, the highest in the past 3-4 months, indicating increased investor interest.
Key Levels:
Resistance: ₹5,600 (Target 1), ₹6,000 (Target 2), ₹6,400 (Target 3)
Support: ₹5,000–₹5,100 (strong support zone), ₹4,400–₹4,600 (potential support if the first zone is breached)
💰Q4 FY24 Key Financial Highlights
Total Income: ₹3,581 Cr (vs ₹2,930 Cr in Q3 FY24 and ₹3,106 Cr in Q4 FY23)
Total Expenses: ₹2,816 Cr (vs ₹2,438 Cr in Q3 FY24 and ₹2,546 Cr in Q4 FY23)
Total Operating Profits: ₹765 Cr (vs ₹492 Cr in Q3 FY24 and ₹560 Cr in Q4 FY23)
Profit Before Tax: ₹535 Cr (vs ₹279 Cr in Q3 FY24 and ₹347 Cr in Q4 FY23)
Profit After Tax: ₹361 Cr (vs ₹190 Cr in Q3 FY24 and ₹220 Cr in Q4 FY23)
Diluted Normalized EPS: ₹46.64 (vs ₹24.54 in Q3 FY24 and ₹28.44 in Q4 FY23)
These figures reflect a substantial quarter-on-quarter improvement, highlighting the company's strong operational performance.
🔍Fundamental Highlights:
Profit Growth: Net profit increased by 64.5% year-on-year, reaching ₹361.3 Cr in Q4 FY24.
Sales Increase: Sales rose by 15.3% year-on-year to ₹3,581.2 Cr in Q4 FY24.
Volume Growth: Grey cement volume grew by 13% year-on-year, while white cement volume increased by 3%.
Dividend Announcement: Declared a total dividend of ₹20 per share, comprising a ₹15 final dividend and a ₹5 special dividend.
Capacity Expansion: Plans to double grey cement capacity to 50 million tonnes per annum by FY30, aiming for a 14% CAGR.
🧭Conclusion:
JK Cement Ltd. exhibits strong financial health and positive technical indicators, suggesting a continued bullish trend. Investors may consider monitoring the stock for potential opportunities, keeping in mind the key support and resistance levels.
Disclaimer: lnkd.in

JK Cement Ltd. – Cementing a Strong Future!JK Cement Ltd. has showcased a robust performance in Q4 FY24, marked by significant financial growth and positive technical indicators.
📊 Technical Analysis:
Over the past decade, JK Cement's stock has demonstrated a consistent upward trajectory, reaching an all-time high of ₹3,800 in 2021. Following a correction to ₹2,000, the stock resumed its ascent, forming a pattern of higher lows. In January 2024, it surpassed the previous high, establishing ₹3,800 as a new support level.
The stock continued its bullish momentum, reaching ₹5,000, which acted as a resistance level. However, strong Q4 results propelled the stock beyond this barrier, and it is currently trading at ₹5,400. Notably, the trading volume surged to 1.22 million, the highest in the past 3-4 months, indicating increased investor interest.
Key Levels:
Resistance: ₹5,600 (Target 1), ₹6,000 (Target 2), ₹6,400 (Target 3)
Support: ₹5,000–₹5,100 (strong support zone), ₹4,400–₹4,600 (potential support if the first zone is breached)
💰 Q4 FY24 Key Financial Highlights:
Total Income: ₹3,581 Cr (vs ₹2,930 Cr in Q3 FY24 and ₹3,106 Cr in Q4 FY23)
Total Expenses: ₹2,816 Cr (vs ₹2,438 Cr in Q3 FY24 and ₹2,546 Cr in Q4 FY23)
Total Operating Profits: ₹765 Cr (vs ₹492 Cr in Q3 FY24 and ₹560 Cr in Q4 FY23)
Profit Before Tax: ₹535 Cr (vs ₹279 Cr in Q3 FY24 and ₹347 Cr in Q4 FY23)
Profit After Tax: ₹361 Cr (vs ₹190 Cr in Q3 FY24 and ₹220 Cr in Q4 FY23)
Diluted Normalized EPS: ₹46.64 (vs ₹24.54 in Q3 FY24 and ₹28.44 in Q4 FY23)
These figures reflect a substantial quarter-on-quarter improvement, highlighting the company's strong operational performance.
🔍 Fundamental Highlights:
Profit Growth: Net profit increased by 64.5% year-on-year, reaching ₹361.3 Cr in Q4 FY24.
Sales Increase: Sales rose by 15.3% year-on-year to ₹3,581.2 Cr in Q4 FY24.
Volume Growth: Grey cement volume grew by 13% year-on-year, while white cement volume increased by 3%.
Dividend Announcement: Declared a total dividend of ₹20 per share, comprising a ₹15 final dividend and a ₹5 special dividend.
Capacity Expansion: Plans to double grey cement capacity to 50 million tonnes per annum by FY30, aiming for a 14% CAGR.
🧭 Conclusion:
JK Cement Ltd. exhibits strong financial health and positive technical indicators, suggesting a continued bullish trend. Investors may consider monitoring the stock for potential opportunities, keeping in mind the key support and resistance levels.
📢 Disclaimer: This report is for educational and informational purposes only and should not be considered as investment advice. Please consult with a financial advisor before making any investment decisions.

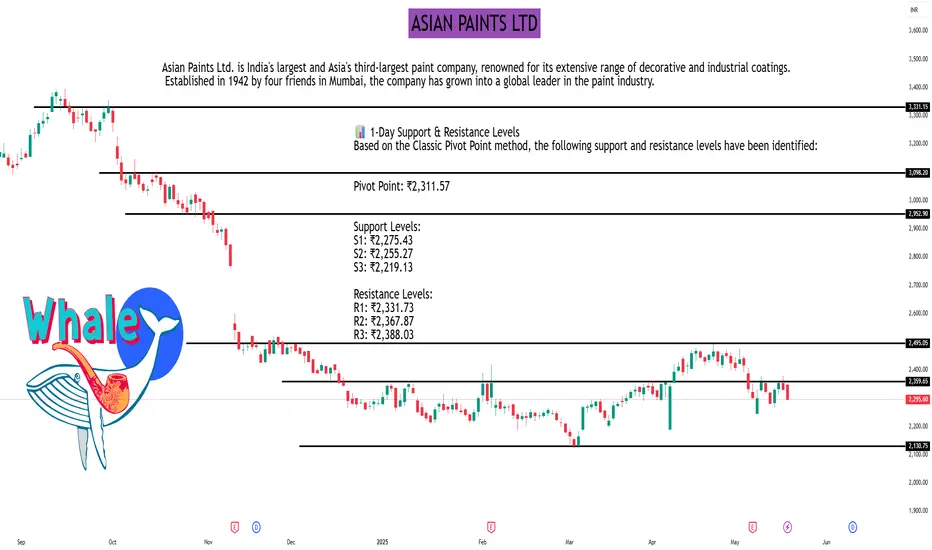
ASIAN PAINTS LTDAs of May 21, 2025, Asian Paints Ltd. (NSE: ASIANPAINT) closed at ₹2,295.60, reflecting a 1.54% decline from the previous day. The stock is currently trading approximately 32% below its 52-week high of ₹3,394.00, reached on September 16, 2024.
📊 1-Day Support & Resistance Levels
Based on the Classic Pivot Point method, the following support and resistance levels have been identified:
Pivot Point: ₹2,311.57
Support Levels:
S1: ₹2,275.43
S2: ₹2,255.27
S3: ₹2,219.13
Resistance Levels:
R1: ₹2,331.73
R2: ₹2,367.87
R3: ₹2,388.03
📈 Technical Indicators
Relative Strength Index (RSI): 41.88 – Indicates neutral momentum.
Moving Average Convergence Divergence (MACD): -15.56 – Suggests bearish momentum.
Average Directional Index (ADX): 17.09 – Reflects a weak trend strength.
Rate of Change (ROC): -5.80 – Points to a declining price momentum.
Money Flow Index (MFI): 29.47 – Indicates potential oversold conditions.
Supertrend: ₹2,468.26 – The current price is below this level, signaling a bearish trend.
📉 Moving Averages
50-day Simple Moving Average (SMA): ₹2,342.83
100-day SMA: ₹2,304.44
200-day SMA: ₹2,614.84
The current price is below all these moving averages, indicating a bearish outlook.
🔍 Market Outlook
Asian Paints Ltd. is exhibiting bearish signals across multiple technical indicators. The stock's position below key moving averages and a declining RSI suggest continued downward pressure. Traders should monitor the support levels closely; a breach below S1 (₹2,275.43) could indicate further downside, while a move above R1 (₹2,331.73) might suggest a potential reversal.
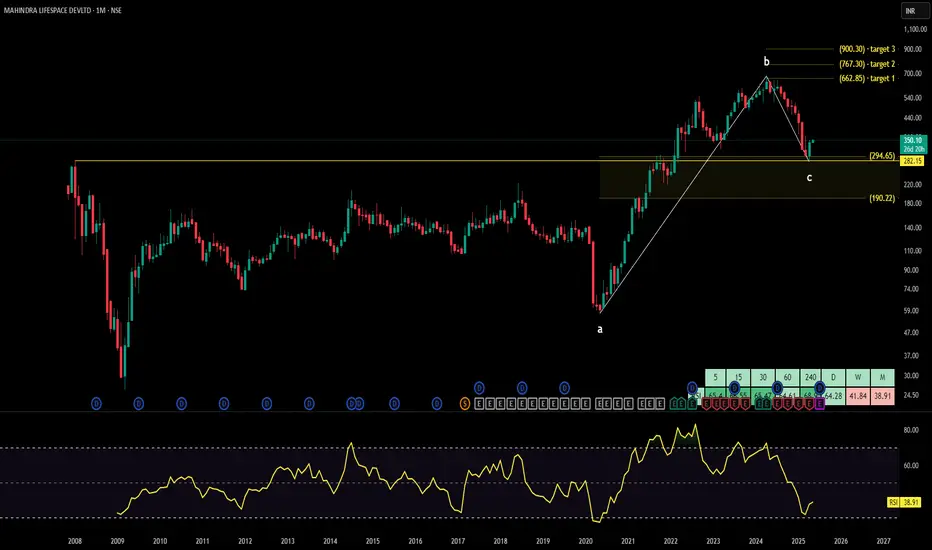
MAHINDRA LIFESPACE technical analysisMahindra Lifespace Developers Limited (NSE: MAHINDRA LIFESPACE DEVLTD), current price: INR 350.10. The company is a real estate and infrastructure development firm under the Mahindra Group, specializing in residential and commercial projects, integrated cities, and industrial clusters.
Key Levels
Support Level: INR 294.65
Swing Level: INR 373.10
Possible Upside Levels: INR 662.85, INR 767.30, INR 900.30
Technical Indicators
RSI: The Relative Strength Index (RSI) is currently at 38.91, indicating that the stock is approaching oversold territory, which may suggest a potential buying opportunity if the trend reverses.
Volume: The trading volume is 498.52K, showing a significant increase in activity, which could indicate heightened investor interest and potential volatility.
Sector and Market Context
Mahindra Lifespace Developers Limited operates within the real estate sector, which has shown mixed performance due to varying market conditions, regulatory changes, and economic factors. The overall market trends indicate cautious optimism with gradual recovery post-pandemic, but the sector remains sensitive to interest rate changes, government policies, and economic growth indicators. The stock’s performance should be monitored in relation to these broader market trends and sector-specific developments.
Risk Considerations
Economic Downturn: A slowdown in economic growth could negatively impact the real estate sector, affecting demand for residential and commercial properties.
Regulatory Changes: Government policies, such as taxation or real estate regulations, could influence the company’s operations and profitability.
Interest Rate Fluctuations: Rising interest rates could increase borrowing costs for both the company and potential buyers, potentially dampening demand.
Market Sentiment: Investor sentiment and market volatility could lead to unpredictable stock movements, influenced by broader market trends and news events.
Analysis Summary
Mahindra Lifespace Developers Limited shows potential for recovery with key support and swing levels identified. The RSI indicates the stock is nearing oversold territory, which may present a buying opportunity if the trend reverses. Increased trading volume suggests heightened investor interest, but caution is advised due to potential risks such as economic downturns, regulatory changes, and interest rate fluctuations. Investors should monitor sector and market trends closely and consider risk factors before making investment decisions.