Search in ideas for "INDICATORS"


Short ABFRL Indicators:
MACD Negative Crossover
RSI below 40
Factors against:
Fibonacci Retracement Support level around 198
No Major Volume Sellout
2 strong indicators for
1 major (volume) indicator against

NMDC short term viewIndicators are going to turn positive side for short term. It will break the triangle on coming days based on indicators. After triangle breakout, target will be @123. Most of the time I given my views before breakout by viewing indicators and having confident on that, So safer traders, can initiate trade after breakout(110 on closing basis) and risky traders can buy from this level. Stoploss: 101(closing basis)
Vijayaraghavan,
Kovilpatti.


TATA STEELIndicators:
RSI : Extremely Bullish ( Reversal can happen)
Minor Band : Bullish
Use TE Reversal for the Reversal around 363
If you like the analysis, do leave a like and follow for more such content coming up.
Analysis are my POV, hope you got bucks in your pocket to consult a financial advisor before investing :P :)

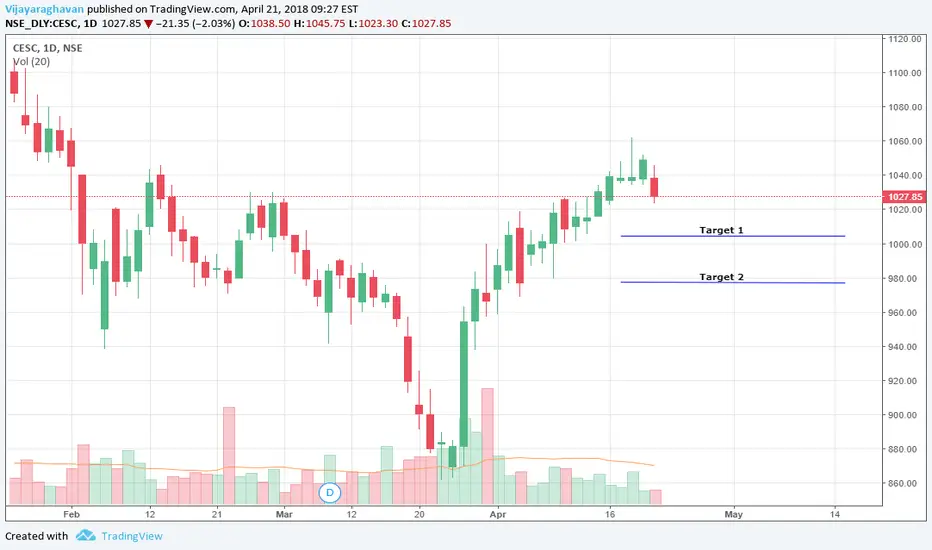
CESC Short term viewIndicators are showing some bearish signal. No patterns formed. View given fully based on indicators. Refer chart for target and stoploss
Vijayaraghavan,
Kovilpatti
Century Tex Short term viewIndicators are slowly turning to positive side. MACD crossover may happen on coming weeks in weekly chart and RSI,CCI,Stochastic are in positive mode in weekly chart, ADX showing bearish reversal. These are in Indicators/Oscillators side. Patterns side, Round bottom and triangle breakout also leads to finish the targets.
Vijayaraghavan.K
Kovilpatti

Nifty 50 – 1H Chart Breakdown
Indicators Used:
✅ 10 EMA – Red line (short-term trend)
✅ 20 EMA – Green line (medium-term trend)
✅ 200 EMA – Blue line (long-term trend)
Key Levels:
➡️ Support:
The yellow zone around 22,672.60 is acting as a strong support level, where buyers have shown interest previously.
➡️ Resistance:
23,017.60 – First resistance level.
23,208.55 – Second resistance level.
23,389.90 – Major resistance level, a breakout above this could trigger a strong bullish move.
EMA Crossover:
The 10 EMA is above the 20 EMA, signaling short-term bullish momentum.
Price has recently broken above the 200 EMA, confirming a possible trend reversal to the upside.
Cup and Handle Pattern:
The dotted pattern resembles a cup and handle formation, which is a bullish continuation pattern.
Breakout from the handle zone led to a sharp upside move.
Upside Target:
The chart shows a measured move projection of 716.40 points (~3.16%), which could lead to further upside if momentum sustains.
🚀 Outlook:
A sustained close above 23,017.60 could push Nifty towards the higher resistance zones. If the price pulls back, the support at 22,672.60 will be crucial for maintaining bullish momentum.
👉 Watch for price action near the resistance levels and EMA crossovers for confirmation! ✅
The information provided in this post is for educational and informational purposes only. It is not intended to be financial or investment advice. All trading and investing involve risk, including the possible loss of capital.
Past performance is not indicative of future results. Always conduct your own research and consult with a licensed financial advisor before making any trading or investment decisions.
The author and publisher are not responsible for any financial losses or damages incurred as a result of relying on the information provided. Trade responsibly and manage your risk carefully.

Indicators Overview & Forecast In TIA
The Celestia price analysis reveals a potential bullish path back to an all-time high price, contingent on bull's interest.
The 50-day EMA band and the 200-day EMA bands acted as hurdles, and the price approached to test them. Correspondingly, the MACD showcased growth potential via a bullish cross, as the histogram stands at 0.026, and the RSI flashed at 48.90 after jumping from 14-SMA.
Therefore, the resistance for a major rally lies between $7.96 and $11.79. The supports that bears could have an eye on are $4.32 and 2.21, respectively.

VN30- Indicators show that the market has reached its peak
- Another downtrend season
- It's difficult to determine where the bottom is


Breaking out of consolidationIndicators like rounding bottom, consolidation, reversal candles supporting further upward movement.
Buy: 1399
SL: 1310
Target: 1486----1600-----1840
#TradeTheTrend#TechnicalPick

Intellect: Short term bullishIndicators are positive and price above 21EMA. It may go upto target levels

Tata Steel Long Pro | Ready for a swing benefit for short termIndicators :
- Inverted H&S formed with a rising neck line
- Breakout from down trend line and 100 DMA
- Stock is expected to give good quarter

NIACL LONGIndicators and Reasons to buy:
-Recent MACD Crossover
-RSI Above 60
-Higher volume than the past 5 trading sessions

TATA INVESTMENT LONGIndicators/Reasons to buy:
-RSI above 60
-MACD Crossover
-Fibonacci Retracment breakout indication
-Highest volume in the past 5 trading sessions


Superhouse: Short term & Mid term view- BullishIndicators are showing bullish signals on daily chart. Round bottom forming on weekly chart. Once stays above 209 levis on weekly closing basis, may expect further more upside.
Vijayaraghavan.K,
Kovilpatti,Tuticorin dist.

