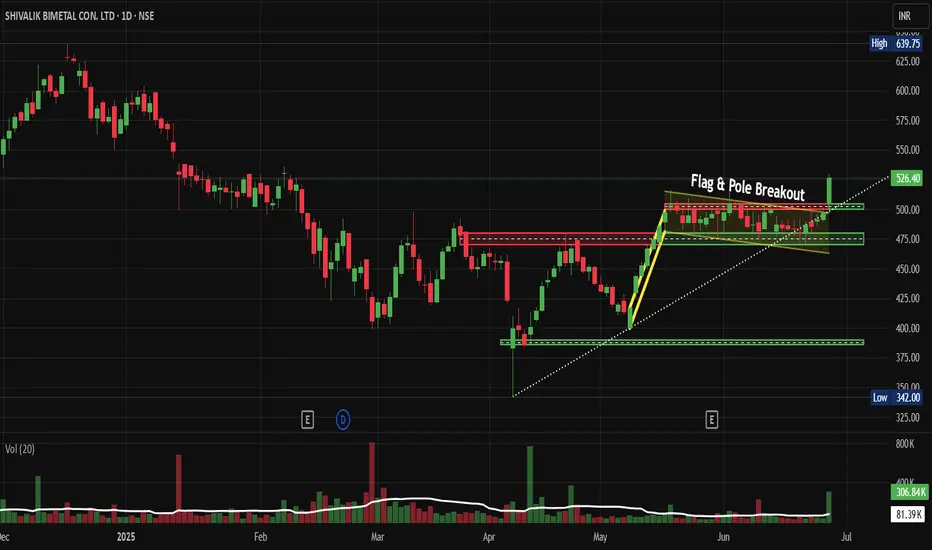
Shivalik Bimetal Controls Breaks Out Flag & Pole Pattern NSE:SBCL Breaks Out: Flag Pattern Signals Bullish Momentum in Speciality Metals Space
Price Action Analysis:
- Current Price: ₹526.40 (as of June 26, 2025)
- Daily Gain: +29.05 (+5.84%)
- 52-Week High: ₹639.75
- 52-Week Low: ₹342.00
- Trading Volume: 306.84K (compared to 20-day average of 81.39K)
Volume Spread Analysis:
- Breakout Volume: 306.84K (nearly 4x the 20-day average)
- Volume Confirmation: Strong volume surge supports genuine breakout
- Volume Pattern: Declining volume during flag formation, followed by expansion on breakout
Base Formation:
- Consolidation Base: Formed between April-May 2025 around ₹400-450 levels
- Duration: Approximately 6-8 weeks of sideways movement
- Characteristics: Healthy consolidation after initial rally from ₹375 lows
Chart Pattern Analysis:
- Primary Pattern: Bull Flag & Pole Breakout
- Flag Formation: Formed between May and June 2025 in the ₹475-500 range
- Pole Height: Approximately ₹125 (from ₹375 to ₹500)
- Breakout Confirmation: Stock broke above ₹500 resistance with strong volume
- Target Projection: ₹625-650 based on flag pole measurement
Key Technical Levels:
Support Levels:
- Immediate Support: ₹500 (previous resistance turned support)
- Secondary Support: ₹475 (flag pattern lower boundary)
- Major Support: ₹400 (psychological level and previous consolidation zone)
Resistance Levels:
- Immediate Resistance: ₹550-560 (short-term target)
- Major Resistance: ₹625-650 (flag pattern target)
- All-Time High: ₹639.75 (to be watched closely)
Trade Setup Analysis:
Long Position Setup:
- Entry Strategy: Breakout above ₹500 with volume confirmation
- Risk-Reward Ratio: 1:3 (favourable setup)
- Time Horizon: 3-6 months for target achievement
- Pattern Reliability: High (bull flag patterns have 70%+ success rate)
Entry Levels:
- Aggressive Entry: ₹526-530 (current market price)
- Conservative Entry: ₹510-515 (on pullback to breakout level)
- Accumulation Zone: ₹500-520 (for larger positions)
Exit Levels:
- Target 1: ₹580-590 (intermediate target - 15% upside)
- Target 2: ₹625-640 (pattern target - 22-25% upside)
- Final Target: ₹650-670 (extended target based on momentum)
Stop-Loss Strategy:
- Initial Stop-Loss: ₹475 (below flag pattern support)
- Trailing Stop: Implement an 8-10% trailing stop after 15% gains
- Conservative Stop: ₹490 (closer stop for risk-averse traders)
Position Sizing Recommendations:
- Conservative Allocation: 2-3% of portfolio
- Moderate Allocation: 4-5% of portfolio
- Aggressive Allocation: 6-8% of portfolio (for high-risk tolerance)
Risk Management Framework:
Risk Assessment:
- Pattern Risk: 25-30% (typical bull flag failure rate)
- Market Risk: Consider broader market conditions
- Sector Risk: Speciality metals and electronics component sector exposure
- Liquidity Risk: Moderate (average daily volume of 81.39K)
Risk Mitigation Strategies:
- Diversification across multiple positions
- Gradual position building rather than lump sum entry
- Regular monitoring of volume and price action
- Adherence to predetermined stop-loss levels
- Profit booking at intermediate targets
Money Management Rules:
- Maximum loss per trade: 2-3% of portfolio
- Position sizing based on stop-loss distance
- Avoid averaging down on losing positions
- Scale out profits at predetermined levels
Fundamental Backdrop:
Company Overview:
- Business Focus: Manufacturing and sales of Thermostatic Bimetal/Trimetal strips, Current Sense Metal Strip Shunts/Resistors, and electron beam welded products
- Operating Since: Commercial production since October 1986
- Headquarters: New Delhi, India
Financial Performance:
- Market Capitalization: ₹3,027 crores
- Annual Revenue: ₹508.35 crores (TTM)
- Pre-tax Margin: 20% (considered great)
- Return on Equity: 20.6% (exceptional performance)
- Debt-to-Equity: 0.08 (healthy balance sheet)
Recent Quarterly Results:
- Q4 FY2025 Revenue: ₹132 crores
- Q4 FY2025 Net Profit: ₹21 crores
- Q3 FY2025 Net Profit Growth: 7.55% YoY to ₹18 crores
Promoter Holding Concerns:
- Current Promoter Holding: 33.18% (considered low)
- 3-Year Trend: Decreased by 27.4% over the last 3 years
Sectoral Analysis:
Industry Positioning:
- Sector: Speciality Metals and Electronic Components
- Niche Market: Thermostatic bimetal strips for temperature control applications
- End Markets: Electronics, automotive, appliances, and industrial equipment
- Market Position: Established player with specialized manufacturing capabilities
Sector Outlook:
- Growing demand for temperature control solutions in electronics
- Increasing automation in the automotive and industrial sectors
- Focus on energy efficiency, driving demand for precision components
- Import substitution opportunities in specialised metal products
Competitive Advantages:
- Financial Stability: Appears financially stable compared to competitors
- Specialized manufacturing expertise in electron beam welding
- Established customer relationships since 1986
- Low debt levels provide financial flexibility
Technical Indicators Summary:
Momentum Indicators:
- RSI: In overbought territory post-breakout (monitor for divergence)
- MACD: Bullish crossover expected on breakout
- Volume: Strong confirmation of breakout validity
Trend Indicators:
- Moving Averages: Stock trading above key moving averages
- Trend Direction: Bullish short to medium term
- Support Levels: Well-defined support structure
Risk Indicators:
- Volatility: Moderate to high given recent breakout
- Liquidity: Adequate for position sizes recommended
- Market Correlation: Monitor broader market trends
My Take:
The technical setup for NSE:SBCL presents a compelling bull flag breakout opportunity with strong volume confirmation. The pattern projects targets of ₹625-650, representing potential upside of 22-25% from current levels. However, the declining promoter holding and moderate liquidity require careful position sizing and risk management.
Recommended approach is to enter on any pullback to ₹510-515 levels with a stop-loss at ₹475, targeting ₹580-590 for the first leg of the move. The company's strong financial metrics and niche market positioning support the technical breakout, making this an attractive medium-term opportunity for technically oriented investors.
Keep in the Watchlist.
NO RECO. For Buy/Sell.
📌Thank you for exploring my idea! I hope you found it valuable.
🙏FOLLOW for more
👍BOOST if you found it useful.
✍️COMMENT below with your views.
Meanwhile, check out my other stock ideas on the right side until this trade is activated. I would love your feedback.
Disclaimer: "I am not a SEBI REGISTERED RESEARCH ANALYST AND INVESTMENT ADVISER."
This analysis is intended solely for informational and educational purposes and should not be interpreted as financial advice. It is advisable to consult a qualified financial advisor or conduct thorough research before making investment decisions.
Search in ideas for "INDICATORS"
NIFTY : The tentative stage of a market melt-up stage in PROB#2NIFTY Projection Case Study:
Probability #2
Target Levels & Tentative Timings are marked in chart
In order to navigate the current market uncertainties effectively, it is crucial to grasp the specific stage of the market melt-up. Recognizing whether the market is in the early uptrend, an acceleration phase, or exhibiting signs of overbought conditions provides valuable insights for strategic decision-making. Acknowledging the risks associated with melt-ups, such as overvaluation and herding behavior, enables us to implement sound risk management practices. Similarly, being attuned to the potential dangers of a market melt-down, including fast declines and panic selling, empowers us to make informed decisions in this dynamic and ever-changing market environment.
A market melt-up typically occurs during the late stages of a bull market when investors rush to buy stocks, driving prices sharply higher. It is characterized by a sudden and intense upward momentum fueled by FOMO (fear of missing out). Melt-ups often precede market corrections or downturns, so caution is advised when witnessing extreme bullish behavior.
The exact timing of a market melt-up in NIFTY happened between 2003 to 2008. The rapid and excessive increase in asset prices driven by speculative buying and fear of missing out resulted in the 2008 financial crisis was marked by a severe downturn, triggered primarily by the collapse of the subprime mortgage market in the United States.
The duration of a melt-up can vary, and there is no fixed timeline for how long it lasts. Melt-ups are characterized by a rapid and intense upward movement in prices, often driven by speculative and fear-of-missing-out (FOMO) behavior among investors. The duration can be influenced by various technical factors, including market conditions, economic indicators, and global events.
In some cases, a melt-up can be relatively short-lived, with prices soaring over a few weeks or months before experiencing a correction. However, in other instances, a melt-up might extend for a more prolonged period if the speculative frenzy and optimistic sentiment persist even for several months or even years.
It's important to note that while melt-ups can result in significant gains, they often precede market corrections or downturns. Investors & traders should exercise caution and be aware of the potential risks associated with the unsustainable nature of extreme upward movements in asset prices. Monitoring market conditions using potential technical indicators and navigating using geometric analysis can help traders & investors make well-informed decisions during such periods.
In technical analysis, a melt-up is often characterized by rapid and aggressive upward price movements. Here are some technical indicators and patterns that might be associated with a typical melt-up:
Sharp Price Spikes: Look for sudden and substantial increases in the price of the asset, often accompanied by high trading volumes. This indicates strong buying interest.
Breakouts and Gaps: Melt-ups may involve breakouts above key resistance levels and price gaps as buyers enthusiastically enter the market, pushing prices higher without waiting for traditional technical levels.
Overbought Conditions: Indicators and oscillators to identify overbought conditions. Extremely high values can indicate that the market is overextended and vice versa.
Parabolic Moves: A parabolic price pattern, where the price accelerates upward in a steep curve, is often associated with a melt-up. This can be identified on a price chart.
FOMO Behavior: Market sentiment plays a crucial role in a melt-up. Watch for signs of Fear of Missing Out (FOMO) behavior among investors, which can contribute to an unsustainable rally.
Low Volatility Pullbacks: During a melt-up, pullbacks might be short-lived and characterized by low volatility. Buyers may quickly step in to take advantage of any dips.
It's important to note that while these indicators may suggest a melt-up, market dynamics can change, and there's always a level of unpredictability.
Risk management and staying informed about broader market conditions are crucial when navigating such extreme scenarios.
Melt-Up Factors observed in Technical Analysis:
Strong Momentum Indicators:
Bullish momentum, as indicated by rising indicators & oscillators having positive readings, can attract more buyers, fueling a melt-up.
Breakout Patterns:
Identification of bullish chart patterns like breakouts or continuation patterns may signal a strong upward move and contribute to a melt-up scenario.
Volume Surge:
High trading volumes accompanying the uptrend suggest increased participation and confidence among investors, reinforcing the melt-up trend.
Supportive Trendlines:
Upward-sloping trendlines provide a visual representation of the bullish trend, and their support can encourage further buying interest.
Liquidity Influx:
Positive market sentiment and an influx of liquidity, possibly driven by accommodative monetary policies, can contribute to a melt-up by facilitating higher valuations. Optimistic Market Psychology:
Positive news, economic indicators, or corporate earnings can create a bullish psychological environment, encouraging traders to adopt a buy-and-hold mentality.
Melt-Down Factors observed in Technical Analysis:
Divergence in Momentum Indicators:
Negative divergences in momentum indicators & oscillators can signal weakening upward momentum, potentially indicating an impending melt-down.
Bearish Reversal Patterns:
Recognition of bearish chart patterns, such as head and shoulders or double tops, can suggest a potential reversal in the trend, leading to a melt-down.
Increasing Selling Volumes:
A surge in selling volumes during a downtrend reflects strong selling pressure, exacerbating the downward movement and contributing to a melt-down.
Violation of Support Levels:
Breaking below key support levels or trendlines may trigger stop-loss orders and further selling, accelerating the melt-down process.
Market Sentiment Shifts:
Negative news, economic downturns, or geopolitical uncertainties can shift market sentiment, prompting investors to exit positions and contribute to a melt-down.
Liquidity Drying Up:
Reduced liquidity in the market, possibly due to risk aversion or tightening monetary policies, can exacerbate price declines during a melt-down.
Analyzing these technical factors provides insights into the dynamics of market movements, helping traders and investors navigate both bullish and bearish scenarios.
Stages of Melt-Up Using Technical Analysis:
Early Uptrend Recognition:
Identification of the initial signs of a bullish trend through technical indicators like moving averages, positive momentum, and breakout patterns.
Acceleration Phase:
Confirmation of the uptrend with strong momentum indicators, increasing trading volumes, and the development of bullish chart patterns, leading to an acceleration of price gains.
Overbought Conditions:
Recognition of overbought conditions using indicators, suggesting that the market may be reaching an unsustainable level of buying activity.
FOMO and Speculative Buying:
Increased speculation and FOMO behavior among investors, as indicated by rapid price increases, a surge in retail trading activity, and a shift towards riskier assets.
Parabolic Price Movement:
Observation of parabolic price movement, characterized by steep and unsustainable upward curves on charts, signaling an intensified phase of the melt-up.
Market Exuberance:
High levels of market exuberance and positive sentiment, possibly fueled by media coverage and optimistic economic outlooks, contributing to a euphoric atmosphere.
Stages of Melt-Down Using Technical Analysis:
Early Signs of Weakness:
Identification of initial signs of weakness in the uptrend, including negative divergences in momentum indicators, bearish reversal patterns, or a failure to sustain higher highs.
Loss of Key Support:
Breaking below key support levels or trendlines, triggering concerns among technical analysts about a potential shift in the trend.
Increased Selling Pressure:
Surge in selling volumes accompanied by downward price movements, signaling increased selling pressure and a potential acceleration of the melt-down.
Bearish Chart Patterns Confirmation:
Confirmation of bearish chart patterns, such as head and shoulders or double tops, supporting the case for a sustained downtrend.
Fear and Panic Selling:
Elevated fear and panic selling as investors rush to exit positions, exacerbating the downward pressure on prices.
Breakdown of Critical Levels:
Breaking through critical support levels, possibly triggering algorithmic trading strategies and stop-loss orders, intensifying the melt-down.
Understanding these stages using technical analysis can help traders and investors make informed decisions and implement risk management strategies during both melt-up and melt-down scenarios.
Risk and Dangers of a Market Melt-Up:
Overvaluation:
Melt-ups can lead to overvaluation, where asset prices detach from underlying fundamentals. This poses a risk of substantial losses when the market corrects.
Herding Behavior:
Investors may engage in herding behavior during a melt-up, following the crowd without considering fundamentals, increasing the risk of a sharp reversal.
Sudden Corrections:
Melt-ups are often followed by sudden corrections or market downturns. Investors entering late in the rally may face significant losses if they don't exit positions in time.
Excessive Risk-Taking:
The euphoria of a melt-up can lead to excessive risk-taking and leveraged positions, increasing vulnerability to market volatility.
Risk and Dangers of a Market Melt-Down:
Fast and Sharp Declines:
Melt-downs are characterized by fast and sharp declines in prices, catching investors off guard and resulting in substantial portfolio losses.
Panic Selling:
Fear and panic selling during a melt-down can exacerbate the decline, causing a cascading effect as more investors rush to liquidate positions.
Liquidity Issues:
Melt-downs may lead to liquidity issues, making it challenging for investors to exit positions at desired prices, amplifying losses.
Financial System Stress:
Severe market downturns can stress the financial system, potentially leading to disruptions in banking and other financial institutions.
Economic Impact:
Market melt-downs can have broader economic consequences, affecting consumer confidence, business investments, and overall economic stability.
A market melt-up poses risks as it can lead to overvaluation, herding behavior, and sudden corrections. Investors might be drawn into a euphoric buying frenzy, neglecting underlying fundamentals and taking excessive risks.
The danger lies in the potential for significant losses when the market corrects, catching latecomers off guard. Conversely, a market melt-down carries the risk of fast and sharp declines, triggering panic selling and liquidity issues. The rapid deterioration can stress the financial system, impacting not just investors but also having broader economic consequences. Both scenarios require vigilant risk management, strategic decision-making, and adaptability to navigate the inherent dangers associated with extreme market movements.
Using Technical Analysis to Mitigate Risks:
Risk Management:
Set clear risk management strategies, including stop-loss orders and position sizing, to protect against significant losses.
Diversification:
Diversify your portfolio across different asset classes to spread risk and reduce the impact of a severe market event.
Stay Informed:
Regularly monitor technical indicators, trend reversals, and market sentiment to stay informed about potential shifts in market conditions.
Avoid Chasing Trends:
Avoid chasing trends during melt-ups and practice disciplined investing to mitigate the risk of entering the market at unsustainable levels.
Adaptability:
Be adaptable and ready to adjust your investment strategy based on changing technical signals and market dynamics.
While technical analysis can provide valuable insights, it's essential to combine it with a holistic approach to risk management and a thorough understanding of market dynamics to navigate the challenges associated with both melt-ups and melt-downs.
Disclaimer:
The information provided in the technical analysis charts published on this TradingView account is for educational and informational purposes only. It does not constitute financial advice, investment recommendations, or trading strategies.
Trading and investing in financial markets involve risk, and past performance is not indicative of future results. The charts and analysis presented here may not guarantee accuracy or completeness, and users are encouraged to conduct their own research and seek professional advice before making any investment decisions.
The author of these charts is not responsible for any losses, damages, or other liabilities arising from the use of the information presented. Users should be aware of the inherent risks associated with trading and carefully consider their financial situation and risk tolerance before engaging in any trading activities.
By accessing and using the information provided in these charts, users acknowledge and agree to the terms of this disclaimer.

NIFTY : The tentative stage of a market melt-up stage in PROB#1NIFTY Projection Case Study:
Probability #1
Target Levels & Tentative Timings are marked in chart
In order to navigate the current market uncertainties effectively, it is crucial to grasp the specific stage of the market melt-up. Recognizing whether the market is in the early uptrend, an acceleration phase, or exhibiting signs of overbought conditions provides valuable insights for strategic decision-making. Acknowledging the risks associated with melt-ups, such as overvaluation and herding behavior, enables us to implement sound risk management practices. Similarly, being attuned to the potential dangers of a market melt-down, including fast declines and panic selling, empowers us to make informed decisions in this dynamic and ever-changing market environment.
A market melt-up typically occurs during the late stages of a bull market when investors rush to buy stocks, driving prices sharply higher. It is characterized by a sudden and intense upward momentum fueled by FOMO (fear of missing out). Melt-ups often precede market corrections or downturns, so caution is advised when witnessing extreme bullish behavior.
The exact timing of a market melt-up in NIFTY happened between 2003 to 2008. The rapid and excessive increase in asset prices driven by speculative buying and fear of missing out resulted in the 2008 financial crisis was marked by a severe downturn, triggered primarily by the collapse of the subprime mortgage market in the United States.
The duration of a melt-up can vary, and there is no fixed timeline for how long it lasts. Melt-ups are characterized by a rapid and intense upward movement in prices, often driven by speculative and fear-of-missing-out (FOMO) behavior among investors. The duration can be influenced by various technical factors, including market conditions, economic indicators, and global events.
In some cases, a melt-up can be relatively short-lived, with prices soaring over a few weeks or months before experiencing a correction. However, in other instances, a melt-up might extend for a more prolonged period if the speculative frenzy and optimistic sentiment persist even for several months or even years.
It's important to note that while melt-ups can result in significant gains, they often precede market corrections or downturns. Investors & traders should exercise caution and be aware of the potential risks associated with the unsustainable nature of extreme upward movements in asset prices. Monitoring market conditions using potential technical indicators and navigating using geometric analysis can help traders & investors make well-informed decisions during such periods.
In technical analysis, a melt-up is often characterized by rapid and aggressive upward price movements. Here are some technical indicators and patterns that might be associated with a typical melt-up:
Sharp Price Spikes: Look for sudden and substantial increases in the price of the asset, often accompanied by high trading volumes. This indicates strong buying interest.
Breakouts and Gaps: Melt-ups may involve breakouts above key resistance levels and price gaps as buyers enthusiastically enter the market, pushing prices higher without waiting for traditional technical levels.
Overbought Conditions: Indicators and oscillators to identify overbought conditions. Extremely high values can indicate that the market is overextended and vice versa.
Parabolic Moves: A parabolic price pattern, where the price accelerates upward in a steep curve, is often associated with a melt-up. This can be identified on a price chart.
FOMO Behavior: Market sentiment plays a crucial role in a melt-up. Watch for signs of Fear of Missing Out (FOMO) behavior among investors, which can contribute to an unsustainable rally.
Low Volatility Pullbacks: During a melt-up, pullbacks might be short-lived and characterized by low volatility. Buyers may quickly step in to take advantage of any dips.
It's important to note that while these indicators may suggest a melt-up, market dynamics can change, and there's always a level of unpredictability.
Risk management and staying informed about broader market conditions are crucial when navigating such extreme scenarios.
Melt-Up Factors observed in Technical Analysis:
Strong Momentum Indicators:
Bullish momentum, as indicated by rising indicators & oscillators having positive readings, can attract more buyers, fueling a melt-up.
Breakout Patterns:
Identification of bullish chart patterns like breakouts or continuation patterns may signal a strong upward move and contribute to a melt-up scenario.
Volume Surge:
High trading volumes accompanying the uptrend suggest increased participation and confidence among investors, reinforcing the melt-up trend.
Supportive Trendlines:
Upward-sloping trendlines provide a visual representation of the bullish trend, and their support can encourage further buying interest.
Liquidity Influx:
Positive market sentiment and an influx of liquidity, possibly driven by accommodative monetary policies, can contribute to a melt-up by facilitating higher valuations. Optimistic Market Psychology:
Positive news, economic indicators, or corporate earnings can create a bullish psychological environment, encouraging traders to adopt a buy-and-hold mentality.
Melt-Down Factors observed in Technical Analysis:
Divergence in Momentum Indicators:
Negative divergences in momentum indicators & oscillators can signal weakening upward momentum, potentially indicating an impending melt-down.
Bearish Reversal Patterns:
Recognition of bearish chart patterns, such as head and shoulders or double tops, can suggest a potential reversal in the trend, leading to a melt-down.
Increasing Selling Volumes:
A surge in selling volumes during a downtrend reflects strong selling pressure, exacerbating the downward movement and contributing to a melt-down.
Violation of Support Levels:
Breaking below key support levels or trendlines may trigger stop-loss orders and further selling, accelerating the melt-down process.
Market Sentiment Shifts:
Negative news, economic downturns, or geopolitical uncertainties can shift market sentiment, prompting investors to exit positions and contribute to a melt-down.
Liquidity Drying Up:
Reduced liquidity in the market, possibly due to risk aversion or tightening monetary policies, can exacerbate price declines during a melt-down.
Analyzing these technical factors provides insights into the dynamics of market movements, helping traders and investors navigate both bullish and bearish scenarios.
Stages of Melt-Up Using Technical Analysis:
Early Uptrend Recognition:
Identification of the initial signs of a bullish trend through technical indicators like moving averages, positive momentum, and breakout patterns.
Acceleration Phase:
Confirmation of the uptrend with strong momentum indicators, increasing trading volumes, and the development of bullish chart patterns, leading to an acceleration of price gains.
Overbought Conditions:
Recognition of overbought conditions using indicators, suggesting that the market may be reaching an unsustainable level of buying activity.
FOMO and Speculative Buying:
Increased speculation and FOMO behavior among investors, as indicated by rapid price increases, a surge in retail trading activity, and a shift towards riskier assets.
Parabolic Price Movement:
Observation of parabolic price movement, characterized by steep and unsustainable upward curves on charts, signaling an intensified phase of the melt-up.
Market Exuberance:
High levels of market exuberance and positive sentiment, possibly fueled by media coverage and optimistic economic outlooks, contributing to a euphoric atmosphere.
Stages of Melt-Down Using Technical Analysis:
Early Signs of Weakness:
Identification of initial signs of weakness in the uptrend, including negative divergences in momentum indicators, bearish reversal patterns, or a failure to sustain higher highs.
Loss of Key Support:
Breaking below key support levels or trendlines, triggering concerns among technical analysts about a potential shift in the trend.
Increased Selling Pressure:
Surge in selling volumes accompanied by downward price movements, signaling increased selling pressure and a potential acceleration of the melt-down.
Bearish Chart Patterns Confirmation:
Confirmation of bearish chart patterns, such as head and shoulders or double tops, supporting the case for a sustained downtrend.
Fear and Panic Selling:
Elevated fear and panic selling as investors rush to exit positions, exacerbating the downward pressure on prices.
Breakdown of Critical Levels:
Breaking through critical support levels, possibly triggering algorithmic trading strategies and stop-loss orders, intensifying the melt-down.
Understanding these stages using technical analysis can help traders and investors make informed decisions and implement risk management strategies during both melt-up and melt-down scenarios.
Risk and Dangers of a Market Melt-Up:
Overvaluation:
Melt-ups can lead to overvaluation, where asset prices detach from underlying fundamentals. This poses a risk of substantial losses when the market corrects.
Herding Behavior:
Investors may engage in herding behavior during a melt-up, following the crowd without considering fundamentals, increasing the risk of a sharp reversal.
Sudden Corrections:
Melt-ups are often followed by sudden corrections or market downturns. Investors entering late in the rally may face significant losses if they don't exit positions in time.
Excessive Risk-Taking:
The euphoria of a melt-up can lead to excessive risk-taking and leveraged positions, increasing vulnerability to market volatility.
Risk and Dangers of a Market Melt-Down:
Fast and Sharp Declines:
Melt-downs are characterized by fast and sharp declines in prices, catching investors off guard and resulting in substantial portfolio losses.
Panic Selling:
Fear and panic selling during a melt-down can exacerbate the decline, causing a cascading effect as more investors rush to liquidate positions.
Liquidity Issues:
Melt-downs may lead to liquidity issues, making it challenging for investors to exit positions at desired prices, amplifying losses.
Financial System Stress:
Severe market downturns can stress the financial system, potentially leading to disruptions in banking and other financial institutions.
Economic Impact:
Market melt-downs can have broader economic consequences, affecting consumer confidence, business investments, and overall economic stability.
A market melt-up poses risks as it can lead to overvaluation, herding behavior, and sudden corrections. Investors might be drawn into a euphoric buying frenzy, neglecting underlying fundamentals and taking excessive risks.
The danger lies in the potential for significant losses when the market corrects, catching latecomers off guard. Conversely, a market melt-down carries the risk of fast and sharp declines, triggering panic selling and liquidity issues. The rapid deterioration can stress the financial system, impacting not just investors but also having broader economic consequences. Both scenarios require vigilant risk management, strategic decision-making, and adaptability to navigate the inherent dangers associated with extreme market movements.
Using Technical Analysis to Mitigate Risks:
Risk Management:
Set clear risk management strategies, including stop-loss orders and position sizing, to protect against significant losses.
Diversification:
Diversify your portfolio across different asset classes to spread risk and reduce the impact of a severe market event.
Stay Informed:
Regularly monitor technical indicators, trend reversals, and market sentiment to stay informed about potential shifts in market conditions.
Avoid Chasing Trends:
Avoid chasing trends during melt-ups and practice disciplined investing to mitigate the risk of entering the market at unsustainable levels.
Adaptability:
Be adaptable and ready to adjust your investment strategy based on changing technical signals and market dynamics.
While technical analysis can provide valuable insights, it's essential to combine it with a holistic approach to risk management and a thorough understanding of market dynamics to navigate the challenges associated with both melt-ups and melt-downs.
Disclaimer:
The information provided in the technical analysis charts published on this TradingView account is for educational and informational purposes only. It does not constitute financial advice, investment recommendations, or trading strategies.
Trading and investing in financial markets involve risk, and past performance is not indicative of future results. The charts and analysis presented here may not guarantee accuracy or completeness, and users are encouraged to conduct their own research and seek professional advice before making any investment decisions.
The author of these charts is not responsible for any losses, damages, or other liabilities arising from the use of the information presented. Users should be aware of the inherent risks associated with trading and carefully consider their financial situation and risk tolerance before engaging in any trading activities.
By accessing and using the information provided in these charts, users acknowledge and agree to the terms of this disclaimer.

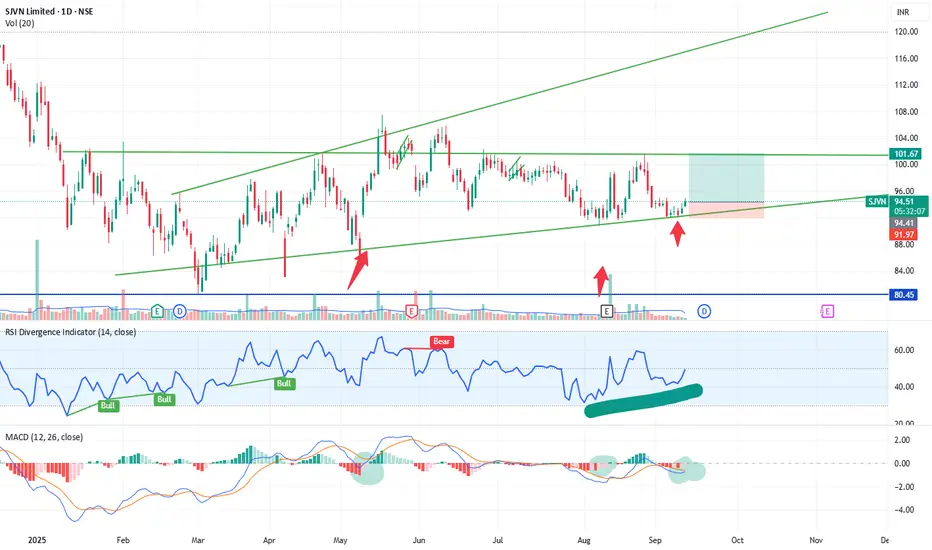
Study & Analysis: Bullish Setup in SJVN (NSE)SJVN Ltd. is showing signs of a potential bullish reversal after taking support at the lower boundary of an ascending channel. The stock has formed a consistent pattern of higher lows and is currently trading at ₹94.55 with increasing volume and positive momentum on key indicators.
✅ Key Technical Highlights:
📈 Chart Pattern:
Trading within a well-defined ascending channel.
Recently bounced off the channel support line (third touch confirmation).
Next resistance zone lies near ₹101.67, which aligns with the upper trendline and horizontal supply zone.
📊 Indicators:
RSI Divergence: Bullish divergence seen — RSI made a higher low while price made a lower low, signaling potential reversal.
MACD Bullish Crossover: MACD line has crossed above the signal line near oversold levels — historically a strong bullish sign.
Volume: Notable volume spike observed at support — indicating accumulation.
📏 Risk-Reward Zone (For Study Purposes Only):
Entry Zone: ₹93–₹95
Target: ₹101–₹102
Stop Loss: Below ₹91.97
⚠️ Note:
This post is purely for educational and analysis purposes only. It is not a recommendation to buy or sell any security. Always do your own research or consult a qualified advisor before making investment decisions.
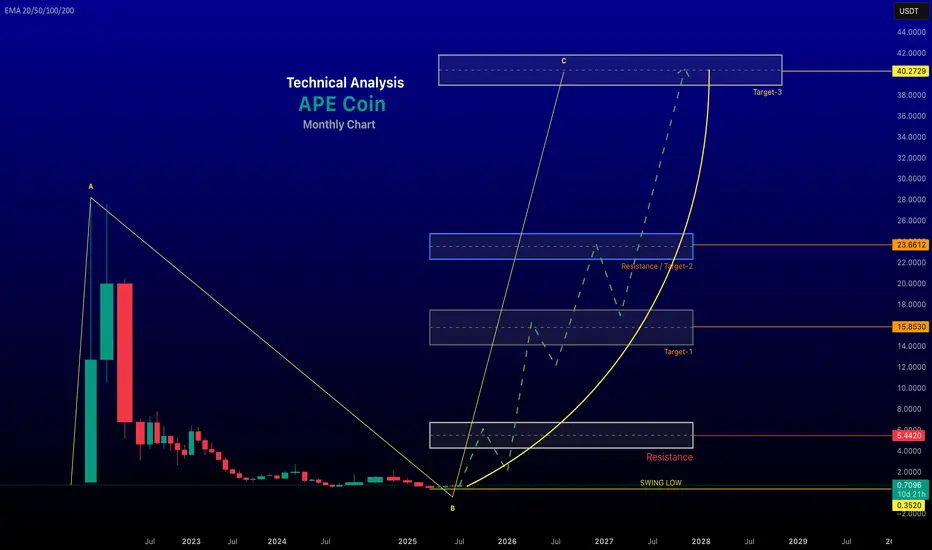
renderwithme || Ape Technical Analysis for 2025ApeCoin (APE) AnalysisApeCoin (APE) is an ERC-20 governance and utility token tied to the Bored Ape Yacht Club (BAYC) ecosystem by Yuga Labs, designed to empower decentralized community building in Web3. Below is a comprehensive analysis of ApeCoin, covering its current market performance, technical indicators, price predictions, and fundamental factors, based on available data.
Historical Price Trends: All-Time High: $27.79 on April 28, 2022, reflecting a -98% decline to current levels.
All-Time Low: $0.349 on April 7, 2025, with the current price up approximately 93.31% from this low.
Recent Performance: Over the past week, APE has risen by 9.17%-37.09%, and over the past month, it has increased by 0.45%-58.16%. However, it has declined by -15.88% to -44.50% over the past year, indicating significant volatility and a bearish long-term trend.
Trading Volume: The 24-hour trading volume is approximately $30.92M-$61.61M, with a 7-day average of $32.61M and a 30-day average of $25.38M. This suggests moderate trading activity, with recent spikes potentially tied to ecosystem developments.
Technical AnalysisCurrent Signals: Short-Term (Daily/4-Hour): Technical indicators show a "Strong Buy" signal on 4-hour and daily charts, suggesting short-term bullish momentum. This is supported by a recent breakout above a key resistance at $0.63 and a potential retest of higher levels like $0.74 or $1.00.
Weekly/Monthly: The weekly chart shows a neutral signal, while the monthly chart indicates a "Sell" trend, reflecting longer-term bearish pressure.
Chart Patterns:A falling wedge pattern has formed on the daily chart, which could signal a bullish reversal if buying pressure increases, potentially pushing APE toward $0.80-$2.00. However, failure to sustain momentum could lead to a drop to $0.22-$0.42.
The price has broken key resistance levels (e.g., $0.63) and trendlines, with some analysts noting a "flag" pattern breakout, indicating potential for further upside if the trend holds.
Key Indicators:Moving Averages: Most moving averages suggest a "Strong Sell" on longer timeframes, indicating bearish momentum over months.
Oscillators: Neutral, with no clear overbought or oversold conditions, suggesting indecision between buyers and sellers.
Fibonacci Levels: APE is currently trading between 0.236 and 0.382 Fibonacci retracement levels, with resistance around $0.60-$1.00.
Sentiment: The Fear & Greed Index for APE stands at 66 (Greed zone), indicating positive investor sentiment, which could signal a buying opportunity for some or a potential sell-off if greed peaks.
Price PredictionsShort-Term (2025):Bearish forecasts suggest APE could drop to $0.22-$0.42 due to consolidation or lack of buying pressure.
Bullish scenarios predict a range of $0.80-$2.00, especially if an altcoin season emerges or ecosystem developments drive demand.
Medium-Term (2026-2027):Bullish predictions estimate APE reaching $2.50-$3.84 in 2026 and potentially higher in 2027 if the crypto market sees broader growth.
Conservative estimates suggest a trading range of $0.41-$0.94, reflecting continued volatility.
Long-Term (2030-2050):Optimistic forecasts project APE reaching $29.55-$40.15 by end of 2026, driven by potential growth in the Web3 and metaverse sectors.
Extremely bullish (but speculative) predictions for 2050 suggest prices as high as $1,050-$1,184, though these are highly uncertain due to the hype-driven nature of APE’s ecosystem.
More conservative outlooks predict modest growth to $0.73-$1.10 by 2030, contingent on sustained ecosystem adoption.
Fundamental AnalysisEcosystem and Use Case:Governance: APE is the governance token for the ApeCoin DAO, allowing holders to vote on fund allocation, partnerships, and ecosystem development. 62% of the token supply is allocated to the Ecosystem Fund to support community-driven initiatives.
Utility: APE serves as a currency for transactions within the ecosystem, providing access to exclusive games, merchandise, events, and services. It also incentivizes third-party developers to integrate APE into Web3 projects, such as Animoca Brands’ Benji Bananas.
ApeChain: The launch of Yuga Labs’ ApeChain Layer-3 platform in October 2024 briefly boosted APE’s price, but the token fell out of the top 100 cryptos by market cap in December 2024, reflecting waning momentum.
Community and Adoption:The BAYC ecosystem, backed by high-profile endorsements (e.g., Justin Bieber, Paris Hilton), remains a key driver of APE’s relevance. However, declining NFT popularity since 2021 has reduced hype, impacting APE’s value.
The ApeCoin DAO’s governance structure, including the APE Foundation and its Board, aims to foster decentralized decision-making but has faced criticism for inefficiencies and lack of community engagement.
Strengths:Strong brand association with BAYC, a leading NFT project.
Fixed supply of 1 billion tokens, preventing inflation.
Integration into Web3 projects like the Otherside metaverse and gaming ecosystems.
Weaknesses:Heavy reliance on NFT hype, which has significantly declined.
Volatility tied to market sentiment and ecosystem developments.
Criticism of the DAO’s treasury spending on “nonsense” projects, raising concerns about governance efficiency.
Opportunities:Growth in Web3 and metaverse adoption could drive demand for APE.
Partnerships with platforms like Animoca Brands and potential new use cases in DeFi or e-commerce.
Threats:Regulatory risks affecting cryptocurrencies and NFTs.
Competition from other governance and utility tokens.
Potential for further price declines if NFT market sentiment remains bearish.
Investment Advice: Always conduct thorough research and consult a financial advisor before investing, as cryptocurrencies carry significant risks.
BIRLANU technical analysisBirlaNu Ltd is listed on the NSE with a current price of INR 2,067.80. The company operates as a diversified conglomerate with interests spanning textiles, cement, financial services, and telecommunications.
Key Levels
Support Level: INR 1853
Swing Level: INR 3494
Possible Upside Levels: INR 5461, INR 6509, INR 7844
Technical Indicators:
RSI (Relative Strength Index): Currently at 39.84, indicating that the stock is approaching oversold territory, which could suggest a potential buying opportunity if the trend reverses.
Volume: The trading volume stands at 120.15K, reflecting significant investor activity. Higher volume often signals stronger market interest and can precede price movements.
Sector and Market Context:
BirlaNu Ltd operates across multiple sectors, including financial services, telecommunications, cement, and textiles, leveraging its diversified presence to mitigate sector-specific risks. The financial services division benefits from India's growing digital adoption, though regulatory changes and interest rate fluctuations remain key considerations. In telecommunications, competitive pricing and 5G expansion drive growth, but high capital expenditure and policy shifts could impact profitability. Meanwhile, cement and textiles are supported by infrastructure demand and strong exports, though global economic conditions and raw material costs influence margins. The broader Indian market has shown resilience despite global volatility, with domestic consumption and policy support acting as stabilizing factors. Given BirlaNu’s exposure across industries, its stock performance is shaped by sector-specific developments, macroeconomic trends, and investor sentiment.
Risk Considerations:
Market Volatility: Fluctuations in the broader market can influence the stock’s price.
Sector-Specific Risks: Regulatory changes, economic downturns, or adverse events in any of the company’s operating sectors may affect performance.
Company-Specific Risks: Operational challenges, management decisions, or financial health concerns within BirlaNu Ltd could impact stock valuation.
Analysis Summary:
BirlaNu Ltd presents potential growth opportunities due to its diversified business model and current technical indicators. The RSI suggests the stock is nearing oversold conditions, which might indicate a reversal. The volume reflects strong investor interest, a positive sign for future price movements. However, investors should remain cautious of market volatility and sector-specific risks. Monitoring key levels and broader market trends will be essential for making informed decisions.

ZINKA LOGISTICS technical analysis**Technical Analysis Report**
**Stock Overview:**
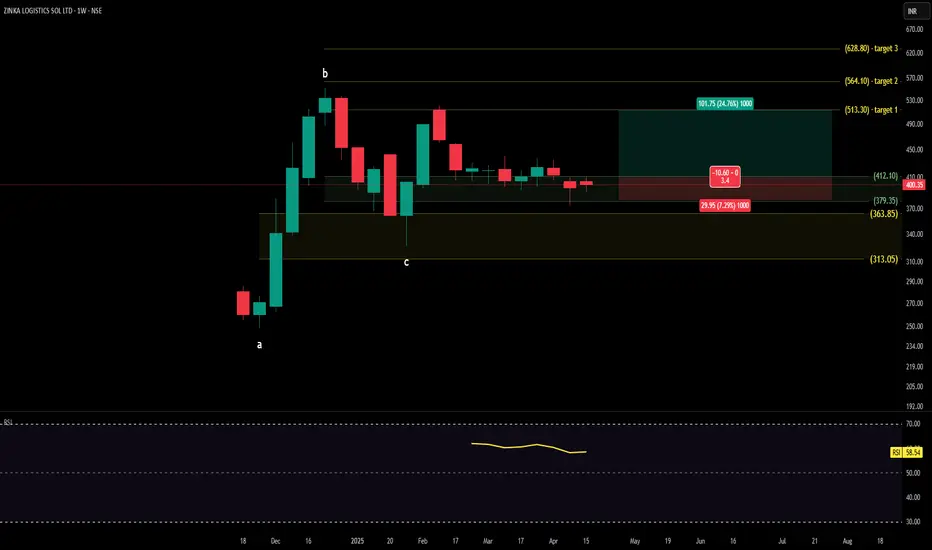
Zinka Logistics Solutions Ltd. (NSE: ZINKA) is currently priced at INR 400.35. The company specializes in logistics and supply chain solutions, offering services such as transportation, warehousing, and distribution.
**Key Levels:**
- Support Level: INR 313.05
- Upside Swing Zone: INR 412.10
- Possible Upside Levels: INR 513.30, INR 564.10, INR 628.80
**Technical Indicators:**
- **RSI (Relative Strength Index):** The RSI is at 58.54, indicating a neutral position where the stock is neither overbought nor oversold. RSI measures the speed and change of price movements, helping identify potential trend reversals.
- **Volume:** The weekly trading volume stands at 380.74K, reflecting moderate activity. Volume is a key indicator of the strength behind price movements, with higher volumes often signaling stronger trends.
**Sector and Market Context:**
Zinka Logistics Solutions Ltd. operates within the logistics and supply chain sector, which has been experiencing growth due to the rise of e-commerce and the increasing need for efficient transportation and distribution services. The sector has shown resilience, supported by technological advancements and streamlined operations. However, broader market trends, including economic fluctuations and consumer demand, play a significant role in shaping the stock's trajectory.
**Risk Considerations:**
- **Market Volatility:** Broader market fluctuations could impact investor sentiment and stock prices.
- **Economic Conditions:** Factors such as inflation, interest rates, and GDP growth may influence the logistics sector's performance.
- **Industry Competition:** The company faces challenges from competitors in maintaining market share and profitability.
- **Regulatory Changes:** Any shifts in transportation or warehousing regulations could affect operational efficiency and financial outcomes.
**Analysis Summary:**
Zinka Logistics Solutions Ltd. demonstrates potential for upward movement based on its key levels and technical indicators. The RSI suggests a stable position, while moderate volume indicates consistent trading interest. The stock's performance aligns with the logistics sector's growth trends, but investors should remain cautious about external risks such as market volatility and regulatory changes. Conducting further research and monitoring sector developments is advisable before making investment decisions.
This analysis provides a comprehensive overview while maintaining a balanced perspective. Let me know if you'd like to refine or expand on any section!
ready for cheers RADICO KHAITANStock Overview:
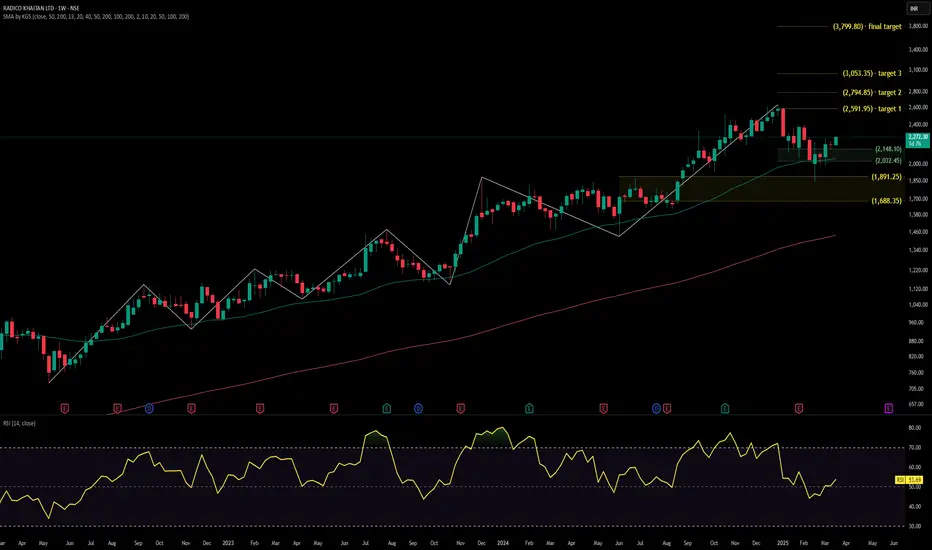
Stock Name: Radico Khaitan Ltd, Exchange: NSE
Company Business Profile: Radico Khaitan Ltd is a leading Indian company specializing in the manufacturing and distribution of alcoholic beverages, including spirits and liquors.
Key Levels:
Support (Yellow Zone): ₹1,688.35 - ₹1,891.25
Swing Zone (Green Zone): ₹2,032.45 - ₹2,148.10
Technical Indicators:
RSI (Relative Strength Index): Currently at 53.69, indicating neutral momentum. RSI values above 70 suggest overbought conditions, while below 30 indicate oversold conditions.
Volume: 410.85K shares traded, reflecting moderate activity. Higher volume often signals increased interest in the stock.
MA (Moving Averages): The stock price is above the 200-day moving average (₹1,437.52), suggesting a long-term uptrend.
Sector and Market Context: Radico Khaitan Ltd operates within the alcoholic beverages sector, which is influenced by regulatory changes, consumer trends, and economic conditions. The sector shows resilience, and the stock's position above its long-term moving average aligns with the broader bullish market sentiment.
Risk Considerations: Potential risks include regulatory changes impacting the alcoholic beverages industry, fluctuations in raw material costs, and shifts in consumer preferences. Broader market conditions, such as economic downturns or geopolitical events, could also affect the stock's performance.
Analysis Summary: Radico Khaitan Ltd demonstrates a strong upward trend, supported by key technical levels and indicators. While the long-term outlook appears positive, investors should remain cautious of potential risks and market conditions. This analysis is for informational purposes only and does not constitute investment advice.
EpackLet's analyze **Epack Polymers Ltd. (EPACK)** from both a **fundamental** and **technical** perspective.
### **Fundamental Analysis of Epack Polymers Ltd. (EPACK)**
#### **Overview of Epack Polymers Ltd.**
- **Sector:** Materials, Plastics
- **Industry:** Packaging, Polymers & Plastic Products
- **Founded:** 2006
- **Headquarters:** Delhi, India
- **Market Cap:** Approx. ₹500-600 crore (as per the latest data)
**Epack Polymers Ltd.** is a company primarily engaged in the **manufacturing of polymer products**, particularly **polyethylene films** and **flexible packaging materials**. The company caters to a variety of industries, including **food packaging, pharmaceuticals, retail, agriculture**, and **consumer goods**. Epack’s product portfolio includes **laminated films, pouches, and rolls** used extensively in the packaging sector.
Key areas of Epack’s operations include:
- **Flexible Packaging:** The company provides a wide range of packaging solutions for food, beverages, and other consumer goods.
- **Custom Packaging Solutions:** Epack manufactures packaging products tailored to specific industry needs, such as pharmaceuticals, dairy, and personal care.
- **Sustainability Focus:** The company is gradually integrating sustainable practices in its operations, including eco-friendly packaging solutions.
#### **Key Financials (Latest Report)**
- **Revenue Growth:** Epack has demonstrated steady revenue growth over the years, driven by the demand for packaging products in India, especially in sectors such as food, pharmaceuticals, and agriculture.
- **Profitability:** The company maintains healthy profit margins in the packaging industry, although it faces some pressure due to fluctuating raw material costs, such as the prices of polyethylene and other polymers.
- **Debt Levels:** Epack’s debt levels are generally moderate, with manageable leverage in relation to its earnings and cash flows. The company focuses on maintaining operational efficiency.
- **Cash Flow & Dividend Yield:** The company has been able to generate strong operational cash flows, which it reinvests into expanding production capacity and improving infrastructure.
#### **Valuation Ratios**
- **P/E Ratio:** Epack’s price-to-earnings (P/E) ratio may be on the higher side, reflecting growth expectations in the packaging sector. However, it’s important to compare this ratio with other companies in the packaging industry to determine if it’s overvalued or fairly priced.
- **P/B Ratio:** The P/B ratio is relatively moderate, indicating that the stock is reasonably priced in terms of book value, although it can vary depending on market sentiment.
- **Dividend Yield:** Epack is focused on growth, and while it does not have a high dividend yield, it is investing its earnings into capacity expansion and infrastructure.
#### **Industry & Macro Trends**
- **Packaging Demand:** The packaging industry in India is expected to grow rapidly, driven by increasing consumer demand in retail, food & beverages, and pharmaceutical sectors. Epack is well-positioned to capture this growth due to its diverse product offerings.
- **Sustainability Trends:** With the rising global focus on environmental sustainability, companies in the packaging industry, including Epack, are transitioning toward more eco-friendly packaging solutions. This could present both challenges and opportunities as the industry evolves.
- **Regulations:** The Indian government’s focus on packaging waste and regulations around plastic usage may impact the company’s operations. However, as the company adapts to environmental concerns by shifting toward sustainable solutions, it may continue to tap into the growing demand for green products.
- **Raw Material Prices:** The prices of polymers, including polyethylene, are volatile and can impact margins. Any fluctuations in crude oil prices can affect raw material costs, which would impact profitability.
---
### **Technical Analysis of Epack Polymers Ltd. (EPACK)**
Now, let's look at the **technical outlook** for Epack Polymers Ltd. (EPACK), analyzing key support and resistance levels, moving averages, and momentum indicators.
#### **Price Action:**
- **Current Price:** Epack has shown a positive price trend in recent times, benefiting from increased demand in the packaging sector, especially in the food and pharmaceutical segments.
#### **Key Levels:**
- **Support Levels:**
- **₹170-₹175:** This level has acted as a key support area for Epack in the past. A pullback toward this range could present a potential buying opportunity if the stock shows signs of stabilization.
- **₹160:** This is another key support level, which could act as a fallback in case of a more significant correction.
- **Resistance Levels:**
- **₹200-₹210:** The stock has faced resistance near this level in recent trading. A break above this resistance with strong volume could signal a potential upward trend.
- **₹220:** This level marks a strong resistance and psychological barrier for the stock, above which there could be further bullish momentum.
#### **Moving Averages:**
- **50-Day Moving Average (50-MA):** If Epack is trading above its 50-day moving average, this indicates short-term bullish momentum. A cross below this moving average could suggest weakening trend and bearish sentiment.
- **200-Day Moving Average (200-MA):** The 200-day moving average is a critical indicator for long-term trends. A stock trading above the 200-day MA signals that the broader trend is bullish. However, if it starts trading below this level, it may indicate a shift in trend.
#### **Momentum Indicators:**
- **RSI (Relative Strength Index):**
- If RSI is above 70, the stock may be in an overbought territory, signaling a potential pullback.
- If RSI is below 30, it indicates the stock might be oversold, suggesting that a reversal could be coming.
- **MACD (Moving Average Convergence Divergence):**
- A **bullish MACD crossover** (when the MACD line crosses above the signal line) could signal strong buying momentum.
- A **bearish MACD crossover** (when the MACD line crosses below the signal line) would indicate weakening momentum, signaling potential downside risk.
#### **Volume Analysis:**
- **Volume Trends:** Increasing volume alongside upward price movements generally confirms the strength of the trend. If the stock faces resistance with high volume, it suggests that the selling pressure may overcome the buying pressure.
- **Volume Spikes:** Pay attention to volume spikes near key resistance levels like ₹200-₹210 or ₹220, as these could indicate either strong buying momentum or the beginning of a trend reversal.
---
### **Conclusion:**
- **Fundamental Strengths:**
- **Epack Polymers Ltd.** has a strong position in the **flexible packaging** industry, benefiting from consistent demand in food, pharmaceuticals, and consumer goods sectors.
- The company has demonstrated steady revenue growth and maintains strong profitability, with a focus on reinvesting in growth and capacity expansion.
- While the packaging sector faces challenges related to raw material price fluctuations and sustainability trends, Epack is adapting to these changes by incorporating eco-friendly packaging solutions.
- **Technical Outlook:**
- **Support levels:** ₹170-₹175 (primary), ₹160 (secondary).
- **Resistance levels:** ₹200-₹210 (primary), ₹220 (psychological resistance).
- The stock is likely to continue benefiting from demand in the packaging sector, and a breakout above resistance levels could signal a further bullish trend.
#### **Risks to Consider:**
- **Raw Material Price Fluctuations:** The cost of polyethylene and other polymers is volatile, and sudden increases could squeeze margins.
- **Regulatory Risks:** Changes in government policies regarding packaging, plastic use, and environmental regulations could impact Epack’s operations and product offerings.
- **Market Competition:** The packaging industry is highly competitive, with several established players vying for market share. Epack must continue innovating and adapting to industry trends to maintain its growth trajectory.
---
**Disclaimer:**
The information provided is for educational purposes only and should not be construed as financial or investment advice. I am not a SEBI-registered advisor, and this analysis is not a recommendation to buy, sell, or hold any securities. Accuracy and timeliness of the data cannot be guaranteed. Always conduct your own research or consult with a professional before making investment decisions. I do not take responsibility for any losses incurred.

NationAlumLet's analyze **National Aluminium Company Ltd. (NALCO)** from both a **fundamental** and **technical** perspective.
### **Fundamental Analysis of National Aluminium Company Ltd. (NALCO)**
#### **Overview of National Aluminium Company Ltd. (NALCO)**
- **Sector:** Metals
- **Industry:** Aluminium and Metal Products
- **Founded:** 1981
- **Headquarters:** Bhubaneswar, Odisha, India
- **Market Cap:** Approx. ₹25,000 crore (as per the latest data)
**National Aluminium Company Ltd. (NALCO)** is one of the largest integrated aluminium producers in India. The company operates in the production of **bauxite, alumina**, and **aluminium** products. NALCO is a Government of India Enterprise, and it is one of the top players in the aluminium industry in India, with a well-established production capacity.
NALCO's operations span:
- **Bauxite Mining:** The company has one of the largest bauxite reserves in the world.
- **Alumina Refining:** NALCO operates one of the largest alumina refineries in the country.
- **Aluminium Production:** It manufactures primary aluminium and downstream products, such as billets, wire rods, and rolled products.
#### **Key Financials (Latest Report)**
- **Revenue Growth:** NALCO has demonstrated consistent revenue growth over the years, supported by increasing demand for aluminium across various sectors, including automotive, infrastructure, and construction.
- **Profitability:** NALCO’s profit margins are relatively healthy, benefiting from its integrated operations (from mining to aluminium production). However, the company’s margins can fluctuate based on global aluminium prices and raw material costs.
- **Debt Levels:** NALCO has historically maintained low to moderate levels of debt, which provides it financial stability. The company has strong cash flows to support its operations and debt servicing.
- **Cash Flow & Dividend Yield:** The company generates healthy operational cash flows and has a strong dividend track record. The government ownership aspect means the company is committed to maintaining a regular dividend payout.
#### **Valuation Ratios**
- **P/E Ratio:** NALCO’s P/E ratio is generally in line with the metals sector, reflecting its stable earnings and government backing. Being a public sector enterprise, its valuation tends to be slightly lower compared to privately held counterparts.
- **P/B Ratio:** The P/B ratio of NALCO is moderate, reflecting its robust balance sheet, driven by a solid asset base in bauxite reserves and aluminium production.
- **Dividend Yield:** NALCO is known for its strong dividend payouts, with the dividend yield being attractive to investors seeking steady income alongside capital appreciation.
#### **Industry & Macro Trends**
- **Aluminium Demand:** The demand for aluminium is driven by sectors like automotive, construction, packaging, and electrical industries. With rising global demand for lightweight materials and sustainable products, NALCO stands to benefit from growth in these sectors.
- **Commodity Prices:** The prices of aluminium and bauxite can fluctuate based on global supply-demand dynamics, and NALCO’s margins are sensitive to commodity price movements. Any significant drop in aluminium prices may affect profitability in the short term.
- **Government Policies:** NALCO, being a state-owned enterprise, is subject to Indian government policies related to subsidies, regulations, and pricing controls. Government initiatives to boost the domestic manufacturing of aluminium products could support demand.
- **Global Competition:** NALCO competes with other large aluminium producers like **Hindalco Industries**, **Vedanta Limited**, and global players like **China’s Chalco**. The competition also includes regional producers of bauxite and alumina.
---
### **Technical Analysis of National Aluminium Company Ltd. (NALCO)**
Let's look at the **technical outlook** of NALCO, focusing on key support and resistance levels, moving averages, and momentum indicators.
#### **Price Action:**
- **Current Price:** NALCO’s stock tends to follow global trends in aluminium and metal prices. It has shown long-term uptrends during periods of rising commodity prices and pullbacks during market corrections.
#### **Key Levels:**
- **Support Levels:**
- **₹75-₹80:** This level has served as a strong support zone for NALCO in the past. A pullback towards this range could present a potential buying opportunity if the stock shows signs of stabilizing.
- **₹70:** This is a secondary support level in case of a more significant correction in the stock.
- **Resistance Levels:**
- **₹90-₹95:** This is a significant resistance zone. If NALCO breaks above this level with strong volume, it could signal a potential uptrend and more upside.
- **₹100:** This is a psychological resistance level, and a breakout above ₹100 could signal a potential rally.
#### **Moving Averages:**
- **50-Day Moving Average (50-MA):** If the stock is trading above the 50-day moving average, it indicates a short-term uptrend. A break below this level could suggest short-term bearishness.
- **200-Day Moving Average (200-MA):** The 200-day moving average is a key indicator of the long-term trend. NALCO is considered in a bullish phase if trading above the 200-MA, but below it could indicate a long-term downtrend.
#### **Momentum Indicators:**
- **RSI (Relative Strength Index):**
- An RSI above 70 indicates that NALCO may be overbought, and a pullback could be imminent.
- An RSI below 30 suggests that the stock may be oversold and could be due for a potential reversal or recovery.
- **MACD (Moving Average Convergence Divergence):**
- A positive MACD crossover (MACD line crossing above the signal line) would indicate bullish momentum.
- A negative MACD crossover would suggest a weakening trend or potential bearishness.
#### **Volume Analysis:**
- **Volume Trends:** Rising volume accompanying price increases can confirm the strength of an uptrend, while increasing volume during price declines could indicate strong selling interest.
- **Volume Spikes:** Watch for volume spikes near key levels such as ₹90-₹95 or ₹100. A breakout or breakdown accompanied by high volume often signifies the beginning of a new trend.
---
### **Conclusion:**
- **Fundamental Strengths:**
- NALCO has strong fundamentals with a focus on integrated aluminium production, a solid balance sheet, and a consistent record of profitability.
- As a state-owned entity, it enjoys stability and government backing but may face limitations in terms of strategic flexibility.
- The company benefits from strong demand in the aluminium sector, supported by growth in infrastructure, automotive, and electrical industries.
- **Technical Outlook:**
- **Support levels:** ₹75-₹80 (primary), ₹70 (secondary).
- **Resistance levels:** ₹90-₹95 (primary), ₹100 (psychological resistance).
- NALCO's stock is likely to follow the broader trends in the metals sector. A breakout above resistance levels can signal an upward trend, while a break below support levels may signal a deeper correction.
#### **Risks to Consider:**
- **Commodity Price Fluctuations:** NALCO’s margins are highly dependent on aluminium and bauxite prices, and any significant price volatility could impact profitability.
- **Regulatory Risks:** Changes in government policies related to aluminium pricing or subsidies could influence the company's earnings and cash flows.
- **Global Competition:** NALCO faces competition from other domestic and international aluminium producers, which may affect market share and pricing power.
---
**Disclaimer:**
The information provided is for educational purposes only and should not be construed as financial or investment advice. I am not a SEBI-registered advisor, and this analysis is not a recommendation to buy, sell, or hold any securities. Accuracy and timeliness of the data cannot be guaranteed. Always conduct your own research or consult with a professional before making investment decisions. I do not take responsibility for any losses incurred.

Garware Hi-Tech Films Ltd.Let's dive into the analysis of **Garware Hi-Tech Films Ltd.** (GHFL).
### **Fundamental Analysis**
#### **Overview of Garware Hi-Tech Films Ltd.**
- **Sector:** Materials
- **Industry:** Specialty Chemicals/Films Manufacturing
- **Market Cap:** Approx. ₹7,000 crore (as of the latest data)
- **Headquarters:** Mumbai, India
Garware Hi-Tech Films is a leading manufacturer of polyester films in India and offers a wide range of products, including films for packaging, electrical insulation, and solar applications. The company primarily focuses on the production of high-performance films.
#### **Key Financials (Latest Report)**
- **Revenue Growth:** The company has shown consistent growth in its revenue streams over the last few years, driven by strong demand in sectors like packaging, automotive, and solar energy.
- **Profitability:** Garware Hi-Tech Films typically reports solid operating margins, benefitting from its strong product offerings and technical expertise in high-value applications.
- **Debt Levels:** The company is in a relatively low-debt position, which is beneficial for its financial health, reducing the risk associated with interest rate fluctuations.
- **Dividends:** Garware Hi-Tech Films has a track record of paying consistent dividends, which may be appealing to income-focused investors.
#### **Valuation Ratios**
- **P/E Ratio:** As a growth stock in a niche industry, Garware might exhibit a higher P/E ratio compared to broader market averages, reflecting its growth potential.
- **P/B Ratio:** A measure of how the market values the company’s net assets.
- **Dividend Yield:** Historically, Garware offers moderate dividends, making it attractive for long-term investors who value both growth and income.
#### **Industry & Macro Trends**
- **Packaging & Film Industry:** The demand for specialty films in packaging, automotive, and solar applications is expected to grow as industries continue to innovate. Garware is well-positioned in this growth area.
- **Solar Energy Demand:** One of the key growth drivers for Garware is the increasing demand for solar energy and the growing need for specialized films in solar panel applications.
- **Global Expansion:** Garware's ability to capture markets outside of India, especially in the developed economies, is critical to its future growth prospects.
---
### **Technical Analysis**
Let’s explore the stock’s technical position, analyzing price action, key levels, and momentum indicators.
#### **Price Action**
- **Current Price:** (Exact price will depend on real-time data)
- **Chart Patterns:** Check for any ongoing chart patterns such as triangles, rectangles, or head and shoulders. Given the sector's growth outlook, the stock might be showing bullish patterns over the medium term.
#### **Key Levels:**
- **Support Levels:**
- **₹760-₹780:** The stock has previously shown support around this zone. A price retracement towards this area might be a good entry point.
- **₹700-₹720:** If the stock breaks below ₹780, the next support zone lies here, where buyers might step in.
- **Resistance Levels:**
- **₹860-₹880:** This level has been a strong resistance zone for the stock in the past. Breaking above this could signal continued upward movement.
- **₹900-₹920:** A major psychological resistance level. If the stock crosses this barrier, it could set the stage for further bullish momentum.
#### **Moving Averages:**
- **50-Day Moving Average (50-MA):** Watch whether the stock is trading above or below its 50-day MA. If it’s trading above, this indicates a positive short-term trend.
- **200-Day Moving Average (200-MA):** A key indicator of the long-term trend. If the stock is trading above the 200-day MA, it shows a strong long-term uptrend.
#### **Momentum Indicators:**
- **RSI (Relative Strength Index):** RSI values between 70-80 indicate the stock could be in overbought territory, while below 30 suggests it might be oversold.
- **Current RSI:** A higher RSI above 70 might indicate overbought conditions, while an RSI below 30 would indicate potential opportunities for buying in the case of a correction.
- **MACD (Moving Average Convergence Divergence):**
- If the MACD line is above the signal line, it suggests bullish momentum. Conversely, if the MACD crosses below the signal line, it may indicate weakening momentum.
#### **Volume Analysis:**
- **Volume Trends:** Consistent increasing volume during an uptrend is a sign of strength in the current price movement. If volume picks up during a price decline, it might indicate more selling pressure.
- **Volume Spikes:** A sudden increase in volume can signal a potential breakout or breakdown, so watch for this closely when the price approaches key resistance or support levels.
#### **Recent Price Action and Trend:**
- **Uptrend/Downtrend:** Evaluate if Garware is in an uptrend or consolidating sideways. Generally, the stock’s performance in recent months would provide clues to whether it’s positioned for a breakout.
- **Breakouts/Breakdowns:** Watch for any significant breakouts above resistance or breakdowns below support levels. A breakout above ₹880 might indicate a bullish continuation.
---
### **Conclusion:**
- **Fundamental Strengths:**
- Garware Hi-Tech Films is a strong player in the high-performance films industry, benefitting from its niche offerings, and it's poised for growth in packaging, automotive, and solar sectors.
- The company is financially sound, with low debt and a stable track record of profitability.
- **Technical Outlook:**
- The stock is currently trading in a range, with key support levels at ₹760-₹780 and resistance at ₹860-₹880.
- A breakout above ₹880 could signify the start of a strong uptrend, while a fall below ₹760 might trigger a bearish signal.
- RSI and MACD should be monitored to assess short-term momentum, and volume trends will help confirm the strength of any movement.
---
This analysis offers a balanced view based on the available technical and fundamental data. To ensure your investment decisions align with market conditions, it’s important to monitor real-time data and market sentiment.
Disclaimer:
The information provided is for educational purposes only and should not be construed as financial or investment advice. I am not a SEBI-registered advisor, and this analysis is not a recommendation to buy, sell, or hold any securities. Accuracy and timeliness of the data cannot be guaranteed. Always conduct your own research or consult with a professional before making investment decisions. I do not take responsibility for any losses incurred.

Exicom Tele-SystemsDouble-Bottom Breakout with Bullish TechnicalExicom Tele-Systems Ltd. is showing strong technical signs of an upward movement, supported by both chart patterns and technical indicators. Here’s a detailed breakdown of the analysis:
Current Market Price (CMP): ₹356.30 (as of 6 Nov 2024).
Chart Pattern:
The stock recently confirmed a double-bottom breakout on the daily timeframe, a classic bullish reversal pattern. This breakout indicates potential upward momentum as buyers continue to accumulate near support levels.
Technical Indicators:
RSI Bullish Divergence: A positive RSI divergence on the daily timeframe suggests strengthening momentum as the RSI has turned upwards, signaling increased buying interest.
Moving Averages: The stock has closed above three key moving averages, adding further confirmation of bullish sentiment.
Shareholding Insights:
Promoter holding remains strong at 69.6%, while institutional holdings have decreased to 7.43%, as both FII and DII reduced their positions. This may indicate some caution among institutional investors but is balanced by steady promoter confidence.
News and Catalysts:
The Board of Directors will review and potentially approve the unaudited financial results for Q2 and the half-year on 13 November 2024. This upcoming announcement could serve as a key catalyst, either strengthening the current uptrend or bringing volatility.
Financial Health:
Exicom has shown a positive trend in net profit, adding support to the potential for continued growth in value.
Expected Price Movement and Targets:
Primary Resistance Target: ₹389
Secondary Target: ₹425
Timeframe: Estimated at 1-3 months based on the daily timeframe analysis.
Summary:
Exicom Tele-Systems Ltd. exhibits a bullish technical setup, with a confirmed double-bottom breakout, favorable RSI divergence, and strong moving average support. With upcoming financial announcements as a potential catalyst, the stock appears poised to test the ₹389 resistance level, with further potential to reach ₹425 over the next 1-3 months.
Disclaimer:
This analysis is for educational purposes only. Please conduct your own research or consult a financial advisor before making any investment decisions.

MOIL Ltd. (LONG SETUP)NSE:MOIL
Company Overview: MOIL Ltd
MOIL Ltd ( Manganese Ore India Limited) is a leading producer of manganese ore in India, playing a crucial role in the country's steel industry. The company has a strong market presence and operates several mines across India. MOIL's manganese ore is vital for producing ferroalloys, which are key inputs in steel production.
PE Ratio: MOIL Ltd currently has a price-to-earnings (PE) ratio of 23, which indicates that the stock is reasonably valued compared to its earnings. This ratio suggests that investors are willing to pay 23 times the company's earnings per share, which is aligned with industry averages.
Technical Analysis:
Uptrend and 200-DMA Support:
MOIL Ltd is in a strong uptrend, supported by several key technical indicators:
200-Day Moving Average (DMA) Support: The stock has consistently found support at the 200-day moving average, a crucial long-term trend indicator, which suggests that the underlying trend is bullish.
RSI in Oversold Zone: The Relative Strength Index (RSI) is currently in the oversold zone, indicating that the stock may be undervalued in the short term and could be poised for a rebound.
Investment Idea:
Buy Setup:
Entry: Consider buying in the 420-425 range. This price range provides a good entry point, especially given the support from the 200-DMA and the oversold condition on the RSI.
Stop Loss: Place a stop loss below 370 to protect against potential downside risks. This stop loss level ensures that losses are minimized if the stock breaks below key support levels.
Targets: Set multiple targets to capitalize on potential gains:
First Target: 480
Second Target: 550
Third Target: 620
Conclusion:
MOIL Ltd offers a solid investment opportunity with a combination of fundamental strength and favorable technical indicators. The stock's support from the 200-DMA and the RSI in the oversold zone suggest a potential rebound. Buying in the 420-425 range with targets at 480, 550, and 620, and a stop loss below 370, provides a balanced approach to risk and reward. Consider your risk tolerance and market conditions before making any investment decisions.
Thanks & Happy Trading
S_Rawat
Disclaimer:
This idea is shared for educational purposes and should not be interpreted as financial advice. Please conduct your own research and consider your individual financial circumstances before engaging in any trading activity.

Multiyear breakout Stock🔍 Technical Analysis: India Cement stock has recently broken out from a multiyear resistance level with substantial volume. This bullish signal could indicate a strong uptrend. Here's a breakdown of the key technical indicators:
Resistance Level: The stock has breached a significant resistance level, indicating a potential new phase of growth.
Volume: The breakout is accompanied by huge trading volume, which supports the sustainability of the move.
Moving Averages: Look at the 50-day and 200-day moving averages for additional confirmation. A crossover or convergence can reinforce the bullish outlook.
RSI/MACD: Check the Relative Strength Index (RSI) and Moving Average Convergence Divergence (MACD) for momentum and trend strength. An RSI above 70 or MACD crossover might indicate overbought conditions or a strong trend.
📊 Fundamental Analysis: Let's dive into the fundamental aspects that support this technical breakout:
Financial Health:
Revenue Growth: Examine the revenue growth over the past few years. Consistent growth is a positive indicator.
Profit Margins: Evaluate the profit margins. Strong margins indicate efficient operations and cost management.
Debt Levels: Analyze the debt-to-equity ratio. A lower ratio suggests a more stable financial structure.
Market Position:
Market Share: India's cement industry is competitive. Assess India Cement’s market share and its position relative to competitors.
Capacity Utilization: Check the company’s capacity utilization rates. Higher rates suggest better demand and operational efficiency.
Economic and Industry Factors:
Infrastructure Projects: Growth in infrastructure projects in India can drive cement demand. Look into any major projects that could benefit the company.
Raw Material Costs: Fluctuations in raw material prices can impact margins. Ensure the company has strategies to manage these costs.
Management and Strategy:
Leadership: Review the track record of the company’s leadership and their strategic vision for growth.
Expansion Plans: Consider any announced expansion plans or new market ventures.
**🔮 Outlook and Risks:
Growth Potential: If the technical breakout is sustained, the stock may continue to perform well. Keep an eye on ongoing developments and market conditions.
Risks: Be aware of potential risks such as economic downturns, regulatory changes, or significant increases in raw material costs.
**📈 Chart Analysis: (Include a clear and detailed chart of India Cement stock here, highlighting the breakout point, volume spike, and any other relevant technical indicators.)

MOLDTE'CH: Short term bullish trend reversal ahead of earnings r📊 NSE:MOLDTECH Technical Analysis - February 2, 2024 🏭
Company Overview: 🔍
Mould Tech Technologies specializes in providing comprehensive engineering solutions, including structural engineering, mechanical engineering, and IT services. The company's expertise in delivering high-quality services positions it as a key player in the engineering sector.
Recent Market Performance: 📈
On the last trading day, February 2, 2024, Mould Tech experienced a significant price jump of approximately 2.8%, closing at 277.00. This move has brought the stock close to the 0.382 Fibonacci level, a critical point indicating potential upward momentum.
Technical Indicators: 🛠
Fibonacci Levels: The stock is nearing the 0.382 level, hinting at a bullish momentum.
Moving Averages: Crossed over the 50-day moving average from bottom to top, currently at 272.46, while the 200-day moving average stands at 300.96. This crossover suggests a potential short bull run.
Parabolic SAR: Issued a buy signal on February 2, 2024, indicating the start of a bullish phase.
MACD: Showcases a buying crossover, with MACD at -1.02 and the signal at -1.45, supporting the buying trend.
RSI: Trending upwards in the mid-range, indicating a positive buying wave with a K value of 68.52 and a D value of 58.37.
%R: Positioned in the mid-price band but trending upwards, suggesting growing strength.
Fisher Transform: At a value of 0.70 with a trigger at 0.18, indicating a trend but still in the middle of the band.
Market Outlook & Strategy: 🌟
With the broader market's support, Mould Tech is poised for an uptick, with a first target set at 287.00 (0.618 Fibonacci level) and a second target at 294.05 (0.00 Fibonacci level) . An aggressive stop-loss strategy is recommended at around 261.15, considering the stock's potential volatility ahead of its earnings report on February 9, 2024.
Entry & Exit Points: 🎯
Entry Point: Positive opening on February 5, 2024, may signal a buying opportunity, especially if EMA and MA crossovers occur.
Target 1: 287.00. 🎯
Target 2: 294.05. 🎯
Stop Loss: 261.15, to protect against unexpected downturns.
Considerations: ⚠️
Investors should monitor the stock's performance closely, especially with the upcoming earnings report. The stock's past volatility requires a cautious approach, despite the bullish indicators.
Disclaimer: ⚠️
This analysis is for informational purposes only and not financial advice. Market conditions are subject to change, and investors should conduct their own research or consult a financial advisor.
#MouldTech #TechnicalAnalysis #EngineeringSolutions #StockMarket #Investing #TradingView #BullishTrends #FibonacciLevels #EMA #MACD #RSI ✨

HINDOILEXP: opportunity for steep rise.🔍 Technical Analysis Update for NSE:HINDOILEXP - Week Starting January 23, 2024
📊 Current Status: The stock closed at a high of ₹186.85 on the last trading day. It has been range-bound since August 2023 but recently breached a six-month high before closing just below it.
📈 Entry Point: Consider entering the trade if the price crosses and sustains above ₹189.80 in the next day or two. This could signal the start of a bullish trend.
🎯 Target: The first target is set at ₹196.40.
🛑 Stop Loss: A key stop loss point is at ₹172.85, aligning with a critical Fibonacci level of 0.5 at ₹172.75. This acts as a strong support level.
💹 Key Indicators:
Volume: Increasing volume supports the potential bullish trend.
Percentage R: Positioned at the upper band, indicating bullishness.
Stochastic RSI: A buying crossover has occurred in an oversold situation, further supporting bullish prospects.
🚦 Overall Outlook: The stock is showing signs of breaking out of its long-term range with increasing volume and positive technical indicators. Monitoring the stock's ability to maintain above ₹189.80 will be crucial for confirming the bullish trend.
⚠️ Disclaimer: This analysis is for informational purposes only and is not financial advice. Investors should conduct their own research and consult a financial advisor before making any investment decisions .
🔖 #HindustanOilExploration #StockAnalysis #BullishTrends #TradingStrategy #StockMarket #InvestmentTips
🌟 Stay informed and trade wisely! 🌟

Indian Bank Stock Analysis: Spordiac Buy Signal on short term📈 NSE:INDIANB - January 5, 2024, 12:52 PM
Current Trading Price: ₹435.10 🏷️
Opening & Key Levels:
Today's Opening: ₹432.40 (Above 0.618 Fibonacci Level) ✅
Near 50-Day Moving Average: Indicating Bullish Trend 📊
Technical Indicators:
EMA & MA: No crossover yet 🔄
MACD: Histogram at 0.48, MACD at 0.70, Signal at 0.22 (Positive Crossover) 📈
RSI: Currently at mid-range, K at 55.02, D at 37.62 (Viable Range) 🎯
%R: At -29.83 (Supportive of Bullish Trend) ⬆️
Fisher Indicator: Positive crossover, Fisher at 0.80, Trigger at 0.27 (Mid-Range) ✨
Parabolic SAR: Buy signal at ₹391.00 🟢
Target Prices & Stop Loss:
Target 1: ₹443.65 (0.786 Fibonacci Level) 🎯
Target 2: ₹458.00 (Level 1 of February Series) 🎯
Stop Loss: If falls below ₹424.50 (0.5 Fibonacci Level) ⛔️
Overall Outlook: Bullish in the short term, but confirmation needed from other indicators. Volatility noted. Investors are advised to monitor closely.
Disclaimer: This analysis is for informational purposes only and should not be construed as investment advice. Investment decisions should be based on individual research and risk appetite. 🚫
#IndianBank #StockAnalysis #TechnicalAnalysis #Investing #StockMarket #BullishTrend #TradingTargets #RiskManagement

NIFTY FOR UPCOMING WEEK 16 AUG TO 19 AUG 22.Hello everyone this chart technically measured and filtered by team INFINITYIV..
WHERE CAPITAL ON RISK, CHART SHOULD BE MORE ACCURATE, RELIABLE AND EASILY ACCESSIBLE.
Request if chart helps you then hit like button your one milliseconds effort makes us HAPPY.
TO CHECK OUR ACCURACY MATCH LEVEL AFTER EXPIRY OR GO THROUGH WITH REST UPLOADED CHART.
LEVELS FOR WEEK:-
RESISTANCE*:-
⬆️17795
⬆️18090
⬆️18615
SUPPORTS*:-
⬇️17644
⬇️17489
⬇️17089
(There is chance to level mismatch by 0.01% of NIFTY)
KEY STRENGTH:-
1. World market closed positive.
2. SGX nifty closed positive.
3. Crypto currency’s positive.
4. Commodity negative.
5. Falling prices of gold.
6. Heavy weight stock positive.
7. VIX Falling.
KEY WEAKNESS:-
1. PCR.
2. Sentiment negative.
3. RSI on day TF over brought zone.
4. falling crude oil prices.
5. Rising USD.
6. Less trading days.
CHART PATTERN AND INDICATORS:-
1. Bearish bat pattern seen on xABCD.
2. Bullish on VI indicators.
HOW TO TRADE WITH CHART:-
1. Let break any side level mentioned on chart.
2. Let close 2, 15 minutes candle above or below.
3. Good to go for next level.
4. Some time profit will less but it will be profitable.
5. FOR OUR VIEW PLEASE PING US @INFINITYIV.
NOTE:-
1. We are not SEBI registered but our chart accuracy can be trusted.
2. If you agreed to go with please consult SEBI registered advisor b4 any position.
3. To appreciate our efforts please like and share, you can save some one hard earned money.
GREETINGS:-
Happy independent day.
Happy trading and have profitable week.

Comprehensive Analysis of Reliance Power Limited (RPOWER)Overview:
Reliance Power Limited (RPOWER) has recently exhibited significant price action, forming a cup and handle chart pattern, which typically signifies a substantial bullish trend. Coupled with strong volume and positive indicators across multiple timeframes, the stock presents a compelling opportunity for investors.
Cup and Handle Pattern:
The cup and handle pattern on RPOWER's chart has matured over a span of more than 5 years, indicating a long-term bullish setup.
A breakout from this pattern occurred recently, accompanied by substantial trading volumes, signaling strong buying interest.
Elliott Wave Analysis:
Elliott wave analysis suggests that the stock is potentially entering the 3rd wave of the 3rd wave, implying a powerful bullish move.
This wave analysis further supports the bullish bias observed in the cup and handle pattern.
Technical Indicators:
Volume Confirmation: The retracement following the breakout maintained higher lows, with the cumulative volume of 10 candles lower than that of the breakout candle, indicating sustained buying pressure.
Bollinger Bands: RPOWER is challenging the upper Bollinger Band on both daily and weekly timeframes, suggesting strong upward momentum.
Trend Indicators: Positive crossovers on trend indicators across multiple timeframes signal a bullish trend.
RSI and ADX: RSI supports the bullish bias, and ADX indicates increasing strength in the uptrend, with +DI confirming a bullish trend.
Trade Strategy:
Entry Points: Consider initiating long positions at current levels or on pullbacks, with potential entry points around the upper bands of the cup and handle pattern.
Invalidation Level: Set the invalidation level below the last swing low, providing a clear risk management strategy.
Price Targets: Upside price targets based on the cup and handle pattern suggest levels of 49+, 73+, and 99+ for Long Terms.
Risk Management: Emphasize the importance of risk management techniques, including stop-loss orders and position sizing, to mitigate potential losses.
Conclusion:
Reliance Power Limited (RPOWER) exhibits a strong bullish setup, characterized by the cup and handle pattern, supported by volume analysis, Elliott wave analysis, and positive technical indicators across multiple timeframes. However, investors should conduct their own research and exercise caution, adhering to risk management principles. This analysis is for educational purposes only and does not constitute financial advice or trading recommendations.
Disclaimer: This study is shared for educational purposes only and should not be construed as investment advice or trading tips. Investors should perform their own analysis and consult with financial professionals before making investment decisions.
I am not sebi registered analyst. My studies are for educational purpose only. Please Consult your financial advisor before trading or investing. I am not responsible for any kinds of your profits and your losses.
Most investors treat trading as a hobby because they have a full-time job doing something else.
However, If you treat trading like a business, it will pay you like a business.
If you treat like a hobby, hobbies don't pay, they cost you...!
Hope this post is helpful to community
Thanks
RK💕
Disclaimer and Risk Warning.
The analysis and discussion provided on in.tradingview.com is intended for educational purposes only and should not be relied upon for trading decisions. RK_Charts is not an investment adviser and the information provided here should not be taken as professional investment advice. Before buying or selling any investments, securities, or precious metals, it is recommended that you conduct your own due diligence. RK_Charts does not share in your profits and will not take responsibility for any losses you may incur. So Please Consult your financial advisor before trading or investing.

POLYCAB 1 Week View📈 Weekly Technical Outlook
Over the past week, Polycab's stock has demonstrated a strong bullish trend, supported by several key technical indicators:
Technical Ratings: Both daily and weekly analyses indicate a "Strong Buy" signal, suggesting sustained upward momentum.
Relative Strength Index (RSI): The weekly RSI stands at 85.19, indicating the stock is in overbought territory, which may suggest a potential short-term pullback.
Support and Resistance Levels:
Immediate Support: ₹7,193
Immediate Resistance: ₹7,890
Medium-Term Resistance: ₹8,693.86
Long-Term Resistance: ₹9,068.70
Long-Term Support: ₹6,000.50
Trend Indicators: Moving averages and other technical indicators are aligned with a bullish trend, supporting the "Strong Buy" signal.
⚠️ Considerations
Overbought Conditions: The high RSI suggests the stock may be due for a short-term consolidation or pullback.
Market Volatility: Investors should be aware of potential market fluctuations that could impact stock performance.
📊 Summary
Polycab India Ltd. is exhibiting strong bullish momentum on the weekly timeframe. While the stock's overbought condition warrants caution, the overall technical indicators support a positive outlook. Investors should monitor key support and resistance levels and consider potential short-term corrections as part of their investment strategy.
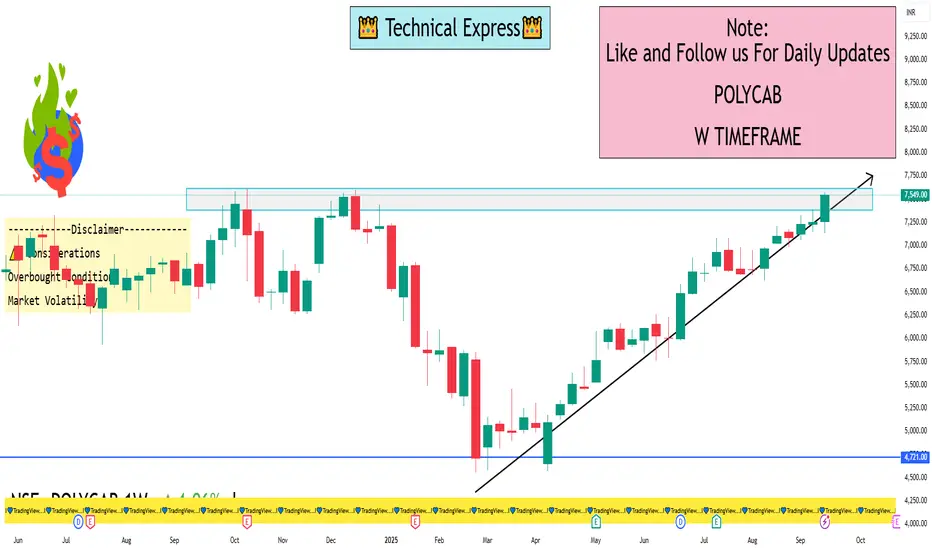
Technical Analysis - 52-Week Volume Breakout📈 SCHNEIDER ELECTRIC INFRA – TECHNICAL ANALYSIS
📆 Date: May 28, 2025
🔍 Timeframe: Daily
________________________________________
Price Action:
Schneider Electric Infra soared over 11.5% today with a strong bullish candle breaking above recent consolidation levels. This wide-range breakout candle marks a 20-day and 52-week volume breakout, indicating heavy accumulation and institutional participation. The price surged from support near ₹570 to close around ₹778.70, confirming bullish momentum.
________________________________________
Chart Pattern / Candlestick Pattern:
• Breakout Setup
• 52-Week High Breakout
• Bullish Candle with strong body and large volume
• BB Squeeze Breakout (Volatility Expansion Expected)
• Bollinger Band Expansion
• Volume Spike – highest in over a year
• Daily Chart: Bullish Initiation pattern on Heikin Ashi
• Weekly Chart: Bullish Continuation pattern formed
• Monthly Chart: Spinning Top, but with bullish undertones confirmed by volume
• Recent Candles: Long White Candle patterns on daily and monthly charts (May 28, 2025)
________________________________________
Technical Indicators:
• RSI (Daily): 79 – Strong bullish territory
• MACD: Bullish crossover active
• Stochastic: 95 – Overbought but shows strong momentum
• CCI: 188 – Momentum phase, institutional buying signs
• Volume: 5.72M – Extremely high, 20-day volume breakout
________________________________________
Support & Resistance Levels:
• Immediate Resistance: ₹814.75
• Next Resistance: ₹850.80
• Major Resistance: ₹910.20
• Immediate Support: ₹719.30
• Secondary Support: ₹659.90
• Major Support: ₹623.85
• Weak Support Zone: ₹570–₹550
________________________________________
Chart Overview:
The chart highlights:
🔸 Strong bullish candle piercing prior resistance
🔸 Volume breakout aligned with price breakout
🔸 Clear resistance cluster above ₹814–₹910
🔸 Support zone well established below ₹720
🔸 Multiple confirmations from indicators and volume surge
🔸 Entry was marked at ₹791.40 with SL at ₹651.85
________________________________________
Educational Breakdown:
This is a textbook breakout with volume confirmation setup:
• Price Action: Breakout from resistance zone
• Momentum Indicators: Strongly aligned
• Volume: Institutional spike with confirmation of trend continuation
• Band Expansion: Signals beginning of high volatility trend
• Entry Confirmation: RSI + BB + Volume breakout + Trend indicators
This setup indicates a fresh trend beginning post-accumulation phase, making it suitable for swing to positional trades. The aggressive rise also suggests short-term profit-taking zones near the immediate resistance, while medium-term targets remain valid.
________________________________________
How to Trade Schneider Electric Infra (for learning purpose):
• Entry Example: ₹791.40
• Stop Loss: ₹651.85 (Risk: ₹139.55)
• Target 1: ₹930.95 (Reward: ₹139.55)
• Target 2: ₹1070.45 (Reward: ₹279.05)
• Sample Quantity: 50 shares
• RR Ratio: 1:1 to 1:2
• Aggressive Traders: Can ride trend with trailing stop
• Conservative Traders: Wait for pullback near ₹720–₹700 before entry
⚠️ Risk Management Tip: Always trade with a clearly defined stop loss. Avoid entering positions impulsively. It is advisable to start with a smaller quantity and increase your exposure only if the price action confirms the continuation of the trend. Capital protection should always be the priority.
📢 Disclaimer
This content is created purely for educational and informational purposes. It is not intended as investment advice, stock recommendations, or trading tips. Trading and investing in the stock market involves risk. Please consult with a SEBI-registered financial advisor before making any investment decisions. The author/creator is not registered with SEBI and shall not be held responsible for any losses incurred based on this information. Always do your own research and use proper risk management.
👉 If you found this analysis helpful, don’t forget to Follow, so you never miss out on a trade-worthy setup, breakout opportunity, or valuable educational insight again. Stay updated and trade smarter! 💡📈
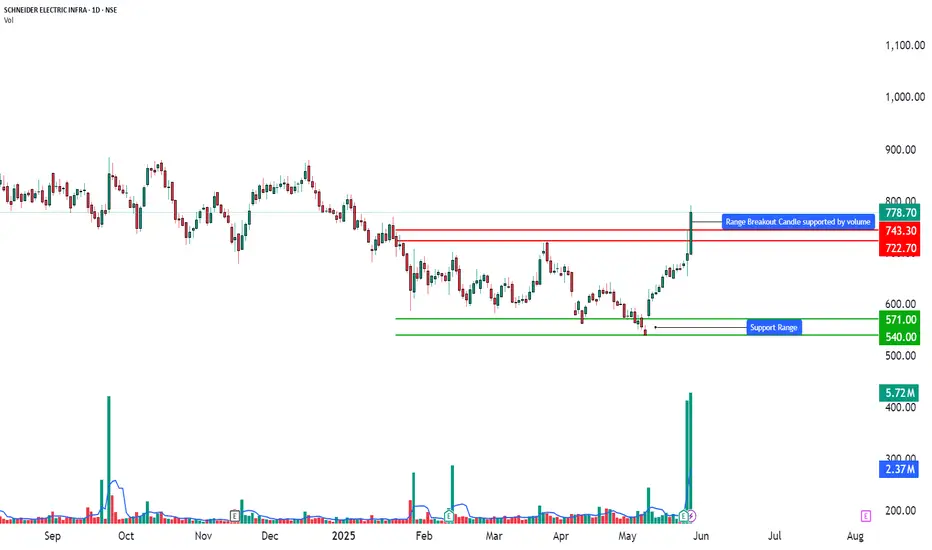
May take support near 2600-2640Reliance Industries Share Price Analysis
Current Market Context: As Reliance Industries Limited (RIL) approaches the price range of ₹2640-₹2600, it finds itself at a critical support level. This range has historically been significant for the stock, and market participants are closely monitoring price action for potential trading opportunities.
Support Analysis:
Historical Significance: The ₹2640-₹2600 range has acted as a strong support zone in previous trading sessions. This level represents an area where buying interest has consistently emerged, allowing the stock to rebound and move higher.
Volume Indicators: Increased trading volume around this support level could signal strong buyer interest, reinforcing the potential for a bounce back. Traders should watch for spikes in volume as the stock approaches this range, which could indicate accumulation by investors.
Technical Indicators: Key technical indicators, such as the Relative Strength Index (RSI) and moving averages, can provide additional insights. If the RSI approaches the oversold territory while the stock hovers near support, it may suggest that the stock is poised for a reversal.
Potential Scenarios:
Bullish Reversal: If Reliance shares hold above the ₹2640-₹2600 support level, it may attract buyers, leading to a potential upward movement. A break above recent resistance levels could pave the way for further gains.
Bearish Breakout: Conversely, if the stock fails to maintain support and breaks below ₹2600, it may signal a bearish trend, prompting traders to reevaluate their positions. This could lead to increased selling pressure and further downside.
Conclusion: Investors should keep a close eye on the ₹2640-₹2600 support level for Reliance Industries shares. Monitoring market sentiment, trading volume, and technical indicators will be crucial in determining the next steps. A solid bounce from this support could present a buying opportunity, while a decisive break below may warrant caution. As always, consider risk management strategies and conduct thorough research before making investment decisions.

SAMMAAN Capital: Trendline Breakout, Chart of the weekFrom Housing Finance Giant to NBFC Phoenix: Why NSE:SAMMAANCAP Breakout Could Signal a Multi-Bagger Opportunity. Let's Analyse in the Chart of the Week.
As per the Latest SEBI Mandate, this isn't a Trading/Investment RECOMMENDATION nor for Educational Purposes; it is just for Informational purposes only. The chart data used is 3 Months old, as Showing Live Chart Data is not allowed according to the New SEBI Mandate.
Disclaimer: "I am not a SEBI REGISTERED RESEARCH ANALYST AND INVESTMENT ADVISER."
This analysis is intended solely for informational purposes and should not be interpreted as financial advice. It is advisable to consult a qualified financial advisor or conduct thorough research before making investment decisions.
Price Action Analysis:
Overall Trend Structure:
- The stock has been in a prolonged downtrend from its recent high of ₹260 in early 2022
- A major capitulation event occurred in July 2024, creating a panic low at ₹79.38
- Since the July 2024 low, the stock has formed a clear accumulation phase with higher lows
- Recent price action shows a strong breakout from a descending trendline that acted as resistance since early 2024
- Current price at ₹165.03 represents a 107% rally from the lows, indicating strong momentum recovery
Candlestick Patterns & Momentum:
- The most recent weekly candle shows a massive bullish engulfing pattern with a substantial body, suggesting strong buying conviction
- Price has cleared multiple resistance zones with authority, indicating institutional accumulation
- The breakout candle shows no upper wick, demonstrating aggressive buying and a lack of selling pressure at higher levels
- Consecutive green candles in recent weeks suggest sustained buying interest
- The price action exhibits characteristics of a potential trend reversal from bear to bull phase
Moving Averages & Dynamic Support:
- Price has reclaimed all major short-term moving averages
- The stock is now trading above its 50-week moving average
- A golden cross formation appears imminent as shorter-term MAs cross above longer-term MAs
- Previous resistance zones are now expected to act as support on pullbacks
Volume Spread Analysis:
Volume Profile:
- Massive volume spike on the latest breakout candle (462.74M vs average 86.92M) - approximately 5.3x the average volume
- This represents the highest volume since early 2022, indicating significant institutional participation
- Volume during the accumulation phase (July 2024 - September 2025) was relatively subdued, typical of smart money accumulation
- Previous high-volume events coincided with panic selling in 2022 and mid-2024
- Current volume expansion during upward movement is a classic sign of breakout validity
Volume-Price Correlation:
- The price-to-volume ratio shows a healthy correlation during the recent rally
- Higher volume on up days compared to down days indicates bullish sentiment
- The massive volume breakout suggests this move has strong institutional backing
- No signs of distribution (high volume on down days) at current levels
Volume Analysis Inference:
- The 5x volume expansion confirms a genuine breakout rather than a false move
- Smart money appears to be entering positions aggressively
- Retail participation is likely to increase given the media coverage and the F&O ban lifting
- Volume profile supports continuation of the uptrend in the near-term
Key Support & Resistance Levels:
Major Resistance Zones:
- R1 (Immediate): ₹175-180 - Minor psychological resistance
- R2 (Near-term): ₹200-220 - Previous consolidation zone and descending trendline confluence
- R3 (Major): ₹240-260 - Recent high zone with significant supply potential
- R4 (Psychological): ₹300 - Round number psychological barrier
Major Support Zones:
- S1 (Immediate): ₹150-155 - Recent breakout level, now acting as support
- S2 (Strong): ₹135-140 - Multiple touch points and previous resistance turned support
- S3 (Critical): ₹113-120 - Horizontal support zone with high volume node
- S4 (Ultimate): ₹100-105 - Major accumulation zone and swing low area
Key Price Levels to Watch:
- Breakdown level to watch: ₹145 (invalidation of bullish setup)
- Pivotal zone: ₹135-140 (must hold for bullish continuation)
- Stop-loss zone for longs: Below ₹130
Base Formation & Pattern Recognition:
Primary Base Structure:
- The base shows characteristics of a "Stage 1" accumulation base as per the Weinstein methodology
Secondary Patterns Identified:
- Descending Channel: From January 2024 to September 2025, the stock traded within a falling channel
- Breakout Pattern: Recent weekly candle broke above the descending trendline resistance with authority
- Double Bottom: A smaller double bottom formation exists at the ₹100-105 level (June-July 2025)
- Higher Low Sequence: Since the July 2024 bottom, the stock has made consistent higher lows - ₹79, ₹100, ₹130, ₹135
Pattern Implications:
- The quality of base formation (15 months) indicates strong institutional accumulation
Technical Indicators Assessment:
Trend Indicators:
- Price trading above descending trendline for the first time in 18 months
- Structure shifted from lower highs/lower lows to higher highs/higher lows
- Breakout above multi-month resistance confirms trend reversal
- Weekly timeframe showing a clear momentum shift
Volatility Indicators:
- Recent expansion in price range indicates increasing volatility
- Volatility expansion during upward movement is a bullish characteristic
- ATR (Average True Range) is likely expanding, providing better trading opportunities
Diversification Rules:
- Maximum NBFC/Financial sector exposure: 15-20% of portfolio
- Since Sammaan Capital is an NBFC, ensure other NBFC holdings don't exceed the sector limit
- Correlation check: Avoid overweight in stocks moving in tandem
- Rebalance if a single position grows beyond 10% due to appreciation
Risk Management Framework:
Technical Risk Factors:
- Breakout failure risk: 30% probability of pullback to ₹140-150
- False breakout risk: Volume sustenance needed for confirmation
- Resistance rejection risk: ₹220 zone has strong supply potential
- Trend reversal risk: Any weekly close below ₹130 invalidates the bullish thesis
- Volatility risk: NBFC stocks prone to sudden regulatory/news-driven moves
Risk Mitigation Strategies:
- Never invest more than planned position size, even if the setup looks perfect
- Use limit orders instead of market orders to avoid slippage
- Don't average down if SL is hit - accept loss and re-evaluate
- Keep a 30% cash reserve for better entry opportunities
- Use trailing stops religiously once in profit
- Maintain a trading journal to track decisions and learn from mistakes
Portfolio Risk Constraints:
- Maximum drawdown tolerance: 20% on this position
- Overall portfolio heat: Not more than 4-5% at risk across all open positions
- Correlation check: If market corrects 5%, financial stocks may correct 7-8%
- Sector concentration: Limit NBFC exposure even if multiple opportunities arise
- Black swan provision: Always keep an emergency exit plan
Risk Monitoring Checklist:
- Daily: Check if price respects support zones
- Weekly: Review volume patterns and trend integrity
- Monthly: Reassess fundamental drivers and news flow
- Quarterly: Deep-dive into earnings, asset quality, regulatory changes
- Event-driven: Monitor RBI policies, interest rate decisions, sector news
Exit Risk Management:
- Never hold through a major support breakdown, hoping for recovery
- If SL hit, stay away for 2-3 weeks before re-entry consideration
- Avoid revenge trading after the stop-loss trigger
- Book partial profits at predetermined levels - don't get greedy
- If the target is achieved faster than expected, evaluate for signs of exhaustion
Sectoral Analysis - NBFC & Housing Finance:
NBFC Sector Overview:
- NSE:SAMMAANCAP is a mortgage-focused non-banking financial company (NBFC) regulated by the Reserve Bank of India (RBI) and rated 'AA' by CRISIL and ICRA
- The NBFC sector has witnessed consolidation over the past 3 years post-COVID disruptions
- The regulatory framework has tightened with the RBI implementing scale-based regulations
- A favourable policy environment exists with a stable macroeconomic backdrop
- Housing finance remains a priority sector with government's push for affordable housing
Current Sector Dynamics:
- Interest rate cycle appears to be stabilising after aggressive hikes in 2022-2023
- Credit growth in retail segments (housing, LAP) remains robust at 15-18% YoY
- Asset quality concerns have moderated across the NBFC sector
- Competition is intensifying with banks offering competitive home loan rates
- Digital transformation and fintech partnerships reshaping distribution
Sector Growth Drivers:
- India's housing demand remains strong, driven by urbanization and nuclear families
- Under-penetrated mortgage market compared to developed economies (10% vs 50-70% mortgage-to-GDP)
- Government schemes like PMAY (Pradhan Mantri Awas Yojana) support affordable housing
- The Loan Against Property (LAP) segment is growing as businesses seek growth capital
- Co-lending arrangements between NBFCs and banks gaining traction
Sector Headwinds:
- Asset-liability management challenges for smaller NBFCs
- Rising cost of funds impacting margins
- Regulatory compliance costs are increasing
- Competition from banks with lower cost of funds
- Economic slowdown risks impacting borrower repayment capacity
Regulatory Environment:
- RBI's scale-based regulation framework implemented in October 2022
- Enhanced monitoring of large NBFCs (asset size >₹10,000 crore)
- Stricter provisioning and capital adequacy norms
- Focus on corporate governance and risk management frameworks
- Recent F&O ban lifting indicates regulatory confidence restoration
Fundamental Analysis:
Business Model & Operations:
- Incorporated in 2005, registered and regulated by the National Housing Bank (NHB), engaged in providing home loans, loans against property, corporate mortgage loans, lease rental discounting, and residential construction finance
- The company has adopted an asset-light business model with a differentiated origination strategy and proven co-lending execution across affordable housing and MSME segments
- Operates with co-lending partnerships - had 10 bank partnerships as of September 2024, with plans to increase to 12 by March 2025
- Product portfolio: Home Loans, Loan Against Property (LAP), Construction Finance, Lease Rental Discounting
Financial Performance Analysis
- Market capitalization: ₹13,670 crore; Revenue: ₹8,947 crore; Current year profit: -₹1,800 crore
- The company has delivered poor sales growth of -8% over the past five years
- Q1 FY26: Reported profit of ₹334 crore on total income of ₹2,400 crore; For FY25, posted loss of -₹1,807 crore on total income of ₹8,676 crore
- Recent profitability turnaround visible in quarterly results suggests business stabilization
- The company has a low interest coverage ratio, indicating higher financial leverage
Recent Corporate Developments:
- Abu Dhabi's IHC (International Holding Company) approved preferential allotment to buy 43.5% stake for ₹8,850 crore through Avenir Investment RSC Ltd, paving the way for IHC to assume promoter status
- This massive foreign investment indicates strong confidence in turnaround story
- Company rebranded from Indiabulls Housing Finance to Sammaan Capital to shed legacy issues
- Credit ratings upgraded by S&P and Moody's changed outlook to 'positive' from 'stable'; retained AA/Stable rating from CRISIL and ICRA
- F&O ban recently lifted, signalling renewed market confidence
Asset Quality & Risk Metrics:
- Assets Under Management of ₹12,777 crore as of September 2024
- Shift towards an asset-light model, reducing balance sheet risk
- Co-lending partnerships diversify risk and improve capital efficiency
- Need to monitor gross NPA and net NPA trends in upcoming quarters
- Provisioning coverage ratio and capital adequacy ratio are key metrics to watch
Valuation Metrics:
- PE ratio currently at 0, indicating the company was loss-making in the recent period
- Market cap growth of 3.48% the last 1 year - recent rally not fully reflected in this data
- Price-to-Book ratio likely attractive given low valuation during the distress period
- Current valuation at ₹165 offers asymmetric risk-reward if turnaround sustains
- Comparable NBFCs trading at 1.5-3x book value; Sammaan could rerate as profitability improves
Management & Corporate Governance:
- Company underwent significant management changes post-rebranding
- Abu Dhabi's IHC taking promoter status brings international credibility
- Focus on transparent reporting and governance improvements post legacy issues
- Strategic shift to asset-light model shows adaptive management
Competitive Position & Market Share:
- Competes with players like HDFC Ltd, LIC Housing Finance, PNB Housing, and Bajaj Housing Finance
- Differentiated strategy focusing on emerging geographies and affordable housing segment
- Co-lending model provides a competitive advantage in a capital-constrained environment
- Brand recall is still building after rebranding from Indiabulls
Key Strengths:
- Strong rating from CRISIL and ICRA (AA/Stable) indicates a robust credit profile
- ₹8,850 crore investment by Abu Dhabi's IHC validates business potential
- Asset-light model reduces capital requirements and improves ROE potential
- Regulatory compliance and risk management frameworks strengthened
- Experienced in affordable housing and MSME lending segments
Key Concerns & Risks:
- Historical loss of ₹1,800 crore in FY25 raises sustainability questions
- Poor revenue growth of -8.08% over 5 years indicates business challenges
- A low interest coverage ratio suggests vulnerability to interest rate volatility
- Ongoing investigations related to past operations remain overhang
- Execution risk in scaling up co-lending partnerships
- Asset quality deterioration risk if economic conditions weaken
Integrated Technical-Fundamental Outlook:
Confluence Factors Supporting Bullish Thesis:
- Technical breakout coinciding with fundamental catalysts (IHC investment, F&O ban lifting)
- Volume expansion confirming institutional interest aligning with ₹8,850 crore IHC investment
- 15-month base formation suggesting strong accumulation by informed investors
- Credit rating upgrades provide fundamental validation to the technical setup
- Quarterly profitability turnaround supporting higher valuation rerating
Scenario Analysis:
Bull Case Scenario
- IHC investment successfully closes and brings operational improvements
- Asset quality remains stable, and profitability is sustained in the upcoming quarters
- Co-lending partnerships expand as planned, driving AUM growth
Base Case Scenario
- Business stabilises with moderate growth in AUM and profitability
- Volatility remains elevated due to sector and stock-specific news
Bear Case Scenario
- Asset quality deterioration or operational challenges emerge
- IHC deal gets delayed or faces regulatory hurdles
- Technical breakdown below ₹145 leads to retest of ₹120-130 zone
- Macro headwinds (RBI policy tightening, economic slowdown) impact the sector
- Exit recommended if the weekly close is below ₹130
Critical Events to Monitor:
Next 3 Months:
- Completion of IHC preferential allotment and fund infusion
- Q2 FY26 earnings (October/November 2025) - profitability sustainability check
- Any regulatory updates or clarifications on past investigations
- Technical retest of ₹150-155 support zone and price reaction
Next 6 Months:
- Q3 FY26 earnings showing consistent profitability
- Expansion of co-lending partnerships (target 12 banks)
- AUM growth trajectory and disbursement trends
- NPA trends and provisioning coverage
- Technical breakout above ₹220 resistance
Next 12 Months:
- Full-year FY26 results demonstrating turnaround completion
- Market share gains in affordable housing and LAP segments
- ROE and ROA improvement trends
- PE multiple rerating towards industry average
Recommended Action Plan:
- Allocate 4-6% of portfolio with strict stop-loss discipline
- Book partial profits
- Trail remaining position
- Monitor quarterly results and credit metrics religiously
- Re-evaluate thesis if any fundamental red flag emerges
My 2 Cents:
The chart presents a textbook example of a turnaround setup with a well-defined 15-month base formation, decisive breakout on exceptional volume (5.3x average), and a clear risk-reward structure. The combination of descending channel breakout and momentum shift from lower lows to higher highs creates a compelling technical narrative.
NSE:SAMMAANCAP represents a high-risk, high-reward turnaround play backed by credible fundamental catalysts. The ₹8,850 crore investment by Abu Dhabi's IHC provides a strong validation of intrinsic value. The transition to an asset-light model, credit rating upgrades, and return to quarterly profitability suggest the worst may be behind. However, the legacy of past losses, low interest coverage, and ongoing investigations warrants cautious optimism and strict risk management.
Full Coverage on my Newsletter this Week
Keep in the Watchlist and DOYR.
NO RECO. For Buy/Sell.
📌Thank you for exploring my idea! I hope you found it valuable.
🙏FOLLOW for more
👍BOOST if you found it useful.
✍️COMMENT below with your views.
Meanwhile, check out my other stock ideas on the right side until this trade is activated. I would love your feedback.
As per the Latest SEBI Mandate, this isn't a Trading/Investment RECOMMENDATION nor for Educational Purposes; it is just for Informational purposes only. The chart data used is 3 Months old, as Showing Live Chart Data is not allowed according to the New SEBI Mandate.
Disclaimer: "I am not a SEBI REGISTERED RESEARCH ANALYST AND INVESTMENT ADVISER."
This analysis is intended solely for informational purposes and should not be interpreted as financial advice. It is advisable to consult a qualified financial advisor or conduct thorough research before making investment decisions.